Global Screw Pumps Market is projected to reach USD 4.6 billion by 2023 | Techsci Research
Global screw pumps market stood at $ 3 billion in 2017 and is projected to reach $ 4.6 billion by 2023. Anticipated increase in screw pump sales can be attributed to robust growth in water treatment industry and rising oil & gas exploration activities.
Global screw pumps market stood at $ 3 billion in 2017 and is projected to reach $ 4.6 billion by 2023. Anticipated increase in screw pump sales can be attributed to robust growth in water treatment industry and rising oil & gas exploration activities.
You also want an ePaper? Increase the reach of your titles
YUMPU automatically turns print PDFs into web optimized ePapers that Google loves.
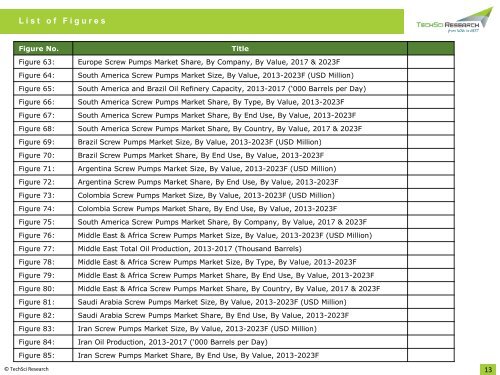
L i s t o f F i g u r e s<br />
Figure No.<br />
Title<br />
Figure 63: Europe <strong>Screw</strong> <strong>Pumps</strong> <strong>Market</strong> Share, By Company, By Value, 2017 & <strong>2023</strong>F<br />
Figure 64: South America <strong>Screw</strong> <strong>Pumps</strong> <strong>Market</strong> Size, By Value, 2013-<strong>2023</strong>F (<strong>USD</strong> Million)<br />
Figure 65: South America and Brazil Oil Refinery Capacity, 2013-2017 (‘000 Barrels per Day)<br />
Figure 66: South America <strong>Screw</strong> <strong>Pumps</strong> <strong>Market</strong> Share, By Type, By Value, 2013-<strong>2023</strong>F<br />
Figure 67: South America <strong>Screw</strong> <strong>Pumps</strong> <strong>Market</strong> Share, By End Use, By Value, 2013-<strong>2023</strong>F<br />
Figure 68: South America <strong>Screw</strong> <strong>Pumps</strong> <strong>Market</strong> Share, By Country, By Value, 2017 & <strong>2023</strong>F<br />
Figure 69: Brazil <strong>Screw</strong> <strong>Pumps</strong> <strong>Market</strong> Size, By Value, 2013-<strong>2023</strong>F (<strong>USD</strong> Million)<br />
Figure 70: Brazil <strong>Screw</strong> <strong>Pumps</strong> <strong>Market</strong> Share, By End Use, By Value, 2013-<strong>2023</strong>F<br />
Figure 71: Argentina <strong>Screw</strong> <strong>Pumps</strong> <strong>Market</strong> Size, By Value, 2013-<strong>2023</strong>F (<strong>USD</strong> Million)<br />
Figure 72: Argentina <strong>Screw</strong> <strong>Pumps</strong> <strong>Market</strong> Share, By End Use, By Value, 2013-<strong>2023</strong>F<br />
Figure 73: Colombia <strong>Screw</strong> <strong>Pumps</strong> <strong>Market</strong> Size, By Value, 2013-<strong>2023</strong>F (<strong>USD</strong> Million)<br />
Figure 74: Colombia <strong>Screw</strong> <strong>Pumps</strong> <strong>Market</strong> Share, By End Use, By Value, 2013-<strong>2023</strong>F<br />
Figure 75: South America <strong>Screw</strong> <strong>Pumps</strong> <strong>Market</strong> Share, By Company, By Value, 2017 & <strong>2023</strong>F<br />
Figure 76: Middle East & Africa <strong>Screw</strong> <strong>Pumps</strong> <strong>Market</strong> Size, By Value, 2013-<strong>2023</strong>F (<strong>USD</strong> Million)<br />
Figure 77: Middle East Total Oil Production, 2013-2017 (Thousand Barrels)<br />
Figure 78: Middle East & Africa <strong>Screw</strong> <strong>Pumps</strong> <strong>Market</strong> Size, By Type, By Value, 2013-<strong>2023</strong>F<br />
Figure 79: Middle East & Africa <strong>Screw</strong> <strong>Pumps</strong> <strong>Market</strong> Share, By End Use, By Value, 2013-<strong>2023</strong>F<br />
Figure 80: Middle East & Africa <strong>Screw</strong> <strong>Pumps</strong> <strong>Market</strong> Share, By Country, By Value, 2017 & <strong>2023</strong>F<br />
Figure 81: Saudi Arabia <strong>Screw</strong> <strong>Pumps</strong> <strong>Market</strong> Size, By Value, 2013-<strong>2023</strong>F (<strong>USD</strong> Million)<br />
Figure 82: Saudi Arabia <strong>Screw</strong> <strong>Pumps</strong> <strong>Market</strong> Share, By End Use, By Value, 2013-<strong>2023</strong>F<br />
Figure 83: Iran <strong>Screw</strong> <strong>Pumps</strong> <strong>Market</strong> Size, By Value, 2013-<strong>2023</strong>F (<strong>USD</strong> Million)<br />
Figure 84: Iran Oil Production, 2013-2017 (‘000 Barrels per Day)<br />
Figure 85: Iran <strong>Screw</strong> <strong>Pumps</strong> <strong>Market</strong> Share, By End Use, By Value, 2013-<strong>2023</strong>F<br />
© TechSci <strong>Research</strong><br />
13


