Supply Chain Analytics Predicting Optimal Selling Price
The selling price of an item can be unpredictable given the variety of economic factors influencing this number Explore insights Analance found while analyzing data with selling price as the target variable using multiple econometric predictors. https://goo.gl/4BXS8m
The selling price of an item can be unpredictable given the variety of economic factors influencing this number Explore insights Analance found while analyzing data with selling price as the target variable using multiple econometric predictors. https://goo.gl/4BXS8m

Create successful ePaper yourself
Turn your PDF publications into a flip-book with our unique Google optimized e-Paper software.
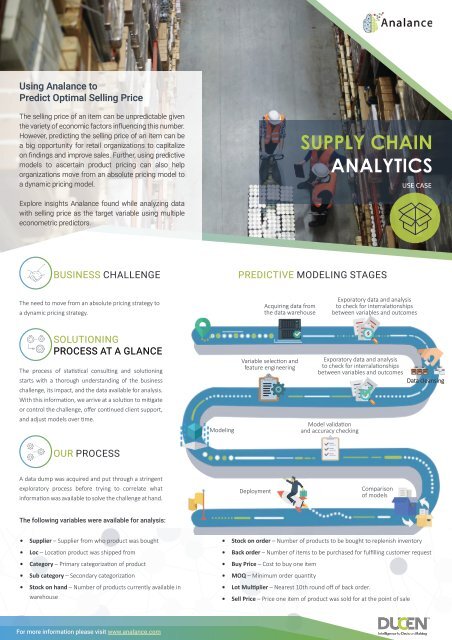
Using Analance to<br />
Predict <strong>Optimal</strong> <strong>Selling</strong> <strong>Price</strong><br />
The selling price of an item can be unpredictable given<br />
the variety of economic factors influencing this number.<br />
However, predicting the selling price of an item can be<br />
a big opportunity for retail organizations to capitalize<br />
on findings and improve sales. Further, using predictive<br />
models to ascertain product pricing can also help<br />
organizations move from an absolute pricing model to<br />
a dynamic pricing model.<br />
SUPPLY CHAIN<br />
ANALYTICS<br />
USE CASE<br />
Explore insights Analance found while analyzing data<br />
with selling price as the target variable using multiple<br />
econometric predictors.<br />
BUSINESS CHALLENGE<br />
PREDICTIVE MODELING STAGES<br />
The need to move from an absolute pricing strategy to<br />
a dynamic pricing strategy.<br />
Acquiring data from<br />
the data warehouse<br />
Exporatory data and analysis<br />
to check for interralationships<br />
between variables and outcomes<br />
SOLUTIONING<br />
PROCESS AT A GLANCE<br />
The process of statistical consulting and solutioning<br />
starts with a thorough understanding of the business<br />
Variable selection and<br />
feature engineering<br />
Exporatory data and analysis<br />
to check for interralationships<br />
between variables and outcomes<br />
Data cleansing<br />
challenge, its impact, and the data available for analysis.<br />
With this information, we arrive at a solution to mitigate<br />
or control the challenge, offer continued client support,<br />
and adjust models over time.<br />
Modeling<br />
Model validation<br />
and accuracy checking<br />
OUR PROCESS<br />
A data dump was acquired and put through a stringent<br />
exploratory process before trying to correlate what<br />
information was available to solve the challenge at hand.<br />
Deployment<br />
Comparison<br />
of models<br />
The following variables were available for analysis:<br />
• Supplier – Supplier from who product was bought<br />
• Loc – Location product was shipped from<br />
• Category – Primary categorization of product<br />
• Sub category – Secondary categorization<br />
• Stock on hand – Number of products currently available in<br />
warehouse<br />
• Stock on order – Number of products to be bought to replenish inventory<br />
• Back order – Number of items to be purchased for fulfilling customer request<br />
• Buy <strong>Price</strong> – Cost to buy one item<br />
• MOQ – Minimum order quantity<br />
• Lot Multiplier – Nearest 10th round off of back order.<br />
• Sell <strong>Price</strong> – <strong>Price</strong> one item of product was sold for at the point of sale<br />
For more information please visit www.analance.com
THE MODELING PROCESS<br />
A Mathematical/Statistical/Econometric predictive model is a method<br />
of representing a variable of interest (outcome) as a function of other<br />
variables (predictors) with an assumed relationship between the outcome<br />
and predictors.<br />
All variables available were studied to understand distributions. Data was<br />
cleaned by the means of handling outlying values, missing values, and<br />
looking for inter-relationships between predictors before looking to see if<br />
any data had a significant relationship with the outcome.<br />
Outlying values were removed from the data after which missing values<br />
were replaced with column means (average value) for numeric data and<br />
column modes (most frequent label) for categorical or ordered data. The<br />
industry standard Box Plot was used to check for outliers and a tabulation<br />
or summary of data was used to check for missing values. If two or more<br />
predictors were inter-related (for instance height in cm, height in inches,<br />
height in feet), only one was used.<br />
The industry standard metric VIF (Variance Inflation Factor) was used as a<br />
deciding factor. Predictors with VIF values above 6, indicating a significant<br />
inter-relationship with another predictor/s, were removed from the analysis.<br />
The industry standard statistical test used to check for relationships between<br />
predictors and the outcome of interest is the Chi-Squared test of association.<br />
A p-value less than .05 indicates that the probability of association occurring<br />
in the population is less than 5% and is of no significance. Using this test<br />
for all predictor-outcome combinations helped in restricting the analysis for<br />
only those predictors that majorly influenced readmissions.<br />
A further exhaustive exploratory analysis of data using graphs and advanced<br />
visualizations found that:<br />
• Minimum order quantity is significantly related to selling price.<br />
• Lot multiplier is significantly related to selling price.<br />
• Supplier variety is significantly related to selling price.<br />
• Product categorization is significantly related to selling price.<br />
• Stock on hand is significantly related to selling price.<br />
• Back order quantity is significantly related to selling price.<br />
• Buying price is the strongest predictor of selling price.<br />
CONCLUSION AND RECOMMENDATIONS<br />
The buying price of the product came out to be the strongest predictor of<br />
selling price. The multiple linear regression model was able to predict 92.6% of<br />
data variation and the model was a statistically significant fit for the data. It was<br />
the overall winner of predictive ability as measured by the Root Mean Squared<br />
Error. Multiple linear regression also came out as the best, as validated by the<br />
RMSE, among the models chosen for the analysis and prediction.<br />
Using models similar to those developed in this project, businesses have the<br />
ability to predict the optimal selling price of a product. They can transform from<br />
using an absolute pricing model to a dynamic pricing model where product<br />
prices are determined in real time. Dynamic pricing is a win-win for customers<br />
and sellers as the price sold or bought for is optimal for both parties. Further,<br />
the addition of other significant econometric factors can enhance and improve<br />
the predictability and accuracy of the model/s involved, further increasing the<br />
benefits for both the parties.<br />
MODEL USED<br />
The modeling process began with using the industry preferred choice (namely,<br />
Multiple Linear Regression). Other models, such as Decision Trees, Random<br />
Forest, Bayesian Regression, and Neural Networks, were also considered and<br />
results from them were analyzed to find the top performing model.<br />
We decided which model was most effective using the following tabulation of<br />
the model against the industry standard metric RMSE.<br />
For more information please visit www.analance.com