

Global Smartwatch Market
The report analyzes the Smartwatch Market by Product Type of Smartwatch (Extension, Standalone and Classic/Hybrid), By Operating System (WatchOS, WearOS, Tizen, RTOS, and Others), and By Distribution Channel (Offline and Online). The Smartwatch market has been analyzed By Region (North America, Europe, Asia Pacific and Rest of the World) and By Country (US, Canada, UK, Germany, France, Italy, China, Japan, India, and Australia) for the historical period of 2014-2018 and the forecast period of 2019-2024. Visit us: http://azothanalytics.com/research/consumer-retail-c4
The report analyzes the Smartwatch Market by Product Type of Smartwatch (Extension, Standalone and Classic/Hybrid), By Operating System (WatchOS, WearOS, Tizen, RTOS, and Others), and By Distribution Channel (Offline and Online). The Smartwatch market has been analyzed By Region (North America, Europe, Asia Pacific and Rest of the World) and By Country (US, Canada, UK, Germany, France, Italy, China, Japan, India, and Australia) for the historical period of 2014-2018 and the forecast period of 2019-2024. Visit us: http://azothanalytics.com/research/consumer-retail-c4

Create successful ePaper yourself
Turn your PDF publications into a flip-book with our unique Google optimized e-Paper software.
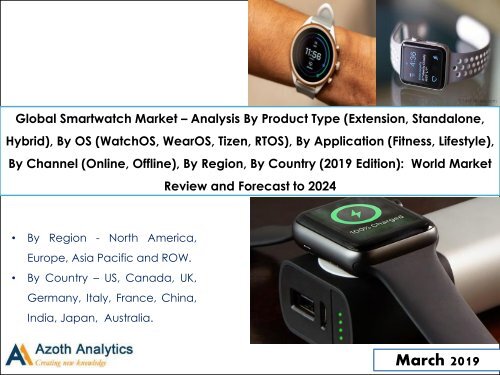
<strong>Global</strong> <strong>Smartwatch</strong> <strong>Market</strong> – Analysis By Product Type (Extension, Standalone,<br />
Hybrid), By OS (WatchOS, WearOS, Tizen, RTOS), By Application (Fitness, Lifestyle),<br />
By Channel (Online, Offline), By Region, By Country (2019 Edition): World <strong>Market</strong><br />
Review and Forecast to 2024<br />
• By Region - North America,<br />
Europe, Asia Pacific and ROW.<br />
• By Country – US, Canada, UK,<br />
Germany, Italy, France, China,<br />
India, Japan, Australia.<br />
March 2019
<strong>Global</strong><br />
Regional<br />
Scope of the Report – <strong>Global</strong> <strong>Smartwatch</strong> <strong>Market</strong><br />
Historical<br />
Forecast<br />
<strong>Market</strong><br />
By Product Type,<br />
By Value<br />
By Operating<br />
System,<br />
By Value<br />
By Distribution<br />
Channel, By Type<br />
<strong>Market</strong><br />
(By Value)<br />
By Product Type,<br />
By Value<br />
By Operating<br />
System,<br />
By Value<br />
By Distribution<br />
Channel, By Type<br />
2014 2015 2016 2017 2018 2019 2020 2021 2022 2023 2024<br />
Value<br />
Volume<br />
Extension<br />
Standalone<br />
Classic/Hybrid<br />
WatchOS<br />
Android/Wear<br />
OS<br />
Tizen<br />
RTOS<br />
Others<br />
Online<br />
Offline<br />
Extension<br />
Standalone<br />
Classic/Hybrid<br />
WatchOS<br />
Android/Wear<br />
OS<br />
Tizen<br />
RTOS<br />
Others<br />
Online<br />
Offline<br />
2
Country<br />
Scope of the Report – <strong>Global</strong> <strong>Smartwatch</strong> <strong>Market</strong><br />
Historical<br />
Forecast<br />
2014 2015 2016 2017 2018 2019 2020 2021 2022 2023 2024<br />
<strong>Market</strong><br />
(By Value)<br />
By Product<br />
Type,<br />
By Value<br />
Extension<br />
Standalone<br />
Classic/Hybrid<br />
WatchOS<br />
By Operating<br />
System,<br />
By Value<br />
Android/WearOS<br />
Tizen<br />
RTOS<br />
Others<br />
By<br />
Distribution<br />
Channel, By<br />
Type<br />
Online<br />
Offline<br />
Company Analysis<br />
Regional Analysis<br />
Country Analysis<br />
Apple, Sony Corporation, Fossil Group, Xiaomi Corporation, TomTom International, Samsung, Garmin Ltd,<br />
Fitbit and Huawei Technologies Co. Ltd.<br />
North America, Europe, APAC, ROW<br />
US, Canda, UK, Germany, France, Italy, China, Japan, Australia, India.<br />
3
Table of Content<br />
S.No Particulars Page No.<br />
1. Research Methodology 30<br />
2. Executive Summary 31<br />
3. Strategic Recommendation 32<br />
3.1 Focus on the 33<br />
3.2 Focus on the Asia-Pacific Region 33<br />
4. <strong>Smartwatch</strong> <strong>Market</strong> : Product Outlook 34<br />
5. <strong>Global</strong> <strong>Smartwatch</strong> <strong>Market</strong> : An Analysis 41<br />
5.1 By Value (2014-2018) 42<br />
5.2 By Volume (2014-2018) 43<br />
5.3 By Value (2019-2024) 50<br />
5.4 By Volume (2019-2024) 51<br />
6. <strong>Global</strong> <strong>Smartwatch</strong> <strong>Market</strong> : Segmental Analysis 52<br />
6.1 <strong>Global</strong> <strong>Smartwatch</strong> <strong>Market</strong> – By Product Type 53<br />
6.1.1 <strong>Global</strong> <strong>Smartwatch</strong> <strong>Market</strong>, By Extension, By Value 2014-2018 54<br />
6.1.2 <strong>Global</strong> <strong>Smartwatch</strong> <strong>Market</strong>, By Extension, By Value 2019-2024 55<br />
6.1.3 <strong>Global</strong> <strong>Smartwatch</strong> <strong>Market</strong>, By Standalone, By Value 2014-2018 56<br />
4
S.No<br />
Table of Content<br />
Particulars<br />
Page<br />
No.<br />
6.1.4 <strong>Global</strong> <strong>Smartwatch</strong> <strong>Market</strong>, By Standalone, By Value 2019-2024 57<br />
6.1.5 <strong>Global</strong> <strong>Smartwatch</strong> <strong>Market</strong>, By Classic/Hybrid, By Value 2014-2018 58<br />
6.1.6 <strong>Global</strong> <strong>Smartwatch</strong> <strong>Market</strong>, By Classic/Hybrid, By Value 2019-2024 59<br />
6.2 <strong>Global</strong> <strong>Smartwatch</strong> <strong>Market</strong> – By Operating System 60<br />
6.2.1 <strong>Global</strong> <strong>Smartwatch</strong> <strong>Market</strong>, By WatchOS, By Value 2014-2024 61<br />
6.2.3 <strong>Global</strong> <strong>Smartwatch</strong> <strong>Market</strong>, By WearOS, By Value 2014-2024 62<br />
6.2.5 <strong>Global</strong> <strong>Smartwatch</strong> <strong>Market</strong>, By Tizen, By Value 2014-2024 63<br />
6.2.7 <strong>Global</strong> <strong>Smartwatch</strong> <strong>Market</strong>, By RTOS, By Value 2014-2024 64<br />
6.2.9 <strong>Global</strong> <strong>Smartwatch</strong> <strong>Market</strong>, By Others, By Value 2014-2024 65<br />
6.3 <strong>Global</strong> <strong>Smartwatch</strong> <strong>Market</strong> – By Distribution Channel 66<br />
6.3.1 <strong>Global</strong> <strong>Smartwatch</strong> <strong>Market</strong>, By Offline, By Value 2014-2018 67<br />
5
S.No<br />
Table of Content<br />
Particulars<br />
Page<br />
No.<br />
6.3.2 <strong>Global</strong> <strong>Smartwatch</strong> <strong>Market</strong>, By Offline, By Value 2019-2024 68<br />
6.3.3 <strong>Global</strong> <strong>Smartwatch</strong> <strong>Market</strong>, By Online, By Value 2014-2018 69<br />
6.3.4 <strong>Global</strong> <strong>Smartwatch</strong> <strong>Market</strong>, By Online, By Value 2019-2024 70<br />
6.4 <strong>Global</strong> <strong>Smartwatch</strong> <strong>Market</strong> – By Regional Distribution (%) 71<br />
7. North America <strong>Smartwatch</strong> <strong>Market</strong> – An Analysis 73<br />
7.1 By Value (2014-2018) 76<br />
7.2 By Value (2019-2024) 80<br />
7.3 North America <strong>Smartwatch</strong> <strong>Market</strong> – By Product Type 82<br />
7.3.1 North America <strong>Smartwatch</strong> <strong>Market</strong>, By Extension, By Value 2014-2024 83<br />
7.3.2 North America <strong>Smartwatch</strong> <strong>Market</strong>, By Standalone, By Value 2014-2024 84<br />
7.3.2 North America <strong>Smartwatch</strong> <strong>Market</strong>, By Classic/Hybrid, By Value 2014-2024 85<br />
6
Table of Content<br />
S.No<br />
Particulars<br />
Page<br />
No.<br />
7.4 North America <strong>Smartwatch</strong> <strong>Market</strong> – By Operating System 86<br />
7.4.1 North America <strong>Smartwatch</strong> <strong>Market</strong>, By WatchOS, By Value 2014-2024 87<br />
7.4.2 North America <strong>Smartwatch</strong> <strong>Market</strong>, By WearOS, By Value 2014-2024 88<br />
7.4.3 North America <strong>Smartwatch</strong> <strong>Market</strong>, By Tizen, By Value 2014-2024 89<br />
7.4.4 North America <strong>Smartwatch</strong> <strong>Market</strong>, By RTOS, By Value 2014-2024 90<br />
7.4.5 North America <strong>Smartwatch</strong> <strong>Market</strong>, By Others, By Value 2014-2024 91<br />
7.5 North America <strong>Smartwatch</strong> <strong>Market</strong> – By Distribution Channel 92<br />
7.5.1 North America <strong>Smartwatch</strong> <strong>Market</strong>, By Online, By Value 2014-2024 93<br />
7.5.2 North America <strong>Smartwatch</strong> <strong>Market</strong>, By Offline, By Value 2014-2024 94<br />
7.6 North America <strong>Smartwatch</strong> <strong>Market</strong> – By Country Analysis (US and Canada) 95<br />
7.6.1 United States <strong>Smartwatch</strong> <strong>Market</strong>, By Value 2014-2018 96<br />
7.6.2 United States <strong>Smartwatch</strong> <strong>Market</strong>, By Value 2019-2024 98<br />
7.6.3 United States <strong>Smartwatch</strong> <strong>Market</strong>, By Product Type, By Value 2014-2024 99<br />
7
Table of Content<br />
S.No<br />
Particulars<br />
Page<br />
No.<br />
7.6.4 United States <strong>Smartwatch</strong> <strong>Market</strong>, By Operating System, By Value 2014-2024 100<br />
7.6.5 United States <strong>Smartwatch</strong> <strong>Market</strong>, By Distribution Channel, By Value 2014-2024 101<br />
7.6.6 United States <strong>Smartwatch</strong> <strong>Market</strong>, By Product Type, By Value 2014-2024<br />
7.6.7 Canada <strong>Smartwatch</strong> <strong>Market</strong>, By Value 2014-2018 104<br />
7.6.8 Canada <strong>Smartwatch</strong> <strong>Market</strong>, By Value 2019-2024 106<br />
7.6.9 Canada <strong>Smartwatch</strong> <strong>Market</strong>, By Product Type, By Value 2014-2024 107<br />
7.6.10 Canada <strong>Smartwatch</strong> <strong>Market</strong>, By Operating System, By Value 2014-2024 108<br />
7.6.11 Canada <strong>Smartwatch</strong> <strong>Market</strong>, By Distribution Channel, By Value 2014-2024 109<br />
8. Europe <strong>Smartwatch</strong> <strong>Market</strong> – An Analysis 111<br />
8.1 By Value (2014-2018) 112<br />
8.2 By Value (2019-2024) 115<br />
8.3 Europe <strong>Smartwatch</strong> <strong>Market</strong> – By Product Type 116<br />
8.3.1 Europe <strong>Smartwatch</strong> <strong>Market</strong>, By Extension, By Value 2014-2024 118<br />
8
S.No<br />
Table of Content<br />
Particulars<br />
Page<br />
No.<br />
8.3.2 Europe <strong>Smartwatch</strong> <strong>Market</strong>, By Standalone, By Value 2014-2024 119<br />
8.3.3 Europe <strong>Smartwatch</strong> <strong>Market</strong>, By Classic/Hybrid, By Value 2014-2024 120<br />
8.4 Europe <strong>Smartwatch</strong> <strong>Market</strong> – By Operating System 121<br />
8.4.1 Europe <strong>Smartwatch</strong> <strong>Market</strong>, By WatchOS, By Value 2014-2024 122<br />
8.4.2 Europe <strong>Smartwatch</strong> <strong>Market</strong>, By WearOS, By Value 2014-2024 123<br />
8.4.3 Europe <strong>Smartwatch</strong> <strong>Market</strong>, By Tizen, By Value 2014-2024 124<br />
8.4.4 Europe <strong>Smartwatch</strong> <strong>Market</strong>, By RTOS, By Value 2014-2024 125<br />
8.4.5 Europe <strong>Smartwatch</strong> <strong>Market</strong>, By Others, By Value 2014-2024 126<br />
8.6 Europe <strong>Smartwatch</strong> <strong>Market</strong> – By Distribution Channel 127<br />
8.6.1 Europe <strong>Smartwatch</strong> <strong>Market</strong>, By Online, By Value 2014-2024 128<br />
8.6.2 Europe <strong>Smartwatch</strong> <strong>Market</strong>, By Offline, By Value 2014-2024 129<br />
8.7 Europe <strong>Smartwatch</strong> <strong>Market</strong> – By Country Analysis (UK, Germany, France, Italy and Rest of Europe) 130<br />
9
Table of Content<br />
S.No Particulars Page No.<br />
8.7.1 United Kingdom <strong>Smartwatch</strong> <strong>Market</strong>, By Value 2014-2018 132<br />
8.7.2 United Kingdom <strong>Smartwatch</strong> <strong>Market</strong>, By Value 2019-2024 134<br />
8.7.3 United Kingdom <strong>Smartwatch</strong> <strong>Market</strong>, By Product Type, By Value 2014-2024 135<br />
8.7.4 United Kingdom <strong>Smartwatch</strong> <strong>Market</strong>, By Operating System, By Value 2014-2024 136<br />
8.7.5 United Kingdom <strong>Smartwatch</strong> <strong>Market</strong>, By Distribution Channel, By Value 2014-2024 137<br />
8.7.6 Germany <strong>Smartwatch</strong> <strong>Market</strong>, By Value 2014-2018 140<br />
8.7.7 Germany <strong>Smartwatch</strong> <strong>Market</strong>, By Value 2019-2024 142<br />
8.7.8 Germany <strong>Smartwatch</strong> <strong>Market</strong>, By Product Type, By Value 2014-2024 143<br />
8.7.9 Germany <strong>Smartwatch</strong> <strong>Market</strong>, By Operating System, By Value 2014-2024 144<br />
8.7.10 Germany <strong>Smartwatch</strong> <strong>Market</strong>, By Distribution Channel, By Value 2014-2024 145<br />
10
Table of Content<br />
S.No<br />
Particulars<br />
Page No.<br />
8.7.11 France <strong>Smartwatch</strong> <strong>Market</strong>, By Value 2014-2018 148<br />
8.7.12 France <strong>Smartwatch</strong> <strong>Market</strong>, By Value 2019-2024 150<br />
8.7.13 France <strong>Smartwatch</strong> <strong>Market</strong>, By Product Type, By Value 2014-2024 151<br />
8.7.14 France <strong>Smartwatch</strong> <strong>Market</strong>, By Operating System, By Value 2014-2024 152<br />
8.7.15 France <strong>Smartwatch</strong> <strong>Market</strong>, By Distribution Channel, By Value 2014-2024 153<br />
8.7.17 Italy <strong>Smartwatch</strong> <strong>Market</strong>, By Value 2014-2018 156<br />
8.7.18 Italy <strong>Smartwatch</strong> <strong>Market</strong>, By Value 2019-2024 158<br />
8.7.19 Italy <strong>Smartwatch</strong> <strong>Market</strong>, By Product Type, By Value 2014-2024 159<br />
8.7.20 Italy <strong>Smartwatch</strong> <strong>Market</strong>, By Operating System, By Value 2014-2024 160<br />
8.7.21 Italy <strong>Smartwatch</strong> <strong>Market</strong>, By Distribution Channel, By Value 2014-2024 161<br />
11
S.No<br />
Table of Content<br />
Particulars<br />
Page<br />
No.<br />
8.7.22 Rest of Europe <strong>Smartwatch</strong> <strong>Market</strong>, By Value 2014-2024 163<br />
8.7.23 Rest of Europe <strong>Smartwatch</strong> <strong>Market</strong>, By Product Type, By Value 2014-2024 164<br />
8.7.24 Rest of Europe <strong>Smartwatch</strong> <strong>Market</strong>, By Operating System, By Value 2014-2024 165<br />
8.7.25 Rest of Europe <strong>Smartwatch</strong> <strong>Market</strong>, By Distribution Channel, By Value 2014-2024 166<br />
9. Asia-Pacific <strong>Smartwatch</strong> <strong>Market</strong> – An Analysis 167<br />
9.1 By Value (2014-2018) 168<br />
9.2 By Value (2019-2024) 170<br />
9.3 Asia-Pacific <strong>Smartwatch</strong> <strong>Market</strong> – By Product Type 171<br />
9.3.1 Asia-Pacific <strong>Smartwatch</strong> <strong>Market</strong>, By Extension, By Value 2014-2024 173<br />
9.3.2 Asia-Pacific <strong>Smartwatch</strong> <strong>Market</strong>, By Standalone, By Value 2014-2024 174<br />
9.3.3 Asia-Pacific <strong>Smartwatch</strong> <strong>Market</strong>, By Classic/Hybrid, By Value 2014-2024 175<br />
9.4 Asia-Pacific <strong>Smartwatch</strong> <strong>Market</strong> – By Operating System 176<br />
9.4.1 Asia-Pacific <strong>Smartwatch</strong> <strong>Market</strong>, By WatchOS, By Value 2014-2024 177<br />
12
S.No<br />
Table of Content<br />
Particulars<br />
Page<br />
No.<br />
9.4.2 Asia-Pacific <strong>Smartwatch</strong> <strong>Market</strong>, By WearOS, By Value 2014-2024 178<br />
9.4.3 Asia-Pacific <strong>Smartwatch</strong> <strong>Market</strong>, By Tizen, By Value 2014-2024 179<br />
9.4.4 Asia-Pacific <strong>Smartwatch</strong> <strong>Market</strong>, By RTOS, By Value 2014-2024 180<br />
9.4.5 Asia-Pacific <strong>Smartwatch</strong> <strong>Market</strong>, By Others, By Value 2014-2024 181<br />
9.5 Asia-Pacific <strong>Smartwatch</strong> <strong>Market</strong> – By Distribution Channel 182<br />
9.5.1 Asia-Pacific <strong>Smartwatch</strong> <strong>Market</strong>, By Retail channel, By Value 2014-2024 183<br />
9.5.2 Asia-Pacific <strong>Smartwatch</strong> <strong>Market</strong>, By Online, By Value 2014-2024 184<br />
9.6 AsiaPacific <strong>Smartwatch</strong> <strong>Market</strong> – By Country Analysis (China, India, Japan, Australia and Rest of Europe) 185<br />
9.6.1 China <strong>Smartwatch</strong> <strong>Market</strong>, By Value 2014-2018 187<br />
9.6.2 China <strong>Smartwatch</strong> <strong>Market</strong>, By Value 2019-2024 189<br />
9.6.3 China <strong>Smartwatch</strong> <strong>Market</strong>, By Product Type, By Value 2014-2024 190<br />
9.6.4 China <strong>Smartwatch</strong> <strong>Market</strong>, By Operating System, By Value 2014-2024 191<br />
9.6.5 China <strong>Smartwatch</strong> <strong>Market</strong>, By Distribution Channel, By Value 2014-2024 192<br />
13
Table of Content<br />
S.No Particulars Page No.<br />
9.6.6 Japan <strong>Smartwatch</strong> <strong>Market</strong>, By Value 2014-2018 195<br />
9.6.7 Japan <strong>Smartwatch</strong> <strong>Market</strong>, By Value 2019-2024 197<br />
9.6.8 Japan <strong>Smartwatch</strong> <strong>Market</strong>, By Product Type, By Value 2014-2024 198<br />
9.6.9 Japan <strong>Smartwatch</strong> <strong>Market</strong>, By Operating System, By Value 2014-2024 199<br />
9.6.10 Japan <strong>Smartwatch</strong> <strong>Market</strong>, By Distribution Channel, By Value 2014-2024 200<br />
9.6.11 India <strong>Smartwatch</strong> <strong>Market</strong>, By Value 2014-2018 203<br />
9.6.11 India <strong>Smartwatch</strong> <strong>Market</strong>, By Value 2019-2024 205<br />
9.6.12 India <strong>Smartwatch</strong> <strong>Market</strong>, By Product Type, By Value 2014-2024 206<br />
9.6.13 India <strong>Smartwatch</strong> <strong>Market</strong>, By Operating System, By Value 2014-2024 207<br />
9.6.14 India <strong>Smartwatch</strong> <strong>Market</strong>, By Distribution Channel, By Value 2014-2024 208<br />
9.6.15 Australia <strong>Smartwatch</strong> <strong>Market</strong>, By Value 2014-2018 211<br />
9.6.16 Australia <strong>Smartwatch</strong> <strong>Market</strong>, By Value 2019-2024 213<br />
14
Table of Content<br />
S.No Particulars Page No.<br />
9.6.17 Australia <strong>Smartwatch</strong> <strong>Market</strong>, By Product Type, By Value 2014-2024 214<br />
9.6.18 Australia <strong>Smartwatch</strong> <strong>Market</strong>, By Operating System, By Value 2014-2024 215<br />
9.6.19 Australia <strong>Smartwatch</strong> <strong>Market</strong>, By Distribution Channel, By Value 2014-2024 216<br />
9.6.20 Rest of Asia-Pacific <strong>Smartwatch</strong> <strong>Market</strong>, By Value 2014-2024 218<br />
9.6.21 Rest of Asia-Pacific <strong>Smartwatch</strong> <strong>Market</strong>, By Product Type, By Value 2014-2024 219<br />
9.6.22 Rest of Asia-Pacific <strong>Smartwatch</strong> <strong>Market</strong>, By Operating System, By Value 2014-2024 220<br />
9.6.23 Rest of Asia-Pacific <strong>Smartwatch</strong> <strong>Market</strong>, By Distribution Channel, By Value 2014-2024 221<br />
10. Rest of the World <strong>Smartwatch</strong> <strong>Market</strong> – An Analysis 222<br />
10.1 By Value (2014-2018) 223<br />
10.2 By Value (2019-2024) 225<br />
10.3 Rest of the World <strong>Smartwatch</strong> <strong>Market</strong>, By Product Type, By Value 2014-2024 228<br />
10.4 Rest of the World <strong>Smartwatch</strong> <strong>Market</strong>, By Operating System, By Value 2014-2024 230<br />
10.5 Rest of the World <strong>Smartwatch</strong> <strong>Market</strong>, By Distribution Channel, By Value 2014-2024 232<br />
11 Pricing Analysis 233<br />
12 <strong>Market</strong> Dynamics 236<br />
12.1 <strong>Market</strong> Drivers 237<br />
15
Table of Content<br />
S.No Particulars Page No.<br />
12.2 <strong>Market</strong> Restraints 242<br />
12.3 <strong>Market</strong> Trends 244<br />
13 Porter Five Analysis 249<br />
14 SWOT Analysis 251<br />
15 Company Profiling 253<br />
15.1 Apple 254<br />
15.2 Fitbit 257<br />
15.3 Garmin Ltd. 260<br />
15.4 Xiaomi Corporation 262<br />
15.5 Huawei Technologies Co. Ltd. 263<br />
15.6 Samsung 264<br />
15.7 Sony Corporation 265<br />
15.8 TomTom International 266<br />
15.9 Fossil Group 267<br />
16. About us 268<br />
16
List of Figures<br />
Figure No. Figure Title Page No.<br />
Figure 1: <strong>Global</strong> <strong>Smartwatch</strong> <strong>Market</strong> Size, By Value, 2014-2018 (USD Million) 42<br />
Figure 2: <strong>Global</strong> <strong>Smartwatch</strong> <strong>Market</strong> Size, By Volume, 2014-2018 (Million Units) 43<br />
Figure 3: <strong>Global</strong> Total Spending 2014-2019 (USD Billion) 45<br />
Figure 4: <strong>Global</strong> Internet User Distribution, By Regions 2018 (%) 45<br />
Figure 5: Number of Obese Population, By Countries (%) 45<br />
Figure 6: Degree of Urbanization, By Continent 2018 (%) 45<br />
Figure 7: Healthcare Expenditure (Share of GDP), By Selected Country, 2014-2017 (In %) 46<br />
Figure 8: <strong>Global</strong> Wearable devices <strong>Market</strong> size, 2015 – 2019 (USD Billion) 47<br />
Figure 9: <strong>Global</strong> Wearable devices <strong>Market</strong> Volume, 2015 – 2019 ( in Million ) 47<br />
Figure 10: <strong>Global</strong> Aged Population (Above 65), 2014-2018 (% of total) 48<br />
Figure 11: <strong>Global</strong> Aged Population(Above 65), By Country, 2017 (% of total) 48<br />
Figure 12: Percentage of Usage of each function of <strong>Smartwatch</strong> 49<br />
Figure 13: <strong>Global</strong> <strong>Smartwatch</strong> <strong>Market</strong> Size, By Value, 2019-2024 (USD Million) 50<br />
Figure 14: <strong>Global</strong> <strong>Smartwatch</strong> <strong>Market</strong> Size, By Volume, 2019-2024 (in Million Units) 51<br />
Figure 15: <strong>Global</strong> <strong>Smartwatch</strong> <strong>Market</strong> Size, By Product Type, 2018 (%) 53<br />
Figure 16: <strong>Global</strong> <strong>Smartwatch</strong> <strong>Market</strong> Size, By Product Type, 2024F(%) 53<br />
Figure 17: <strong>Global</strong> <strong>Smartwatch</strong> <strong>Market</strong> Size, By Value, By Extension 2014-2018 (USD Million) 54<br />
Figure 18: <strong>Global</strong> <strong>Smartwatch</strong> <strong>Market</strong> Size, By Value, Forecast, By Extension 2019E-2024F (USD Million) 55<br />
Figure 19: <strong>Global</strong> <strong>Smartwatch</strong> <strong>Market</strong> Size, By Value, By Standalone 2014-2018 (USD Million) 56<br />
Figure 20: <strong>Global</strong> <strong>Smartwatch</strong> <strong>Market</strong> Size, By Value, Forecast, By Standalone 2019E-2024F (USD Million) 57<br />
17
List of Figures<br />
Figure No. Figure Title Page No.<br />
Figure 21: <strong>Global</strong> <strong>Smartwatch</strong> <strong>Market</strong> Size, By Value, By Classic/Hybrid 2014-2018 (USD Million) 58<br />
Figure 22: <strong>Global</strong> <strong>Smartwatch</strong> <strong>Market</strong> Size, By Value, Forecast, By Classic/Hybrid 2019E-2024F (USD Million) 59<br />
Figure 23: <strong>Global</strong> <strong>Smartwatch</strong> <strong>Market</strong> Size, By Operating System, 2018 (%) 60<br />
Figure 24: <strong>Global</strong> <strong>Smartwatch</strong> <strong>Market</strong> Size, By Operating System, 2024F(%) 60<br />
Figure 25: <strong>Global</strong> <strong>Smartwatch</strong> <strong>Market</strong> Size, By Value, By WatchOS 2014-2024 (USD Million) 61<br />
Figure 26: <strong>Global</strong> <strong>Smartwatch</strong> <strong>Market</strong> Size, By Value, By WearOS 2014-2024 (USD Million) 62<br />
Figure 27: <strong>Global</strong> <strong>Smartwatch</strong> <strong>Market</strong> Size, By Value, By Tizen 2014-2024 (USD Million) 63<br />
Figure 28: <strong>Global</strong> <strong>Smartwatch</strong> <strong>Market</strong> Size, By Value, By Android 2014-2024 (USD Million) 64<br />
Figure 29: <strong>Global</strong> <strong>Smartwatch</strong> <strong>Market</strong> Size, By Value, By Others 2014-2024 (USD Million) 65<br />
Figure 30: <strong>Global</strong> <strong>Smartwatch</strong> <strong>Market</strong> Size, By Distribution Channel, 2018 (%) 66<br />
Figure 31: <strong>Global</strong> <strong>Smartwatch</strong> <strong>Market</strong> Size, By Distribution Channel, 2024F(%) 66<br />
Figure 32: <strong>Global</strong> <strong>Smartwatch</strong> <strong>Market</strong> Size, By Value, By Offline Channel 2014-2018 (USD Million) 67<br />
Figure 33: <strong>Global</strong> <strong>Smartwatch</strong> <strong>Market</strong> Size, By Value, Forecast, By Offline Channel 2019E-2024F (USD Million) 68<br />
Figure 34: <strong>Global</strong> <strong>Smartwatch</strong> <strong>Market</strong> Size, By Value, By Online Channel, 2014-2018 (USD Million) 69<br />
Figure 35: <strong>Global</strong> <strong>Smartwatch</strong> <strong>Market</strong> Size, By Value, Forecast, By Online Channel 2019E-2024F (USD Million) 70<br />
Figure 36: <strong>Global</strong> <strong>Market</strong> Share of leading <strong>Smartwatch</strong> Companies, 2017 (In %) 71<br />
Figure 37: <strong>Global</strong> smartwatch <strong>Market</strong>, Regional Share, 2018 (%) 74<br />
Figure 38: <strong>Global</strong> smartwatch <strong>Market</strong>, Regional Share, 2023F(%) 74<br />
Figure 39: North America <strong>Smartwatch</strong> <strong>Market</strong> Size, By Value, 2014-2018 (USD Million) 76<br />
Figure 40: North America High Net Worth Individual Population, 2014-2017 (in thousand) 77<br />
18
List of Figures<br />
Figure No. Figure Title Page No.<br />
Figure 41: North America High Net Worth Individual Population, By Countries 2014-2017 (in thousand) 77<br />
Figure 42: North America Urban Population, 2014-2019 (in Million) 78<br />
Figure 43: North America Internet User Penetration, 2014-2019 (%) 78<br />
Figure 44: Major Players in North America <strong>Smartwatch</strong> <strong>Market</strong> 79<br />
Figure 45: North America <strong>Smartwatch</strong> <strong>Market</strong> Size, By Value, 2019-2024 (USD Million) 80<br />
Figure 46: North America <strong>Smartwatch</strong> <strong>Market</strong> Size, By Product Type, 2018 (%) 82<br />
Figure 47: North America <strong>Smartwatch</strong> <strong>Market</strong> Size, By Product Type, 2024F(%) 82<br />
Figure 48: North America <strong>Smartwatch</strong> <strong>Market</strong> Size, By Value, By Extension, 2014-2018 (USD Million) 83<br />
Figure 49: North America <strong>Smartwatch</strong> <strong>Market</strong> Size, By Value, By Extension, 2019-2024 (USD Million) 83<br />
Figure 50: North America <strong>Smartwatch</strong> <strong>Market</strong> Size, By Value, By Standalone 2014-2018 (USD Million) 84<br />
Figure 51: North America <strong>Smartwatch</strong> <strong>Market</strong> Size, By Value, By Standalone 2019-2024 (USD Million) 84<br />
Figure 52: North America <strong>Smartwatch</strong> <strong>Market</strong> Size, By Value, By Classic/Hybrid 2014-2018 (USD Million) 85<br />
Figure 53: North America <strong>Smartwatch</strong> <strong>Market</strong> Size, By Value, By Classic/Hybrid 2019-2024 (USD Million) 85<br />
Figure 54: North America <strong>Smartwatch</strong> <strong>Market</strong> Size, By Operating System, 2018 (%) 86<br />
Figure 55: North America <strong>Smartwatch</strong> <strong>Market</strong> Size, By Operating System, 2024F(%) 86<br />
Figure 56: North America <strong>Smartwatch</strong> <strong>Market</strong> Size, By WatchOS 2014-2018 (USD Million) 87<br />
Figure 57: North America <strong>Smartwatch</strong> <strong>Market</strong> Size, By WatchOS 2019-2024 (USD Million) 87<br />
Figure 58: North America <strong>Smartwatch</strong> <strong>Market</strong> Size, By WearOS 2014-2018 (USD Million) 88<br />
Figure 59: North America <strong>Smartwatch</strong> <strong>Market</strong> Size, By WearOS 2019-2024 (USD Million) 88<br />
Figure 60: North America <strong>Smartwatch</strong> <strong>Market</strong> Size, By Value, By Tizen 2014-2018 (USD Million) 89<br />
19
List of Figures<br />
Figure No. Figure Title Page No.<br />
Figure 61: North America <strong>Smartwatch</strong> <strong>Market</strong> Size, By Value, By Tizen 2019-2024 (USD Million) 89<br />
Figure 62: North America <strong>Smartwatch</strong> <strong>Market</strong> Size, By Value, By Android 2014-2018 (USD Million) 90<br />
Figure 63: North America <strong>Smartwatch</strong> <strong>Market</strong> Size, By Value, By Android 2019-2024 (USD Million) 90<br />
Figure 64: North America <strong>Smartwatch</strong> <strong>Market</strong> Size, By Value, By Other Operating System 2014-2018 (USD Million) 91<br />
Figure 65: North America <strong>Smartwatch</strong> <strong>Market</strong> Size, By Value, By Other operating system 2019-2024 (USD Million) 91<br />
Figure 66: North America <strong>Smartwatch</strong> <strong>Market</strong> Size, By Distribution Channel, 2018(%) 92<br />
Figure 67: North America <strong>Smartwatch</strong> <strong>Market</strong> Size, By Distribution Channel, 2024F(%) 92<br />
Figure 68: North America <strong>Smartwatch</strong> <strong>Market</strong> , By Value, By Retail Channel 2014-2018 (USD Million) 93<br />
Figure 69: North America <strong>Smartwatch</strong> <strong>Market</strong> <strong>Market</strong>, By Value, By Retail Channel 2019-2024 (USD Million) 93<br />
Figure 70: North America <strong>Smartwatch</strong> <strong>Market</strong>, By Value, By Online Channel, 2019-2024 (USD Million) 94<br />
Figure 71: North America <strong>Smartwatch</strong> <strong>Market</strong>, By Value, By Online Channel 2019-2024 (USD Million) 94<br />
Figure 72: US <strong>Smartwatch</strong> <strong>Market</strong> Size, By Value, 2014-2018 (In USD Million) 96<br />
Figure 73: <strong>Smartwatch</strong> Use Preferences in US 97<br />
Figure 74: United States Wearables Users, 2015-2019 (In Million) 97<br />
Figure 75: Percentage of Internet Users in United States 2019 and 2022E (%) 97<br />
Figure 76: United States Watch Sales, By Type, 2014-2018 (%) 97<br />
Figure 77: US <strong>Smartwatch</strong> <strong>Market</strong> Size, By Value, 2019-2024 (In USD Million) 98<br />
Figure 78: US <strong>Smartwatch</strong> <strong>Market</strong>: By Product Type, By Value 2014-2024 (USD Million) 99<br />
Figure 79: US <strong>Smartwatch</strong> <strong>Market</strong>: By Operating System, By Value 2014–2024 (USD Million) 100<br />
Figure 80: US <strong>Smartwatch</strong> <strong>Market</strong>: By Distribution Channel, By Value 2014-2024 (USD Million) 101<br />
20
List of Figures<br />
Figure No. Figure Title Page No.<br />
Figure 81: Canada <strong>Smartwatch</strong> <strong>Market</strong> Size, By Value, 2014-2018 (In USD Million) 104<br />
Figure 82: Canada Average Expenditure Per Household 2014-2017 (USD Dollars) 105<br />
Figure 83: Percentage of Internet Users in Canada 2014-2017 (%) 105<br />
Figure 84: Overweight and Obese Population in Canada, 2015-2017 (% of total) 105<br />
Figure 85: Canada <strong>Smartwatch</strong> <strong>Market</strong> Size, By Value, 2019-2024 (In USD Million) 106<br />
Figure 86: Canada <strong>Smartwatch</strong> <strong>Market</strong>: By Product Type, By Value 2014-2024 (USD Million) 107<br />
Figure 87: Canada <strong>Smartwatch</strong> <strong>Market</strong>: By Operating System, By Value 2014–2024 (USD Million) 108<br />
Figure 88: Canada <strong>Smartwatch</strong> <strong>Market</strong>: By Distribution Channel, By Value 2014-2024 (USD Million) 109<br />
Figure 89: Europe <strong>Smartwatch</strong> <strong>Market</strong> Size, By Value, 2014-2018 (USD Million) 112<br />
Figure 90: Central and Eastern Europe Total Spending 2014-2019F (USD Billions) 113<br />
Figure 91: Western Europe Total Spending 2014-2019F (USD Billions) 113<br />
Figure 92: Europe High Net Worth Individual Population, By Countries 2014-2017 (in Thousand) 113<br />
Figure 93: North America Urban Population, 2014-2019 (in Million) 114<br />
Figure 94: Internet penetration in European Union, By Countries (%) 114<br />
Figure 95: Europe <strong>Smartwatch</strong> <strong>Market</strong> Size, By Value, 2019-2024 (USD Million) 115<br />
Figure 96: Europe <strong>Smartwatch</strong> <strong>Market</strong> Size, By Product Type, 2018 (%) 117<br />
Figure 97: Europe <strong>Smartwatch</strong> <strong>Market</strong> Size, By Product Type, 2024F(%) 117<br />
Figure 98: Europe <strong>Smartwatch</strong> <strong>Market</strong> Size, By Value, By Extension, 2014-2018 (USD Million) 118<br />
Figure 99: Europe <strong>Smartwatch</strong> <strong>Market</strong> Size, By Value, By Extension, 2019-2024 (USD Million) 118<br />
Figure 100: Europe <strong>Smartwatch</strong> <strong>Market</strong> Size, By Value, By Standalone 2014-2018 (USD Million) 119<br />
21
List of Figures<br />
Figure No. Figure Title Page No.<br />
Figure 101: Europe <strong>Smartwatch</strong> <strong>Market</strong> Size, By Value, By Standalone 2019-2024 (USD Million) 119<br />
Figure 102: Europe <strong>Smartwatch</strong> <strong>Market</strong> Size, By Value, By Classic/Hybrid 2014-2018 (USD Million) 120<br />
Figure 103: Europe <strong>Smartwatch</strong> <strong>Market</strong> Size, By Value, By Classic/Hybrid 2019-2024 (USD Million) 120<br />
Figure 104: Europe <strong>Smartwatch</strong> <strong>Market</strong> Size, By Operating System, 2018 (%) 121<br />
Figure 105: Europe <strong>Smartwatch</strong> <strong>Market</strong> Size, By Operating System, 2024F(%) 121<br />
Figure 106: Europe <strong>Smartwatch</strong> <strong>Market</strong> Size, By WatchOS 2014-2018 (USD Million) 122<br />
Figure 107: Europe <strong>Smartwatch</strong> <strong>Market</strong> Size, By WatchOS 2019-2024 (USD Million) 122<br />
Figure 108: Europe <strong>Smartwatch</strong> <strong>Market</strong> Size, By WearOS 2014-2018 (USD Million) 123<br />
Figure 109: Europe <strong>Smartwatch</strong> <strong>Market</strong> Size, By WearOS 2019-2024 (USD Million) 123<br />
Figure 110: Europe <strong>Smartwatch</strong> <strong>Market</strong> Size, By Value, By Tizen 2014-2018 (USD Million) 124<br />
Figure 111: Europe <strong>Smartwatch</strong> <strong>Market</strong> Size, By Value, By Tizen 2019-2024 (USD Million) 124<br />
Figure 112: Europe <strong>Smartwatch</strong> <strong>Market</strong> Size, By Value, By Android 2014-2018 (USD Million) 125<br />
Figure 113: Europe <strong>Smartwatch</strong> <strong>Market</strong> Size, By Value, By Android 2019-2024 (USD Million) 125<br />
Figure 114: Europe <strong>Smartwatch</strong> <strong>Market</strong> Size, By Value, By Other Operating System 2014-2018 (USD Million) 126<br />
Figure 115: Europe <strong>Smartwatch</strong> <strong>Market</strong> Size, By Value, By Other operating system 2019-2024 (USD Million) 126<br />
Figure 116: Europe <strong>Smartwatch</strong> <strong>Market</strong> Size, By Distribution Channel, 2018(%) 127<br />
Figure 117: Europe <strong>Smartwatch</strong> <strong>Market</strong> Size, By Distribution Channel, 2024F(%) 127<br />
Figure 118: Europe <strong>Smartwatch</strong> <strong>Market</strong> , By Value, By Retail Channel 2014-2018 (USD Million) 128<br />
Figure 119: Europe <strong>Smartwatch</strong> <strong>Market</strong> <strong>Market</strong>, By Value, By Retail Channel 2019-2024 (USD Million) 128<br />
Figure 120: Europe <strong>Smartwatch</strong> <strong>Market</strong>, By Value, By Online Channel, 2019-2024 (USD Million) 129<br />
22
List of Figures<br />
Figure No. Figure Title Page No.<br />
Figure 121: Europe <strong>Smartwatch</strong> <strong>Market</strong>, By Value, By Online Channel 2019-2024 (USD Million) 129<br />
Figure 122: UK <strong>Smartwatch</strong> <strong>Market</strong> Size, By Value, 2014-2018 (In USD Million) 132<br />
Figure 123: United Kingdom Population, By Gender 133<br />
Figure 124: Internet Users in UK, By Age Group 2017 (%) 133<br />
Figure 125: UK <strong>Smartwatch</strong> <strong>Market</strong> Size, By Value, 2019-2024 (In USD Million) 134<br />
Figure 126: UK <strong>Smartwatch</strong> <strong>Market</strong>: By Product Type, By Value 2014-2024 (USD Million) 135<br />
Figure 127: UK <strong>Smartwatch</strong> <strong>Market</strong>: By Operating System, By Value 2014–2024 (USD Million) 136<br />
Figure 128: UK <strong>Smartwatch</strong> <strong>Market</strong>: By Operating System, By Value 2014–2024 (USD Million) 137<br />
Figure 129: Germany <strong>Smartwatch</strong> <strong>Market</strong> Size, By Value, 2014-2018 (In USD Million) 140<br />
Figure 130: Number of Internet Users in Germany, 2014-2018 (in millions) 141<br />
Figure 131: High Net Worth Population in Germany, 2014-2018 ( in Million) 141<br />
Figure 132: Urbanisation in Germany, 2014-2018 ( in Million) 141<br />
Figure 133: Germany <strong>Smartwatch</strong> <strong>Market</strong> Size, By Value, 2019-2024 (In USD Million) 142<br />
Figure 134: Germany <strong>Smartwatch</strong> <strong>Market</strong>: By Product Type, By Value 2014-2024 (USD Million) 143<br />
Figure 135: Germany <strong>Smartwatch</strong> <strong>Market</strong>: By Operating System, By Value 2014–2024 (USD Million) 144<br />
Figure 136: Germany <strong>Smartwatch</strong> <strong>Market</strong>: By Distribution Channel, By Value 2014-2024 (USD Million) 145<br />
Figure 137: France <strong>Smartwatch</strong> <strong>Market</strong> Size, By Value, 2014-2018 (In USD Million) 148<br />
Figure 138: Internet Penetration in France, 2014-2018 (%) 149<br />
Figure 139: France Urban population, 2013-2017 (% of total population) 149<br />
Figure 140: Number of mobile phone users in France, 2015 to 2019 (in millions) 149<br />
23
List of Figures<br />
Figure No. Figure Title Page No.<br />
Figure 141: France <strong>Smartwatch</strong> <strong>Market</strong> Size, By Value, 2019-2024 (In USD Million) 150<br />
Figure 142: France <strong>Smartwatch</strong> <strong>Market</strong>: By Product Type, By Value 2014-2024 (USD Million) 151<br />
Figure 143: France <strong>Smartwatch</strong> <strong>Market</strong>: By Operating System, By Value 2014–2024 (USD Million) 152<br />
Figure 144: France <strong>Smartwatch</strong> <strong>Market</strong>: By Distribution Channel, By Value 2014-2024 (USD Million) 153<br />
Figure 145: Italy <strong>Smartwatch</strong> <strong>Market</strong> Size, By Value, 2014-2018 (In USD Million) 156<br />
Figure 146: Degree of Urbanization in Italy, 2014-2017 (%) 157<br />
Figure 147: Number of Internet Users in Italy, 2014-2018 (in million) 157<br />
Figure 148: Total Population of Italy, 2014-2017 (in million) 157<br />
Figure 149: Italy <strong>Smartwatch</strong> <strong>Market</strong> Size, By Value, 2019-2024 (In USD Million) 158<br />
Figure 150: Italy <strong>Smartwatch</strong> <strong>Market</strong>: By Product Type, By Value 2014-2024 (USD Million) 159<br />
Figure 151: Italy <strong>Smartwatch</strong> <strong>Market</strong>: By Operating System, By Value 2014–2024 (USD Million) 160<br />
Figure 152: Italy <strong>Smartwatch</strong> <strong>Market</strong>: By Distribution Channel, By Value 2014-2024 (USD Million) 161<br />
Figure 153: Rest of Europe <strong>Smartwatch</strong> <strong>Market</strong> Size, By Value, 2014-2018 (USD Million) 163<br />
Figure 154: Rest of Europe <strong>Smartwatch</strong> <strong>Market</strong> Size, By Value, 2019-2024 (USD Million) 163<br />
Figure 155: Rest of Europe <strong>Smartwatch</strong> <strong>Market</strong>: By Product Type, By Value 2014-2024 (USD Million) 164<br />
Figure 156: Rest of Europe <strong>Smartwatch</strong> <strong>Market</strong>: By Operating System, By Value 2014–2024 (USD Million) 165<br />
Figure 157: Rest of Europe <strong>Smartwatch</strong> <strong>Market</strong>: By Distribution Channel, By Value 2014-2024 (USD Million) 166<br />
Figure 158: Asia Pacific <strong>Smartwatch</strong> <strong>Market</strong> Size, By Value, 2014-2018 (USD Million) 168<br />
Figure 159: Asia-Pacific total Spending 2013-2019F (USD Billion) 169<br />
Figure 160: Asia Pacific <strong>Smartwatch</strong> <strong>Market</strong> Size, By Value, 2019-2024 (USD Million) 170<br />
24
List of Figures<br />
Figure No. Figure Title Page No.<br />
Figure 161: Asia-Pacific <strong>Smartwatch</strong> <strong>Market</strong> Size, By Product Type, 2018 (%) 172<br />
Figure 162: Asia-Pacific <strong>Smartwatch</strong> <strong>Market</strong> Size, By Product Type, 2024F(%) 172<br />
Figure 163: Asia-Pacific <strong>Smartwatch</strong> <strong>Market</strong> Size, By Value, By Extension, 2014-2018 (USD Million) 173<br />
Figure 164: Asia-Pacific <strong>Smartwatch</strong> <strong>Market</strong> Size, By Value, By Extension, 2019-2024 (USD Million) 173<br />
Figure 165: Asia-Pacific <strong>Smartwatch</strong> <strong>Market</strong> Size, By Value, By Standalone 2014-2018 (USD Million) 174<br />
Figure 166: Asia-Pacific <strong>Smartwatch</strong> <strong>Market</strong> Size, By Value, By Standalone 2019-2024 (USD Million) 174<br />
Figure 167: Asia-Pacific <strong>Smartwatch</strong> <strong>Market</strong> Size, By Value, By Classic/Hybrid 2014-2018 (USD Million) 175<br />
Figure 168: Asia-Pacific <strong>Smartwatch</strong> <strong>Market</strong> Size, By Value, By Classic/Hybrid 2019-2024 (USD Million) 175<br />
Figure 169: Asia-Pacific <strong>Smartwatch</strong> <strong>Market</strong> Size, By Operating System, 2018 (%) 176<br />
Figure 170: Asia-Pacific <strong>Smartwatch</strong> <strong>Market</strong> Size, By Operating System, 2024F(%) 176<br />
Figure 171: Asia-Pacific <strong>Smartwatch</strong> <strong>Market</strong> Size, By WatchOS 2014-2018 (USD Million) 177<br />
Figure 172: Asia-Pacific <strong>Smartwatch</strong> <strong>Market</strong> Size, By WatchOS 2019-2024 (USD Million) 177<br />
Figure 173: Asia-Pacific <strong>Smartwatch</strong> <strong>Market</strong> Size, By WearOS 2014-2018 (USD Million) 178<br />
Figure 174: Asia-Pacific <strong>Smartwatch</strong> <strong>Market</strong> Size, By WearOS 2019-2024 (USD Million) 178<br />
Figure 175: Asia-Pacific <strong>Smartwatch</strong> <strong>Market</strong> Size, By Value, By Tizen 2014-2018 (USD Million) 179<br />
Figure 176: Asia-Pacific <strong>Smartwatch</strong> <strong>Market</strong> Size, By Value, By Tizen 2019-2024 (USD Million) 179<br />
Figure 177: Asia-Pacific <strong>Smartwatch</strong> <strong>Market</strong> Size, By Value, By Android 2014-2018 (USD Million) 180<br />
Figure 178: Asia-Pacific <strong>Smartwatch</strong> <strong>Market</strong> Size, By Value, By Android 2019-2024 (USD Million) 180<br />
Figure 179: Asia-Pacific <strong>Smartwatch</strong> <strong>Market</strong> Size, By Value, By Other Operating System 2014-2018 (USD Million) 181<br />
Figure 180: Asia-Pacific <strong>Smartwatch</strong> <strong>Market</strong> Size, By Value, By Other operating system 2019-2024 (USD Million) 181<br />
25
List of Figures<br />
Figure No. Figure Title Page No.<br />
Figure 181: Asia-Pacific <strong>Smartwatch</strong> <strong>Market</strong> Size, By Distribution Channel, 2018(%) 182<br />
Figure 182: Asia-Pacific <strong>Smartwatch</strong> <strong>Market</strong> Size, By Distribution Channel, 2024F(%) 182<br />
Figure 183: Asia-Pacific <strong>Smartwatch</strong> <strong>Market</strong> , By Value, By Retail Channel 2014-2018 (USD Million) 183<br />
Figure 184: Asia-Pacific <strong>Smartwatch</strong> <strong>Market</strong> <strong>Market</strong>, By Value, By Retail Channel 2019-2024 (USD Million) 183<br />
Figure 185: Asia-Pacific <strong>Smartwatch</strong> <strong>Market</strong>, By Value, By Online Channel, 2019-2024 (USD Million) 184<br />
Figure 186: Asia-Pacific <strong>Smartwatch</strong> <strong>Market</strong>, By Value, By Online Channel 2019-2024 (USD Million) 184<br />
Figure 187: China <strong>Smartwatch</strong> <strong>Market</strong> Size, By Value, 2014-2018 (In USD Million) 187<br />
Figure 188: Number of Internet Users in China, 2014-2017 (in Million) 188<br />
Figure 189: China Urban Population, 2014-2017 (% of total) 188<br />
Figure 190: China <strong>Smartwatch</strong> <strong>Market</strong> Size, By Value, 2018-2023 (In USD Million) 189<br />
Figure 191: China <strong>Smartwatch</strong> <strong>Market</strong>: By Product Type, By Value 2014-2024 (USD Million) 190<br />
Figure 192: China <strong>Smartwatch</strong> <strong>Market</strong>: By Operating System, By Value 2014–2024 (USD Million) 191<br />
Figure 193: China <strong>Smartwatch</strong> <strong>Market</strong>: By Distribution Channel, By Value 2014-2024 (USD Million) 192<br />
Figure 194: Japan <strong>Smartwatch</strong> <strong>Market</strong> Size, By Value, 2014-2018 (In USD Million) 195<br />
Figure 195: Internet Penetration in Japan, 2014-2018 (%) 196<br />
Figure 196: Japan Urban population, 2013-2017 (In Million) 196<br />
Figure 197: Japan <strong>Smartwatch</strong> <strong>Market</strong> Size, By Value, 2018-2023 (In USD Million) 197<br />
Figure 198: Japan <strong>Smartwatch</strong> <strong>Market</strong>: By Product Type, By Value 2014-2024 (USD Million) 198<br />
Figure 199: Japan <strong>Smartwatch</strong> <strong>Market</strong>: By Operating System, By Value 2014–2024 (USD Million) 199<br />
Figure 200: Japan <strong>Smartwatch</strong> <strong>Market</strong>: By Distribution Channel, By Value 2014-2024 (USD Million) 200<br />
26
List of Figures<br />
Figure No. Figure Title Page No.<br />
Figure 201: India <strong>Smartwatch</strong> <strong>Market</strong> Size, By Value, 2014-2018 (In USD Million) 203<br />
Figure 202: Number of Internet Users in India, 2014-2017 (in millions) 204<br />
Figure 203: Number of Urban Population in India, 2014-2017 (in millions) 204<br />
Figure 204: India <strong>Smartwatch</strong> <strong>Market</strong> Size, By Value, 2018-2023 (In USD Million) 205<br />
Figure 205: India <strong>Smartwatch</strong> <strong>Market</strong>: By Product Type, By Value 2014-2024 (USD Million) 206<br />
Figure 206: India <strong>Smartwatch</strong> <strong>Market</strong>: By Operating System, By Value 2014–2024 (USD Million) 207<br />
Figure 207: Italy <strong>Smartwatch</strong> <strong>Market</strong>: By Distribution Channel, By Value 2014-2024 (USD Million) 208<br />
Figure 208: Australia <strong>Smartwatch</strong> <strong>Market</strong> Size, By Value, 2014-2018 (In USD Million) 211<br />
Figure 209: Distribution of internet users in Australia, By Age Group 2016 212<br />
Figure 210: Degree of urbanization in Australia, 2014-2017 (%) 212<br />
Figure 211: Australia <strong>Smartwatch</strong> <strong>Market</strong> Size, By Value, 2018-2023 (In USD Million) 213<br />
Figure 212: Australia <strong>Smartwatch</strong> <strong>Market</strong>: By Product Type, By Value 2014-2024 (USD Million) 214<br />
Figure 213: Australia <strong>Smartwatch</strong> <strong>Market</strong>: By Operating System, By Value 2014–2024 (USD Million) 215<br />
Figure 214: Australia <strong>Smartwatch</strong> <strong>Market</strong>: By Distribution Channel, By Value 2014-2024 (USD Million) 216<br />
Figure 215: Rest of APAC <strong>Smartwatch</strong> <strong>Market</strong> Size, By Value, 2014-2018 (USD Million) 218<br />
Figure 216: Rest of APAC <strong>Smartwatch</strong> <strong>Market</strong> Size, By Value, 2018-2023 (USD Million) 218<br />
Figure 217: Rest of Asia-Pacific <strong>Smartwatch</strong> <strong>Market</strong>: By Product Type, By Value 2014-2024 (USD Million) 219<br />
Figure 218: Rest of Asia-Pacific <strong>Smartwatch</strong> <strong>Market</strong>: By Operating System, By Value 2014–2024 (USD Million) 220<br />
Figure 219: Rest of APAC <strong>Smartwatch</strong> <strong>Market</strong>: By Distribution Channel, By Value 2014-2024 (USD Million) 221<br />
Figure 220: Rest of the World <strong>Smartwatch</strong> <strong>Market</strong> Size, By Value, 2013-2017 (USD Million) 223<br />
27
List of Figures<br />
Figure No. Figure Title Page No.<br />
Figure 221: Latin America Total Spending 2014-2019F (USD Billions) 224<br />
Figure 222: Middle East/ Africa Total Spending 2013-2019F (USD Billions) 224<br />
Figure 223: Rest of the World <strong>Smartwatch</strong> <strong>Market</strong> Size, By Value, 2018-2023 (USD Million) 225<br />
Figure 224: Rest of the World <strong>Smartwatch</strong> <strong>Market</strong> Size, By Product Type, 2018 (%) 227<br />
Figure 225: Rest of the World <strong>Smartwatch</strong> <strong>Market</strong> Size, By Product Type, 2024F(%) 227<br />
Figure 226: Rest of the World <strong>Smartwatch</strong> <strong>Market</strong>: By Product Type, By Value 2014-2024 (USD Million) 228<br />
Figure 227: Rest of the World <strong>Smartwatch</strong> <strong>Market</strong> Size, By Operating System, 2018 (%) 229<br />
Figure 228: Rest of the World <strong>Smartwatch</strong> <strong>Market</strong> Size, By Operating System, 2024F(%) 229<br />
Figure 229: Rest of the World <strong>Smartwatch</strong> <strong>Market</strong>: By Operating System, By Value 2014–2024 (USD Million) 230<br />
Figure 230: Rest of the World <strong>Smartwatch</strong> <strong>Market</strong> Size, By Distribution Channel, 2018(%) 231<br />
Figure 231: Rest of the World <strong>Smartwatch</strong> <strong>Market</strong> Size, By Distribution Channel, 2024F(%) 231<br />
Figure 232: Rest of the World <strong>Smartwatch</strong> <strong>Market</strong>: By Distribution Channel, By Value 2014-2024 (USD Million) 232<br />
Figure 233: Apple Unit sales of <strong>Smartwatch</strong>, 2015-2018 ( in Million Units) 255<br />
Figure 234: Apple Product Revenue, By Segment 2017 255<br />
Figure 235: Fitbit <strong>Smartwatch</strong> Revenue 2014-2018 (USD Millions) 258<br />
Figure 236: Average Selling Price of Fitbit watch 2014-2017 (USD) 258<br />
Figure 237: Fitbit Unit Sales of <strong>Smartwatch</strong>, 2014-2018 ( in Million) 259<br />
Figure 238: Fitbit Devices Revenue, By Geographical Region, 2016 & 2017 259<br />
Figure 239: Garmin Ltd. Outdoor Segment <strong>Market</strong> Revenue, 2014-2018 (USD Millions) 261<br />
Figure 240: Garmin Ltd. Revenue, By Geographical Region, 2017 (%) 261<br />
28
List of Figures<br />
Figure No. Figure Title Page No.<br />
Table A: Types of <strong>Smartwatch</strong> 38<br />
Table B: Comparison of Leading Smart Watches 234<br />
Table C: Apple <strong>Smartwatch</strong> Models 256<br />
29
Research Methodology<br />
For our study on <strong>Global</strong> <strong>Smartwatch</strong> <strong>Market</strong>, we have conducted comprehensive secondary research<br />
followed by an extensive primary research. In the process of secondary research, we have scrutinized<br />
industry documents, accessed from open sources, premium paid databases and our internal knowledge<br />
base. In the process of primary research, we have interviewed various industry experts across the<br />
structure of the <strong>Smartwatch</strong> industry.<br />
<strong>Market</strong> size of the actual period (2014-2018) has been evaluated on the basis of growth trends of the<br />
industry in the last five years, and confirming the findings through primary research. Annual reports of<br />
the companies are scanned to further validate the market value which involves the revenues earned by<br />
the <strong>Smartwatch</strong> companies. <strong>Market</strong> sizing and growth in the forecast period (2019-2024) is estimated<br />
through revenue mapping, growth of the economies, growth across various industry sectors and<br />
historical growth pattern of the industry. All the relevant data points/ statistics in the forecast period are<br />
validated through relevant and reliable primary sources.<br />
Report Focus: <strong>Global</strong> <strong>Smartwatch</strong> <strong>Market</strong>.<br />
- By Product Type (Extension, Standalone and Classic)<br />
- By Operating System (WatchOS, WearOS, Tizen, RTOS, and Others<br />
- By Distributional Channel (Offline and Online)<br />
- By Region ( North America, Europe, Asia Pacific, ROW),<br />
- By Country ( U.S., Canada, Mexico, UK, Germany, Spain, China, Japan, South Korea)<br />
- Company Coverage (Apple, Sony Corporation, Fossil Group, Xiaomi Corporation, TomTom International,<br />
Samsung, Garmin Ltd, Fitbit and Huawei Technologies Co. Ltd.)<br />
Companies Contacted:<br />
30
<strong>Global</strong> <strong>Smartwatch</strong> <strong>Market</strong>, By Value<br />
Increasing popularization of smart wearable devices coupled with growing awareness about personal<br />
health and fitness is injecting growth in the smartwatch market.<br />
Figure 1: <strong>Global</strong> <strong>Smartwatch</strong> <strong>Market</strong> Size, By Value, 2014-2018 (USD Million)<br />
CAGR 2014-2018<br />
xx%<br />
2014 2015 2016 2017 2018<br />
Source: Azoth Analytics Estimates<br />
Xx<br />
Xx<br />
Xx<br />
Xx<br />
Xx<br />
Xx<br />
xx<br />
31
<strong>Global</strong> <strong>Smartwatch</strong> <strong>Market</strong>, By Volume<br />
Diminishing average selling price of smart wearables devices coupled with emergence of contactless<br />
payment technology is bolstering the market growth.<br />
Figure 2: <strong>Global</strong> <strong>Smartwatch</strong> <strong>Market</strong> Size, By Volume, 2014-2018 (Million Units)<br />
CAGR 2014-2018<br />
xx%<br />
2014 2015 2016 2017 2018<br />
Source: Azoth Analytics Estimates<br />
Xx<br />
Xx<br />
Xx<br />
Xx<br />
Xx<br />
Xx<br />
32
<strong>Global</strong> <strong>Smartwatch</strong> <strong>Market</strong> : By WatchOS<br />
Increasing spending on premium health oriented technology products coupled with stable<br />
average selling price is stimulating demand in the market.<br />
Figure 25: <strong>Global</strong> <strong>Smartwatch</strong> <strong>Market</strong> Size, By Value, By WatchOS 2014-2024 (USD Million)<br />
CAGR 2014-2018<br />
xx%<br />
CAGR 2019-2024<br />
xx%<br />
2014 2015 2016 2017 2018 2019 2020 2021 2022 2023 2024<br />
Xx<br />
Source: Azoth Analytics Estimates<br />
Xx<br />
Xx<br />
Xx<br />
Xx<br />
Xx<br />
33
<strong>Global</strong> <strong>Smartwatch</strong> <strong>Market</strong> : By Android/WearOS<br />
Amplifying development of various innovative features coupled with rising consumer demand<br />
of high quality smartwatch processors is expected to propel the market growth globally<br />
Figure 26: <strong>Global</strong> <strong>Smartwatch</strong> <strong>Market</strong> Size, By Value, By WearOS 2014-2024 (USD Million)<br />
CAGR 2014-2018<br />
xx%<br />
CAGR 2019-2024<br />
xx%<br />
2014 2015 2016 2017 2018 2019 2020 2021 2022 2023 2024<br />
Source: Azoth Analytics Estimates<br />
Xx<br />
Xx<br />
Xx<br />
Xx<br />
Xx<br />
Xx<br />
34
<strong>Global</strong> <strong>Smartwatch</strong> <strong>Market</strong> : By Offline Channel<br />
High degree of trust on retail outlets coupled with growing penetration of hypermarkets and<br />
supermarkets stores across the globe is driving the market of smartwatch in the recent years.<br />
Figure 32: <strong>Global</strong> <strong>Smartwatch</strong> <strong>Market</strong> Size, By Value, By Offline Channel 2014-2018 (USD Million)<br />
CAGR 2014-2018<br />
xx%<br />
2014 2015 2016 2017 2018<br />
Xx<br />
Source: Azoth Analytics Estimates<br />
Xx<br />
Xx<br />
Xx<br />
Xx<br />
Xx<br />
xx<br />
35
<strong>Global</strong> <strong>Smartwatch</strong> <strong>Market</strong> : By Offline Channel<br />
Introduction of market specific products coupled with rising sedentary lifestyle of consumers,<br />
is anticipated to elevate the demand in the future.<br />
Figure 33: <strong>Global</strong> <strong>Smartwatch</strong> <strong>Market</strong> Size, By Value, Forecast, By Offline Channel 2019E-2024F (USD Million)<br />
CAGR 2018-2024<br />
xx%<br />
2014 2015 2016 2017 2018<br />
Xx<br />
Source: Azoth Analytics Estimates<br />
Xx<br />
Xx<br />
Xx<br />
Xx<br />
Xx<br />
36
North America <strong>Smartwatch</strong> <strong>Market</strong> Overview – By Extension<br />
Increasing investment on building connected ecosystem coupled with escalating growth in demand of<br />
wireless fitness and sports devices, is fuelling the market growth in the region<br />
Figure 48: North America <strong>Smartwatch</strong> <strong>Market</strong> Size, By<br />
Value, By Extension, 2014-2018 (USD Million)<br />
CAGR 2014-2018<br />
xx%<br />
Figure 49: North America <strong>Smartwatch</strong> <strong>Market</strong> Size, By<br />
Value, By Extension, 2019-2024 (USD Million)<br />
CAGR 2019-2024<br />
xx%<br />
2014 2015 2016 2017 2018 2019 2020 2021 2022 2023 2024<br />
Xx<br />
Source: Azoth Analytics Estimates<br />
Xx<br />
Xx<br />
Xx<br />
Xx<br />
Xx<br />
37
North America <strong>Smartwatch</strong> <strong>Market</strong> Overview – By WatchOS<br />
Stable average selling price of Apple’s smartwatch and emerging demand of luxury watch brands<br />
among the young consumers is supplementing market growth in North America<br />
Figure 56: North America <strong>Smartwatch</strong> <strong>Market</strong> Size, By<br />
WatchOS 2014-2018 (USD Million)<br />
CAGR 2014-2018<br />
xx%<br />
Figure 57: North America <strong>Smartwatch</strong> <strong>Market</strong> Size, By<br />
WatchOS 2019-2024 (USD Million)<br />
CAGR 2019-2024<br />
xx%<br />
2014 2015 2016 2017 2018 2019 2020 2021 2022 2023 2024<br />
Source: Azoth Analytics Estimates<br />
Xx<br />
Xx<br />
Xx<br />
Xx<br />
Xx<br />
Xx<br />
38
North America <strong>Smartwatch</strong> <strong>Market</strong> – By Online Channel<br />
Emergence of various private label brands over the e-commerce website will boost the market in future<br />
Figure 70: North America <strong>Smartwatch</strong> <strong>Market</strong>, By Value, By<br />
Online Channel, 2019-2024 (USD Million)<br />
Figure 71: North America <strong>Smartwatch</strong> <strong>Market</strong>, By Value, By<br />
Online Channel 2019-2024 (USD Million)<br />
CAGR 2014-2018<br />
xx%<br />
CAGR 2019-2024<br />
xx%<br />
2014 2015 2016 2017 2018 2019 2020 2021 2022 2023 2024<br />
Source: Azoth Analytics Estimates<br />
Xx<br />
Xx<br />
Xx<br />
Xx<br />
Xx<br />
Xx<br />
39
US <strong>Smartwatch</strong> <strong>Market</strong>, By Value<br />
Presence of highly diversified and technologically advanced companies and entrance of new players<br />
with growing focus on fitness applications is supporting the demand for smartwatch in the US market<br />
Figure 72: US <strong>Smartwatch</strong> <strong>Market</strong> Size, By Value, 2014-2018 (In USD Million)<br />
CAGR 2014-2018<br />
xx%<br />
2014 2015 2016 2017 2018<br />
Source: Azoth Analytics Estimates<br />
Xx<br />
Xx<br />
Xx<br />
Xx<br />
Xx<br />
Xx<br />
xx<br />
40
US <strong>Smartwatch</strong> <strong>Market</strong>, By Value<br />
Increasing purchase of smartwatches by millennial population in the country coupled with up surge in<br />
the adoption among employers in servicing industry, is expected to pull the smartwatch market growth.<br />
Figure 77: US <strong>Smartwatch</strong> <strong>Market</strong> Size, By Value, 2019-2024 (In USD Million)<br />
CAGR 2018-2024<br />
xx%<br />
2014 2015 2016 2017 2018<br />
Source: Azoth Analytics Estimates<br />
Xx<br />
Xx<br />
Xx<br />
Xx<br />
Xx<br />
Xx<br />
41
US <strong>Smartwatch</strong> <strong>Market</strong>, By Product Type<br />
Figure 78: US <strong>Smartwatch</strong> <strong>Market</strong>: By Product Type, By Value 2014-2024 (USD Million)<br />
CAGR 2014-2018<br />
Extension : xx%<br />
Standalone : xx%<br />
Classic/Hybrid : xx%<br />
CAGR 2019-2024<br />
Extension : xx%<br />
Standalone : xx%<br />
Classic/Hybrid : xx%<br />
2014 2015 2016 2017 2018 2019 2020 2021 2022 2023 2024<br />
Extension Standalone Classic/Hybrid<br />
2014 2015 2016 2017 2018 2019 2020 2021 2022 2023 2024<br />
Extension xx xx xx xx xx xx xx xx xx xx xx<br />
Standalone xx xx xx xx xx xx xx xx xx xx xx<br />
Classic/Hybrid xx xx xx xx xx xx xx xx xx xx xx<br />
Source: Azoth Analytics Estimates<br />
42
US <strong>Smartwatch</strong> <strong>Market</strong>, By Operating System<br />
Figure 79: US <strong>Smartwatch</strong> <strong>Market</strong>: By Operating System, By Value 2014–2024 (USD Million)<br />
CAGR 2014-2018<br />
WatchOS : xx%<br />
WearOS: xx%<br />
Tizen: xx%<br />
RTOS: xx%<br />
Others : xx%<br />
CAGR 2019-2024<br />
WatchOS : xx%<br />
WearOS: xx%<br />
Tizen: xx%<br />
RTOS: xx%<br />
Others : xx%<br />
2014 2015 2016 2017 2018 2019 2020 2021 2022 2023 2024<br />
WatchOS WearOS Tien RTOS Others<br />
2014 2015 2016 2017 2018 2019 2020 2021 2022 2023 2024<br />
WatchOS xx xx xx xx xx xx xx xx xx xx xx<br />
WearOS xx xx xx xx xx xx xx xx xx xx xx<br />
Tizen xx xx xx xx xx xx xx xx xx xx xx<br />
RTOS xx xx xx xx xx xx xx xx xx xx xx<br />
Others xx xx xx xx xx xx xx xx xx xx xx<br />
Source: Azoth Analytics Estimates<br />
43
US <strong>Smartwatch</strong> <strong>Market</strong>, By Distribution Channel<br />
Figure 80: US <strong>Smartwatch</strong> <strong>Market</strong>: By Distribution Channel, By Value 2014-2024 (USD Million)<br />
CAGR 2014-2018<br />
Online : xx%<br />
Offline : xx%<br />
CAGR 2019-2024<br />
Online : xx%<br />
Offline : xx%<br />
2014 2015 2016 2017 2018 2019 2020 2021 2022 2023 2024<br />
Online<br />
Offline<br />
2014 2015 2016 2017 2018 2019 2020 2021 2022 2023 2024<br />
Online xx xx xx xx xx xx xx xx xx xx xx<br />
Offline xx xx xx xx xx xx xx xx xx xx xx<br />
Source: Azoth Analytics Estimates<br />
44
About Azoth Analytics Pvt Ltd.<br />
Azoth Analytics (ISO 9001:2015) is a business research and analytics company that creates in-depth research reports and provides customized research<br />
solutions and consulting services. An ISO 9001:2015 certified company, Azoth Analytics adheres to international quality management standard and has strong<br />
commitment to a culture of continuous improvement. The business research and market analysis of Azoth Analytics helps organizations across different<br />
industry verticals solve their business problems. Strategic market sizing and data dredging techniques include secondary research, and primary research<br />
(interviews with management personnel and industry experts). Azoth Analytics provide syndicated and customized market research reports on different<br />
verticals including pharmaceutical and healthcare, oil and gas and power, chemicals, automotive, technology, FMCG, food & beverages and media sectors.<br />
(c) AZOTH Analytics<br />
45


