

Global Soda Ash Market (Volume, Value)
The Global Soda Ash Market has been analyzed By Product Type (Light, Dense), By Process Type (Natural, Synthetic) and By Application (Glass and Ceramics, Soaps and Detergents, Chemical, Metallurgy, Others). Visit us: http://azothanalytics.com/report/chemicals/global-soda-ash-market-volume-value-analysis-by-product-type-light-dense-process-type-natural-synthetic-by-application-glass-and-ceramics-soaps-and-detergents-chemical-metallurgical-by-region-by-country-2019-edition-opportunities-and-forecast-2014-2024-r33212 Visit us: http://azothanalytics.com/research/chemicals-c6
The Global Soda Ash Market has been analyzed By Product Type (Light, Dense), By Process Type (Natural, Synthetic) and By Application (Glass and Ceramics, Soaps and Detergents, Chemical, Metallurgy, Others).
Visit us: http://azothanalytics.com/report/chemicals/global-soda-ash-market-volume-value-analysis-by-product-type-light-dense-process-type-natural-synthetic-by-application-glass-and-ceramics-soaps-and-detergents-chemical-metallurgical-by-region-by-country-2019-edition-opportunities-and-forecast-2014-2024-r33212
Visit us: http://azothanalytics.com/research/chemicals-c6
- No tags were found...

You also want an ePaper? Increase the reach of your titles
YUMPU automatically turns print PDFs into web optimized ePapers that Google loves.
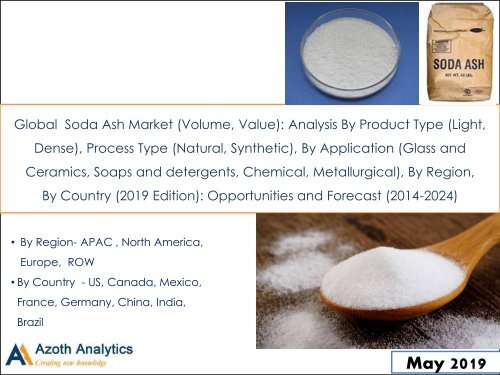
<strong>Global</strong> <strong>Soda</strong> <strong>Ash</strong> <strong>Market</strong> (<strong>Volume</strong>, <strong>Value</strong>): Analysis By Product Type (Light,<br />
Dense), Process Type (Natural, Synthetic), By Application (Glass and<br />
Ceramics, Soaps and detergents, Chemical, Metallurgical), By Region,<br />
By Country (2019 Edition): Opportunities and Forecast (2014-2024)<br />
• By Region- APAC , North America,<br />
Europe, ROW<br />
• By Country - US, Canada, Mexico,<br />
France, Germany, China, India,<br />
Brazil<br />
May 2019 1
<strong>Global</strong><br />
Regional<br />
Scope of the Report –<strong>Soda</strong> <strong>Ash</strong> <strong>Market</strong><br />
Historical<br />
Forecast<br />
2014 2015 2016 2017 2018 2019 2020 2021 2022 2023 2024<br />
<strong>Market</strong> (By <strong>Value</strong><br />
& <strong>Volume</strong> ) <br />
By Process,<br />
By <strong>Value</strong> &<br />
Natural <br />
Synthetic <br />
By Type, By <strong>Value</strong> Light <br />
Dense <br />
Glass <br />
Chemical <br />
By Application,<br />
By <strong>Value</strong> Soaps and Detergents <br />
Metallurgy <br />
Others <br />
<strong>Market</strong> (By <strong>Value</strong><br />
& <strong>Volume</strong> ) <br />
By Process,<br />
By <strong>Value</strong><br />
Natural <br />
Synthetic <br />
By Type, By <strong>Value</strong> Light <br />
Dense <br />
By Application,<br />
By <strong>Value</strong><br />
Glass <br />
Chemical <br />
Soaps and Detergents <br />
Metallurgy <br />
Others <br />
2
Country<br />
Scope of the Report – <strong>Soda</strong> <strong>Ash</strong> <strong>Market</strong><br />
2014 2015 2016 2017 2018 2019 2020 2021 2022 2023 2024<br />
<strong>Market</strong> (By <strong>Value</strong> ) <br />
By Application, By<br />
<strong>Volume</strong><br />
Company Analysis<br />
Regional Analysis<br />
Country Analysis<br />
Glass <br />
Chemical <br />
Soaps and<br />
Detergents <br />
Metallurgy <br />
Others <br />
Tata Chemicals, Solvay, Ciner, Genesis Alkali, NIRMA Limited, Shandong Haihua, Ciech SA, Tangshan Sanyou Chaemicals,<br />
Solvay<br />
North America, Europe, APAC and ROW<br />
U.S, Canada, Germany, U.K, France, China, India, Japan and Brazil<br />
3
Table of Content<br />
S.No Particulars Page<br />
No.<br />
1. Research Methodology 23<br />
2. Executive Summary 24<br />
3. Strategic Recommendation 25<br />
3.1 Focus on Different Application of <strong>Soda</strong> <strong>Ash</strong> 26<br />
3.2 Asia Pacific Region to witness highest growth during forecast period. 27<br />
4. Product Overview 28<br />
5. <strong>Global</strong> <strong>Soda</strong> <strong>Ash</strong> <strong>Market</strong>: Growth and Forecast 33<br />
5.1 By <strong>Value</strong> (2014-2018) 34<br />
5.2 By <strong>Value</strong> (2019-2024) 35<br />
5.3 By <strong>Volume</strong> (2014-2018) 44<br />
5.4 By <strong>Volume</strong> (2019-2024) 45<br />
6. <strong>Global</strong> <strong>Soda</strong> <strong>Ash</strong> <strong>Market</strong>-By Product Type, By <strong>Value</strong> 46<br />
6.1 <strong>Global</strong> <strong>Soda</strong> <strong>Ash</strong> <strong>Market</strong>- By <strong>Value</strong>: Breakdown(%) 47<br />
6.1.1 <strong>Global</strong> <strong>Soda</strong> <strong>Ash</strong> <strong>Market</strong> Size and Share, By Product Type , 2018 47<br />
6.1.2 <strong>Global</strong> <strong>Soda</strong> <strong>Ash</strong> <strong>Market</strong> Size and Share, By Product Type , 2024 48<br />
4
Table of Content<br />
S. No Particulars Page<br />
No.<br />
6.3 <strong>Global</strong> <strong>Soda</strong> <strong>Ash</strong> <strong>Market</strong>- By Light 50<br />
6.3.1 By <strong>Value</strong> (2014-2024) 50<br />
6.4 <strong>Global</strong> <strong>Soda</strong> <strong>Ash</strong> <strong>Market</strong>- By Dense 51<br />
6.4.1 By <strong>Value</strong> (2014-2024) 51<br />
7. <strong>Global</strong> <strong>Soda</strong> <strong>Ash</strong> <strong>Market</strong>-By Process Type, By <strong>Value</strong> 52<br />
7.1 <strong>Global</strong> <strong>Soda</strong> <strong>Ash</strong> <strong>Market</strong>- By <strong>Value</strong>: Breakdown(%) 53<br />
7.1.1 <strong>Global</strong> <strong>Soda</strong> <strong>Ash</strong> <strong>Market</strong> Size and Share, By Process Type , 2018 53<br />
7.1.2 <strong>Global</strong> <strong>Soda</strong> <strong>Ash</strong> <strong>Market</strong> Size and Share, By Process Type , 2024 54<br />
7.3 <strong>Global</strong> <strong>Soda</strong> <strong>Ash</strong> <strong>Market</strong>- By Natural 55<br />
7.3.1 By <strong>Value</strong> (2014-2024) 55<br />
7.4 <strong>Global</strong> <strong>Soda</strong> <strong>Ash</strong> <strong>Market</strong>- By Synthetic 56<br />
7.4.1 By <strong>Value</strong> (2014-2024) 56<br />
8. <strong>Global</strong> <strong>Soda</strong> <strong>Ash</strong> <strong>Market</strong>-By Applications By <strong>Value</strong> 57<br />
8.1 <strong>Global</strong> <strong>Soda</strong> <strong>Ash</strong> <strong>Market</strong>- By <strong>Value</strong>: Breakdown(%) 58<br />
8.1.1 <strong>Global</strong> <strong>Soda</strong> <strong>Ash</strong> <strong>Market</strong> Size and Share, By Applications, 2018 58<br />
5
Table of Content<br />
S. No Particulars Page<br />
No.<br />
8.1.2 <strong>Global</strong> <strong>Soda</strong> <strong>Ash</strong> <strong>Market</strong> Size and Share, By Applications , 2024 59<br />
8.2 <strong>Global</strong> <strong>Soda</strong> <strong>Ash</strong> <strong>Market</strong>, By Glass 60<br />
8.2.1 By <strong>Value</strong> (2014-2024) 60<br />
8.3 <strong>Global</strong> <strong>Soda</strong> <strong>Ash</strong> <strong>Market</strong>, By Soaps and Detergents 63<br />
8.2.1 By <strong>Value</strong> (2014-2024) 63<br />
8.4 <strong>Global</strong> <strong>Soda</strong> <strong>Ash</strong> <strong>Market</strong>, By Chemical 64<br />
8.4.1 By <strong>Value</strong> (2014-2024) 64<br />
8.5 <strong>Global</strong> <strong>Soda</strong> <strong>Ash</strong> <strong>Market</strong>, By Metallurgy 66<br />
8.5.1 By <strong>Value</strong> (2014-2024) 66<br />
8.6 <strong>Global</strong> <strong>Soda</strong> <strong>Ash</strong> <strong>Market</strong>, By Other Applications 67<br />
8.6.1 By <strong>Value</strong> (2014-2024) 67<br />
9. <strong>Global</strong> <strong>Soda</strong> <strong>Ash</strong> <strong>Market</strong>: Regional Analysis 68<br />
9.1 <strong>Global</strong> <strong>Soda</strong> <strong>Ash</strong> <strong>Market</strong>, By Region: Breakdown (%) 69<br />
9.1.1 <strong>Global</strong> <strong>Soda</strong> <strong>Ash</strong> <strong>Market</strong> Size, By Region, By <strong>Value</strong>, 2018 (%) 69<br />
9.1.2 <strong>Global</strong> <strong>Soda</strong> <strong>Ash</strong> <strong>Market</strong> Size, By Region, By <strong>Value</strong>, 2024 (%) 70<br />
6
Table of Content<br />
S. No Particulars Page<br />
No.<br />
9.1.3 <strong>Global</strong> <strong>Soda</strong> <strong>Ash</strong> <strong>Market</strong> Size, By Region, By <strong>Volume</strong>, 2018(%) 69<br />
9.1.4 <strong>Global</strong> <strong>Soda</strong> <strong>Ash</strong> <strong>Market</strong> Size, By Region, By <strong>Volume</strong>, 2024 (%) 70<br />
9.2 North America <strong>Soda</strong> <strong>Ash</strong> <strong>Market</strong>: An Analysis 72<br />
9.2.1 By <strong>Value</strong> (2014-2018) 73<br />
9.2.2 By <strong>Value</strong> (2019-2024) 74<br />
9.2.3 By <strong>Volume</strong> (2014-2018) 77<br />
9.2.4 By <strong>Volume</strong> (2019-2024) 78<br />
9.3 North America <strong>Soda</strong> <strong>Ash</strong> <strong>Market</strong>: Segment Analysis 79<br />
9.3.1 North America <strong>Soda</strong> <strong>Ash</strong> <strong>Market</strong>, By Product Type, By <strong>Value</strong> (2014-2024) 80<br />
9.3.2 North America <strong>Soda</strong> <strong>Ash</strong> <strong>Market</strong>, By Process Type, By <strong>Value</strong> (2014-2024) 81<br />
9.3.3 North America <strong>Soda</strong> <strong>Ash</strong> <strong>Market</strong>, By Application, By <strong>Value</strong> (2014-2024) 82<br />
9.4 North America <strong>Soda</strong> <strong>Ash</strong> <strong>Market</strong>: Country Analysis (U.S., Canada, Mexico) 84<br />
9.4.1 U.S. <strong>Soda</strong> <strong>Ash</strong> <strong>Market</strong>, By <strong>Value</strong> (2014-2024) 88<br />
9.4.2 U.S. <strong>Soda</strong> <strong>Ash</strong> <strong>Market</strong>, By <strong>Volume</strong> (2014-2024) 90<br />
7
Table of Content<br />
S. No Particulars Page<br />
No.<br />
9.4.3 U.S. <strong>Soda</strong> <strong>Ash</strong> <strong>Market</strong>, By Application, By <strong>Value</strong> (2014-2024) 91<br />
9.4.4 Canada <strong>Soda</strong> <strong>Ash</strong> <strong>Market</strong>, By <strong>Value</strong> (2014-2024) 94<br />
9.4.5 Canada <strong>Soda</strong> <strong>Ash</strong> <strong>Market</strong>, By <strong>Volume</strong> (2014-2024) 95<br />
9.4.6 Canada <strong>Soda</strong> <strong>Ash</strong> <strong>Market</strong>, By Application Type, By <strong>Value</strong> (2014-2024) 96<br />
9.5 Europe <strong>Soda</strong> <strong>Ash</strong> <strong>Market</strong>: An Analysis 98<br />
9.5.1 By <strong>Value</strong> (2014-2018) 99<br />
9.5.2 By <strong>Value</strong> (2019-2024) 101<br />
9.5.3 By <strong>Volume</strong> (2014-2018) 105<br />
9.5.4 By <strong>Volume</strong> (2019-2024) 106<br />
9.6 Europe <strong>Soda</strong> <strong>Ash</strong> <strong>Market</strong>: Segment Analysis 108<br />
9.6.1 Europe <strong>Soda</strong> <strong>Ash</strong> <strong>Market</strong>, By Product Type, By <strong>Value</strong> (2014-2024) 109<br />
9.6.2 Europe <strong>Soda</strong> <strong>Ash</strong> <strong>Market</strong>, By Process Type, By <strong>Value</strong> (2014-2024) 110<br />
9.6.3 Europe <strong>Soda</strong> <strong>Ash</strong> <strong>Market</strong>, By Application, By <strong>Value</strong> (2014-2024) 111<br />
9.7 Europe <strong>Soda</strong> <strong>Ash</strong> <strong>Market</strong>: Country Analysis (Germany, France, Rest of Europe) 114<br />
9.7.1 Germany <strong>Soda</strong> <strong>Ash</strong> <strong>Market</strong>, By <strong>Value</strong> (2014-2024) 115<br />
8
Table of Content<br />
S. No Particulars Page<br />
No.<br />
9.7.2 Germany <strong>Soda</strong> <strong>Ash</strong> <strong>Market</strong>, By <strong>Volume</strong> (2014-2024) 118<br />
9.7.3 Germany <strong>Soda</strong> <strong>Ash</strong> <strong>Market</strong>, By Application, By <strong>Value</strong> (2014-2024) 120<br />
9.7.4 France <strong>Soda</strong> <strong>Ash</strong> <strong>Market</strong>, By <strong>Value</strong> (2014-2024) 124<br />
9.7.5 France <strong>Soda</strong> <strong>Ash</strong> <strong>Market</strong>, By <strong>Volume</strong> (2014-2024) 125<br />
9.7.6 France <strong>Soda</strong> <strong>Ash</strong> <strong>Market</strong>, By Application, By <strong>Value</strong> (2014-2024) 127<br />
9.7.9 Rest of Europe Cocoa Butter Equivalent <strong>Market</strong>, By <strong>Value</strong> (2014-2024) 130<br />
9.7.10 Rest of Europe Cocoa Butter Equivalent <strong>Market</strong>, By <strong>Volume</strong> (2014-2024) 131<br />
9.7.11 Rest of Europe <strong>Soda</strong> <strong>Ash</strong> <strong>Market</strong>, By Application, By <strong>Value</strong> (2014-2024) 132<br />
9.8 Asia Pacific <strong>Soda</strong> <strong>Ash</strong> <strong>Market</strong>: An Analysis 133<br />
9.8.1 By <strong>Value</strong> (2014-2018) 134<br />
9.8.2 By <strong>Value</strong> (2019-2024) 135<br />
9.8.3 By <strong>Volume</strong> (2014-2018) 137<br />
9.8.4 By <strong>Volume</strong> (2019-2024) 138<br />
9.9 Asia Pacific <strong>Soda</strong> <strong>Ash</strong> <strong>Market</strong>: Segment Analysis 139<br />
9.9.1 Asia Pacific <strong>Soda</strong> <strong>Ash</strong> <strong>Market</strong>, By Product Type, By <strong>Value</strong> (2014-2024) 140<br />
9
Table of Content<br />
S. No Particulars Page<br />
No.<br />
9.9.2 Asia Pacific <strong>Soda</strong> <strong>Ash</strong> <strong>Market</strong>, By Process Type, By <strong>Volume</strong> (2014-2024) 141<br />
9.9.3 Asia Pacific <strong>Soda</strong> <strong>Ash</strong> <strong>Market</strong>, By Application, By <strong>Value</strong> (2014-2024) 142<br />
9.10 Asia Pacific <strong>Soda</strong> <strong>Ash</strong> Equivalent <strong>Market</strong>: Country Analysis (China, India, Rest of Asia Pacific) 144<br />
9.10.1 China <strong>Soda</strong> <strong>Ash</strong> t <strong>Market</strong>, By <strong>Value</strong> (2014-2024) 148<br />
9.10.2 China <strong>Soda</strong> <strong>Ash</strong> <strong>Market</strong>, By <strong>Volume</strong> (2014-2024) 150<br />
9.10.3 China <strong>Soda</strong> <strong>Ash</strong> <strong>Market</strong>, By Application, By <strong>Value</strong> (2014-2024) 152<br />
9.10.4 India <strong>Soda</strong> <strong>Ash</strong> <strong>Market</strong>, By <strong>Value</strong> (2014-2024) 157<br />
9.10.5 India <strong>Soda</strong> <strong>Ash</strong> <strong>Market</strong>, By <strong>Volume</strong> (2014-2024) 160<br />
9.10.6 India <strong>Soda</strong> <strong>Ash</strong> <strong>Market</strong>, By Application, By <strong>Value</strong> (2014-2024) 161<br />
9.10.7 Rest of Asia Pacific <strong>Soda</strong> <strong>Ash</strong> <strong>Market</strong>, By <strong>Value</strong> (2014-2024) 166<br />
9.10.8 Rest of Asia Pacific <strong>Soda</strong> <strong>Ash</strong> <strong>Market</strong>, By <strong>Volume</strong> (2014-2024) 167<br />
9.10.9 Rest of Asia Pacific <strong>Soda</strong> <strong>Ash</strong> <strong>Market</strong>, By Application, By <strong>Value</strong> (2014-2024) 168<br />
9.11 Rest of World <strong>Soda</strong> <strong>Ash</strong> <strong>Market</strong>: An Analysis 169<br />
9.11.1 By <strong>Value</strong> (2014-2018) 170<br />
9.11.2 By <strong>Value</strong> (2019-2024) 171<br />
10
Table of Content<br />
S. No Particulars Page<br />
No.<br />
9.11.3 By <strong>Volume</strong> (2014-2018) 172<br />
9.11.4 By <strong>Volume</strong> (2019-2024) 173<br />
9.12 Rest of World <strong>Soda</strong> <strong>Ash</strong> <strong>Market</strong>: Segment Analysis 174<br />
9.12.1 Rest of World <strong>Soda</strong> <strong>Ash</strong> <strong>Market</strong>: By Product Type, By <strong>Value</strong> (2014-2024) 174<br />
9.12.2 Rest of World <strong>Soda</strong> <strong>Ash</strong> <strong>Market</strong>, By Process Type, By <strong>Value</strong> (2014-2024) 175<br />
9.12.3 Rest of World <strong>Soda</strong> <strong>Ash</strong> <strong>Market</strong>, By Application, By <strong>Value</strong> (2014-2024) 176<br />
9.13 Rest of World <strong>Soda</strong> <strong>Ash</strong> <strong>Market</strong>: Country Analysis (Brazil. Mexico, Rest of Europe) 181<br />
9.13.1 Brazil <strong>Soda</strong> <strong>Ash</strong> <strong>Market</strong>, By <strong>Value</strong> (2014-2024) 182<br />
9.13.2 Brazil <strong>Soda</strong> <strong>Ash</strong> <strong>Market</strong>, By <strong>Volume</strong> (2014-2024) 183<br />
9.13.3 Brazil <strong>Soda</strong> <strong>Ash</strong> <strong>Market</strong>, By Application, By <strong>Value</strong> (2014-2024) 184<br />
9.13.4 Mexico<strong>Soda</strong> <strong>Ash</strong> <strong>Market</strong>, By <strong>Value</strong> (2014-2024) 188<br />
9.13.5 Mexico <strong>Soda</strong> <strong>Ash</strong> <strong>Market</strong>, By <strong>Volume</strong> (2014-2024) 189<br />
9.13.6 Mexico <strong>Soda</strong> <strong>Ash</strong> <strong>Market</strong>, By Application, By <strong>Value</strong> (2014-2024) 190<br />
9.13.4 Others <strong>Soda</strong> <strong>Ash</strong> <strong>Market</strong>, By <strong>Value</strong> (2014-2024) 193<br />
9.13.5 Others <strong>Soda</strong> <strong>Ash</strong> <strong>Market</strong>, By <strong>Volume</strong> (2014-2024) 194<br />
11
Table of Content<br />
S. No Particulars Page<br />
No.<br />
10 <strong>Market</strong> Dynamics 196<br />
10.1 Drivers 197<br />
10.2 Challenges 201<br />
11. <strong>Market</strong> Trends 204<br />
12. Supply Chain Analysis 205<br />
13. Porter’s Five Forces Analysis 207<br />
14. SWOT Analysis 209<br />
15. Company Profiling 211<br />
15.1 Solvay 212<br />
15.2 Tata Chemicals 214<br />
15.3 Ciner 216<br />
15.4 Genisis Alkali 218<br />
15.5 Nirma Limited 219<br />
15.6 Shandong Haihua 220<br />
15.7 Ciech SA 221<br />
15.8 Tangshan Sanyou Chemical Industries 223<br />
16. About Us 224<br />
12
List of Figures<br />
Figure No. Figure Title Page No.<br />
Figure 1: Flow Chart of Production of <strong>Soda</strong> <strong>Ash</strong> 30<br />
Figure 2: General Properties of <strong>Soda</strong> <strong>Ash</strong> 32<br />
Figure 3: <strong>Global</strong> <strong>Soda</strong> <strong>Ash</strong> <strong>Market</strong>, By <strong>Value</strong>, 2014-2018 (USD Million) 34<br />
Figure 4: <strong>Global</strong> <strong>Soda</strong> <strong>Ash</strong> <strong>Market</strong>, By <strong>Value</strong>, Forecast, 2019-2024 (USD Million) 35<br />
Figure 5: World Production of <strong>Soda</strong> <strong>Ash</strong> (2014-2018, Thousand Tonnes) 36<br />
Figure 6: Production of <strong>Soda</strong> <strong>Ash</strong> , By Region, 2018 36<br />
Figure 7: Demand and Imports in Key <strong>Market</strong> (Million Tone) 37<br />
Figure 8: <strong>Global</strong> <strong>Soda</strong> <strong>Ash</strong> Top 10 Producers by Annual Capacity (2017, %) 38<br />
Figure 9: <strong>Global</strong> <strong>Soda</strong> <strong>Ash</strong> Top 10 Producers by Annual Capacity (2018, %) 38<br />
Figure 10: Production of Natural <strong>Soda</strong> <strong>Ash</strong> ( 2014-2018, Thousand Tonnes) 39<br />
Figure 11: Production of Synthetic <strong>Soda</strong> <strong>Ash</strong> ( 2014- 2018, Thousand Tonnes) 39<br />
Figure 12: <strong>Global</strong> GDP, 2011-2017 (USD Trillion) 42<br />
Figure 13: World Middle Class Population (2009&2020&2030, In Billion) 42<br />
Figure 14: <strong>Global</strong> <strong>Soda</strong> <strong>Ash</strong> <strong>Market</strong>, By <strong>Volume</strong>, 2014-2018(Million Tone) 44<br />
Figure 15: <strong>Global</strong> <strong>Soda</strong> <strong>Ash</strong> <strong>Market</strong>, By <strong>Volume</strong>, Forecast, 2019-2024 (Million Tone) 45<br />
Figure 16: <strong>Global</strong> <strong>Soda</strong> <strong>Ash</strong> <strong>Market</strong> Size and Share, By Product Type, 2018(%) 47<br />
Figure 17: <strong>Global</strong> <strong>Soda</strong> <strong>Ash</strong> <strong>Market</strong> Size and Share, By Product Type, 2024(%) 48<br />
Figure 18: <strong>Global</strong> Light <strong>Soda</strong> <strong>Ash</strong> <strong>Market</strong>, By <strong>Value</strong>, 2014-2018 (USD Million) 50<br />
Figure 19: <strong>Global</strong> Light <strong>Soda</strong> <strong>Ash</strong> <strong>Market</strong>, By <strong>Value</strong>, 2019-2024 (USD Million) 50<br />
Figure 20: <strong>Global</strong> Dense <strong>Soda</strong> <strong>Ash</strong> <strong>Market</strong>, By <strong>Value</strong>, 2014-2018 (USD Million) 51<br />
13
List of Figures<br />
Figure No. Figure Title Page No.<br />
Figure 21: <strong>Global</strong> Dense <strong>Soda</strong> <strong>Ash</strong> <strong>Market</strong>, By <strong>Value</strong>, 2019-2024 (USD Million) 51<br />
Figure 22: <strong>Global</strong> <strong>Soda</strong> <strong>Ash</strong> <strong>Market</strong> Size and Share, By Process Type, 2018 % 53<br />
Figure 23: <strong>Global</strong> <strong>Soda</strong> <strong>Ash</strong> <strong>Market</strong> Size and Share, By Product Type, 2024 % 54<br />
Figure 24: <strong>Global</strong> <strong>Soda</strong> <strong>Ash</strong> <strong>Market</strong>, By Natural Process, By <strong>Value</strong>, 2014-2018 (USD Million) 55<br />
Figure 25: <strong>Global</strong> <strong>Soda</strong> <strong>Ash</strong> <strong>Market</strong>, By Natural Process, By <strong>Value</strong>, 2019-2024 (USD Million) 55<br />
Figure 26: <strong>Global</strong> <strong>Soda</strong> <strong>Ash</strong> <strong>Market</strong>, By Synthetic Process, By <strong>Value</strong>, 2014-2018 (USD Million) 56<br />
Figure 27: <strong>Global</strong> <strong>Soda</strong> <strong>Ash</strong> <strong>Market</strong>, By Synthetic Process, By <strong>Value</strong>, 2019-2024 (USD Million) 56<br />
Figure 28: <strong>Global</strong> <strong>Soda</strong> <strong>Ash</strong> <strong>Market</strong> Size and Share, By Applications, 2018 (%) 58<br />
Figure 29: <strong>Global</strong> <strong>Soda</strong> <strong>Ash</strong> <strong>Market</strong> Size and Share, By Applications , 2024(%) 59<br />
Figure 30: <strong>Global</strong> <strong>Soda</strong> <strong>Ash</strong> <strong>Market</strong>, By Glass,By <strong>Value</strong>, 2014-2018 (USD Million) 60<br />
Figure 31: <strong>Global</strong> <strong>Soda</strong> <strong>Ash</strong> <strong>Market</strong>, By Glass,By <strong>Value</strong>, Forecast,2019-2024 ( USD Million) 60<br />
Figure 32: Projected <strong>Value</strong> of fabricated Flat Glass Demand from 2003 to 2023 ( USD Million) 61<br />
Figure 33: Production statistics of cars & commercial vehicles in 2018 61<br />
Figure 34: <strong>Market</strong> Share of <strong>Global</strong> Glass Export, By Highest Dollar <strong>Value</strong>, By Country, 2017(%) 62<br />
Figure 35: Countries Exported Highest Dollar <strong>Value</strong> Worth Glass and Glassware in 2017 62<br />
Figure 36: <strong>Global</strong> <strong>Soda</strong> <strong>Ash</strong> <strong>Market</strong>, By Soaps and Detergents ,By <strong>Value</strong>, 2014-2018 (USD Million) 63<br />
Figure 37: <strong>Global</strong> <strong>Soda</strong> <strong>Ash</strong> <strong>Market</strong>, By Soaps and Detergents ,,By <strong>Value</strong>, Forecast,2019-2024 ( USD Million) 63<br />
Figure 38: <strong>Global</strong> <strong>Soda</strong> <strong>Ash</strong> <strong>Market</strong>, By Chemical , By <strong>Value</strong>, 2014-2018 (USD Million) 64<br />
Figure 39: <strong>Global</strong> <strong>Soda</strong> <strong>Ash</strong> <strong>Market</strong>, By Chemical, By <strong>Value</strong>, Forecast,2019-2024 ( USD Million) 64<br />
Figure 40: Projection of Annual Capital expenditure from the <strong>Global</strong> Chemical Industry from 2019-2023 ( USD Billion) 65<br />
14
List of Figures<br />
Figure No. Figure Title Page No.<br />
Figure 41: Total Revenue of <strong>Global</strong> Chemical Industry (2012-2017, USD billion) 65<br />
Figure 42: <strong>Global</strong> <strong>Soda</strong> <strong>Ash</strong> <strong>Market</strong>, By Metallurgy, By <strong>Value</strong>, 2014-2018 (USD Million) 66<br />
Figure 43: <strong>Global</strong> <strong>Soda</strong> <strong>Ash</strong> <strong>Market</strong>, By Metallurgy, By <strong>Value</strong>, Forecast,2019-2024 ( USD Million) 66<br />
Figure 44: <strong>Global</strong> <strong>Soda</strong> <strong>Ash</strong> <strong>Market</strong>, By Other Application,By <strong>Value</strong>, 2014-2018 (USD Million) 67<br />
Figure 45: <strong>Global</strong> <strong>Soda</strong> <strong>Ash</strong> <strong>Market</strong>, By Other Application,By <strong>Value</strong>, Forecast,2019-2024 ( USD Million) 67<br />
Figure 46: <strong>Global</strong> <strong>Soda</strong> <strong>Ash</strong> <strong>Market</strong> Size, By Region, 2018 (%), By <strong>Value</strong> 69<br />
Figure 47: <strong>Global</strong> <strong>Soda</strong> <strong>Ash</strong> <strong>Market</strong> Size, By Region, 2018 (%), By <strong>Volume</strong> 69<br />
Figure 48: <strong>Global</strong> <strong>Soda</strong> <strong>Ash</strong> <strong>Market</strong> Size, By Region, 2024F (%), By <strong>Value</strong> 70<br />
Figure 49: <strong>Global</strong> <strong>Soda</strong> <strong>Ash</strong> <strong>Market</strong> Size, By Region, 2024F (%), By <strong>Volume</strong> 70<br />
Figure 50: Capacity and Demand Balance for <strong>Soda</strong> <strong>Ash</strong>,2016 71<br />
Figure 51: North America <strong>Soda</strong> <strong>Ash</strong> <strong>Market</strong> Size, By <strong>Value</strong>, 2014-2018 (USD Million) 73<br />
Figure 52: North America <strong>Soda</strong> <strong>Ash</strong> <strong>Market</strong> Size, By <strong>Value</strong>, Forecast, 2019-2024 (USD Million ) 74<br />
Figure 53: North America <strong>Soda</strong> <strong>Ash</strong> <strong>Market</strong> Size, By <strong>Volume</strong>, 2014-2018(Million Tone) 77<br />
Figure 54: North America <strong>Soda</strong> <strong>Ash</strong> <strong>Market</strong> Size, By <strong>Volume</strong>, Forecast, 2019-2024(Million Tone) 78<br />
Figure 55: North America <strong>Soda</strong> <strong>Ash</strong> <strong>Market</strong>: By Product Type, By <strong>Value</strong>, 2014-2024(USD Million) 80<br />
Figure 56: Rest of world <strong>Soda</strong> <strong>Ash</strong> <strong>Market</strong>: By Process Type, By <strong>Value</strong>, 2014-2024(USD Million) 81<br />
Figure 57: North America <strong>Soda</strong> <strong>Ash</strong> <strong>Market</strong>: By Application, By <strong>Value</strong>, 2014-2024(USD Million) 82<br />
Figure 58: Flat Glass Plants and Lines in North America 83<br />
Figure 59: North America <strong>Soda</strong> <strong>Ash</strong> <strong>Market</strong>, By <strong>Value</strong> Country Share, 2018 (% of Total) 85<br />
Figure 60: North America <strong>Soda</strong> <strong>Ash</strong>, By <strong>Value</strong>, Country Share, 2024F (% of Total) 85<br />
15
List of Figures<br />
Figure No. Figure Title Page No.<br />
Figure 61: North America <strong>Soda</strong> <strong>Ash</strong> <strong>Market</strong>, By <strong>Volume</strong>, Country Share, 2018 (% of Total) 86<br />
Figure 62: North America <strong>Soda</strong> <strong>Ash</strong>, By <strong>Volume</strong>, Country Share, 2024F (% of Total) 86<br />
Figure 63: United States <strong>Soda</strong> <strong>Ash</strong> <strong>Market</strong> Size, By <strong>Value</strong>, 2014-2018 (USD Million) 88<br />
Figure 64: United States <strong>Soda</strong> <strong>Ash</strong> <strong>Market</strong> Size, By <strong>Value</strong>, 2019E-2024F (USD Million) 88<br />
Figure 65: <strong>Soda</strong> <strong>Ash</strong> Import Sources to United States From 2014 to 2017 (%) 89<br />
Figure 66: Total amount of <strong>Soda</strong> <strong>Ash</strong> Exports to United States (Thousand Tonnes,2014-2018) 89<br />
Figure 67: Total Production of <strong>Soda</strong> <strong>Ash</strong> in United States (Thousand Tonnes,2014-2018) 89<br />
Figure 68: United States <strong>Soda</strong> <strong>Ash</strong> <strong>Market</strong> Size, By <strong>Volume</strong>, 2014-2018 (Million Ton) 90<br />
Figure 69: United States <strong>Soda</strong> <strong>Ash</strong> <strong>Market</strong> Size, By <strong>Value</strong>, 2019E-2024F (Million Ton) 90<br />
Figure 70: United States <strong>Soda</strong> <strong>Ash</strong> <strong>Market</strong>: By Application, By <strong>Value</strong>, 2014-2024(USD Million) 91<br />
Figure 71: Per Capita Average Expenditure on Soaps and Detergents in United States (2012-2017, USD) 92<br />
Figure 72: Glass and Glass Product Manufacturing Gross Output in United States in (2011-2016, USD Million) 92<br />
Figure 73: Canada <strong>Soda</strong> <strong>Ash</strong> <strong>Market</strong> Size, By <strong>Value</strong>, 2014-2018 (USD Million) 94<br />
Figure 74: Canada <strong>Soda</strong> <strong>Ash</strong> <strong>Market</strong> Size By <strong>Value</strong>, 2019E-2024F (USD Million) 94<br />
Figure 75: United States <strong>Soda</strong> <strong>Ash</strong> <strong>Market</strong> Size, By <strong>Volume</strong>, 2014-2018 (Million Tone) 95<br />
Figure 76: United States <strong>Soda</strong> <strong>Ash</strong> <strong>Market</strong> Size, By <strong>Value</strong>, 2019E-2024F (Million Tone) 95<br />
Figure 77: Canada <strong>Soda</strong> <strong>Ash</strong> <strong>Market</strong>: By Application, By <strong>Value</strong>, 2014-2024(USD Million) 96<br />
Figure 78: Canada Automotive Production Data (USD Millions) 97<br />
Figure 79: Europe <strong>Soda</strong> <strong>Ash</strong> <strong>Market</strong> Size, By <strong>Value</strong>, 2014-2018 (USD Million) 99<br />
Figure 80: Europe Export of Soap ( USD Million, 2012-2016) 100<br />
16
List of Figures<br />
Figure No. Figure Title Page No.<br />
Figure 81: Leading Suppliers of Soap, By European Countries (%, 2016) 100<br />
Figure 82: Europe <strong>Soda</strong> <strong>Ash</strong> <strong>Market</strong> Size, By <strong>Value</strong>, Forecast, 2019-2024(USD Million ) 101<br />
Figure 83: Capacity Addition in Turkey (2010-20222, Million Tone) 103<br />
Figure 84: Europe <strong>Soda</strong> <strong>Ash</strong> <strong>Market</strong> Size, By <strong>Volume</strong>, 2014-2018(Million Tone) 105<br />
Figure 85: Europe <strong>Soda</strong> <strong>Ash</strong> <strong>Market</strong> Size, By <strong>Volume</strong>, Forecast, 2019-2024(Million Tone) 106<br />
Figure 86: Europe 28 Glass Production ( Mio Tonnes, 2013-2017) 107<br />
Figure 87: EU 28 Production Share Breakdown, By Glass Type,2017 % 107<br />
Figure 88: Europe <strong>Soda</strong> <strong>Ash</strong> <strong>Market</strong>: By Product Type, By <strong>Value</strong>, 2014-2024(USD Million) 109<br />
Figure 89: Europe <strong>Soda</strong> <strong>Ash</strong> <strong>Market</strong>: By Process Type, By <strong>Value</strong>, 2014-2024(USD Million) 110<br />
Figure 90: Europe <strong>Soda</strong> <strong>Ash</strong> <strong>Market</strong>: By Application Type, By <strong>Value</strong>, 2014-2024 (USD Million) 111<br />
Figure 91: New passenger car registrations in the EU 112<br />
Figure 92: European Construction Industry Index 113<br />
Figure 93: Europe <strong>Soda</strong> <strong>Ash</strong> <strong>Market</strong>, Country Share, , By <strong>Value</strong>, 2018 (% of Total) 115<br />
Figure 94: Europe <strong>Soda</strong> <strong>Ash</strong> <strong>Market</strong>, Country Share, , By <strong>Value</strong>, 2024 (% of Total) 115<br />
Figure 95: Europe <strong>Soda</strong> <strong>Ash</strong> <strong>Market</strong>, Country Share, By <strong>Volume</strong>, 2018 (% of Total) 116<br />
Figure 96: Europe <strong>Soda</strong> <strong>Ash</strong> <strong>Market</strong>, Country Share, , By <strong>Volume</strong>, 2024 (% of Total) 116<br />
Figure 97: Germany <strong>Soda</strong> <strong>Ash</strong> <strong>Market</strong> Size, By <strong>Value</strong>, 2014-2018 (USD Million) 118<br />
Figure 98: Germany <strong>Soda</strong> <strong>Ash</strong> <strong>Market</strong> Size, By <strong>Value</strong>, 2019E-2024F (USD Million) 118<br />
Figure 99: Germany <strong>Soda</strong> <strong>Ash</strong> <strong>Market</strong> Size, By <strong>Volume</strong>, 2014-2018 (Million Tone) 119<br />
Figure 100: Germany <strong>Soda</strong> <strong>Ash</strong> <strong>Market</strong> Size, By <strong>Volume</strong>, 2019E-2024F (Million Tone) 119<br />
17
List of Figures<br />
Figure No. Figure Title Page No.<br />
Figure 101: Germany <strong>Soda</strong> <strong>Ash</strong> <strong>Market</strong>: By Application, By <strong>Value</strong>, 2014-2024(USD Million) 120<br />
Figure 102: Production of Passenger Cars by country in EU, 2017 ( in million units) 121<br />
Figure 103: Revenue From Laundry detergents and Cleaning products in Germany (2013-2017, USD Million) 122<br />
Figure 104: Germany Chemical Industry <strong>Market</strong> Segmentation by Revenues in Euro Billions,2017 122<br />
Figure 105: France <strong>Soda</strong> <strong>Ash</strong> <strong>Market</strong> Size, By <strong>Value</strong>, 2014-2018(USD Million) 124<br />
Figure 106: France <strong>Soda</strong> <strong>Ash</strong> <strong>Market</strong> Size, By <strong>Value</strong>, 2019E-2024F (USD Million) 124<br />
Figure 107: France <strong>Soda</strong> <strong>Ash</strong> <strong>Market</strong> Size, By <strong>Volume</strong>, 2014-2018(Million Tone) 125<br />
Figure 108: France <strong>Soda</strong> <strong>Ash</strong> <strong>Market</strong> Size, By <strong>Volume</strong>, 2019E-2024F (Million Tone) 125<br />
Figure 109: France Gross Domestic Product (2013-2017, USD Trillion) 126<br />
Figure 110: France Degree of Urbanization (2013-2017) % 126<br />
Figure 111: France <strong>Soda</strong> <strong>Ash</strong> <strong>Market</strong>: By Application , By <strong>Value</strong>, 2014-2024(USD Million) 127<br />
Figure 112: Rest of Europe <strong>Soda</strong> <strong>Ash</strong> <strong>Market</strong> Size, By <strong>Value</strong>, 2014-2018(USD Million) 130<br />
Figure 113: Rest of Europe <strong>Soda</strong> <strong>Ash</strong> <strong>Market</strong> Size, By <strong>Value</strong>, 2019E-2024F (USD Million) 130<br />
Figure 114: Rest of Europe <strong>Soda</strong> <strong>Ash</strong> <strong>Market</strong> Size, By <strong>Volume</strong>, 2014-2018(Million Tone) 131<br />
Figure 115: Rest of Europe <strong>Soda</strong> <strong>Ash</strong> <strong>Market</strong> Size, By <strong>Volume</strong>, 2019E-2024F ( Million Tone) 131<br />
Figure 116: Rest of Europe <strong>Soda</strong> <strong>Ash</strong> <strong>Market</strong>: By Application, By <strong>Value</strong>, 2014-2024(USD Million) 132<br />
Figure 117: Asia Pacific <strong>Soda</strong> <strong>Ash</strong> <strong>Market</strong> Size, By <strong>Value</strong>, 2014-2018 (USD Million) 134<br />
Figure 118: Asia Pacific <strong>Soda</strong> <strong>Ash</strong> <strong>Market</strong> Size, By <strong>Value</strong>, Forecast, 2019-2024(USD Million ) 135<br />
Figure 119: Asia Pacific <strong>Soda</strong> <strong>Ash</strong> <strong>Market</strong> Size, By <strong>Volume</strong>, 2014-2018(Million Tone) 137<br />
Figure 120: Asia Pacific <strong>Soda</strong> <strong>Ash</strong> <strong>Market</strong> Size, By <strong>Volume</strong>, Forecast, 2019-2024(Million Tone) 138<br />
18
List of Figures<br />
Figure No. Figure Title Page No.<br />
Figure 121: Asia Pacific <strong>Soda</strong> <strong>Ash</strong> <strong>Market</strong>: By Product Type, By <strong>Value</strong>, 2014-2024(USD Million) 140<br />
Figure 122: Asia Pacific <strong>Soda</strong> <strong>Ash</strong> <strong>Market</strong>: By Process Type, By <strong>Value</strong>, 2014-2024(USD Million) 141<br />
Figure 123: Asia Pacific <strong>Soda</strong> <strong>Ash</strong> <strong>Market</strong>: By Application, By <strong>Value</strong>, 2014-2024(USD Million) 142<br />
Figure 124: APAC Automotive Manufacturing Output Geographic Breakdown 143<br />
Figure 125: Number of Registrations or Sales of New Vehicles in APAC Region 2016 & 2017, By country (in Million units) 143<br />
Figure 126: Asia Pacific <strong>Soda</strong> <strong>Ash</strong> <strong>Market</strong>, Country Share, By <strong>Value</strong>, 2018 (% of Total) 145<br />
Figure 127: Asia Pacific <strong>Soda</strong> <strong>Ash</strong> <strong>Market</strong>, Country Share, By <strong>Value</strong>,2024 (% of Total) 145<br />
Figure 128: Asia Pacific <strong>Soda</strong> <strong>Ash</strong> <strong>Market</strong>, Country Share, By <strong>Volume</strong>, 2018 (% of Total) 146<br />
Figure 129: Asia Pacific <strong>Soda</strong> <strong>Ash</strong> <strong>Market</strong>, Country Share, , By <strong>Volume</strong>, 2024 (% of Total) 146<br />
Figure 130: China <strong>Soda</strong> <strong>Ash</strong> <strong>Market</strong> Size, By <strong>Value</strong>, 2014-2018(USD Million) 148<br />
Figure 131: China <strong>Soda</strong> <strong>Ash</strong> <strong>Market</strong> Size, By <strong>Value</strong>, 2019E-2024F (USD Million) 148<br />
Figure 132: China <strong>Soda</strong> <strong>Ash</strong> Production (Million Ton, 1994-2016) 149<br />
Figure 133: China <strong>Soda</strong> <strong>Ash</strong> <strong>Market</strong> Size, By <strong>Volume</strong>, 2014-2018(Million Tone) 150<br />
Figure 134: China <strong>Soda</strong> <strong>Ash</strong> <strong>Market</strong> Size, By <strong>Volume</strong>, 2019E-2024F ( Million Tone) 150<br />
Figure 135: China, GDP Growth Per Year, 2015-2019 (In %) 151<br />
Figure 136: China, Share of Urban Population, 2012-2017 (In %) 151<br />
Figure 137: China, Total Population, 2013-2021F (In Billion) 151<br />
Figure 138: China <strong>Soda</strong> <strong>Ash</strong> <strong>Market</strong>: By Application, By <strong>Value</strong>, 2014-2024(USD Million) 152<br />
Figure 139: <strong>Value</strong> added in the Chinese construction industry from 2008 to 2018 (in billion yuan) 153<br />
Figure 140: Growth of <strong>Market</strong> Demand For Soap and Cleaning Agents in China 2014-2018 154<br />
19
List of Figures<br />
Figure No. Figure Title Page No.<br />
Figure 141: <strong>Global</strong> Chemical <strong>Market</strong> in 2020 (USD Billion) 155<br />
Figure 142: China consumption of Chemical Fertilizers (10000 tons) 155<br />
Figure 143: India <strong>Soda</strong> <strong>Ash</strong> <strong>Market</strong> Size, By <strong>Value</strong>, 2014-2018(USD Million) 157<br />
Figure 144: India <strong>Soda</strong> <strong>Ash</strong> <strong>Market</strong> Size, By <strong>Value</strong>, 2019E-2024F (USD Million) 157<br />
Figure 145: India <strong>Soda</strong> <strong>Ash</strong> Production <strong>Market</strong> Share,2017(%) 158<br />
Figure 146: India GDP Growth (2013-2017, USD Trillion) 159<br />
Figure 147: India <strong>Soda</strong> <strong>Ash</strong> <strong>Market</strong> Size, By <strong>Volume</strong>, 2014-2018(Million Tone) 160<br />
Figure 148: India <strong>Soda</strong> <strong>Ash</strong> <strong>Market</strong> Size, By <strong>Volume</strong>, 2019E-2024F ( Million Tone) 160<br />
Figure 149: India <strong>Soda</strong> <strong>Ash</strong> <strong>Market</strong>: By Application, By <strong>Value</strong>, 2014-2024(USD Million) 161<br />
Figure 150: India Glass Industry Revenue 2013 &2017( USD billion) 162<br />
Figure 151: India Vehicle sales (2013-2017) 162<br />
Figure 152: Share of Country wise Glass Export From India in FY 18 % 163<br />
Figure 153: India’s Total Glass Exports (USD Million) 163<br />
Figure 154: New Glass Manufacturing Project Announced in India ( USD Million) 163<br />
Figure 155: India Soap and Detergent Industry Revenue ,2013 &2017 ( USD billion) 164<br />
Figure 156: Production <strong>Volume</strong> of detergents Across India From FY 2015-18 ( Thousand Metric Tons) 164<br />
Figure 157: Rest of Asia Pacific <strong>Soda</strong> <strong>Ash</strong> <strong>Market</strong> Size, By <strong>Value</strong>, 2014-2018(USD Million) 166<br />
Figure 158: Rest of Asia Pacific <strong>Soda</strong> <strong>Ash</strong> <strong>Market</strong> Size, By <strong>Value</strong>, 2019E-2024F (USD Million) 166<br />
Figure 159: Rest of Asia Pacific <strong>Soda</strong> <strong>Ash</strong> <strong>Market</strong> Size, By <strong>Volume</strong>, 2014-2018(Million Tone 167<br />
Figure 160: Rest of Asia Pacific <strong>Soda</strong> <strong>Ash</strong> <strong>Market</strong> Size, By <strong>Volume</strong>, 2019E-2024F ( Million Tone) 167<br />
20
List of Figures<br />
Figure No. Figure Title Page No.<br />
Figure 161: Rest of Asia Pacific <strong>Soda</strong> <strong>Ash</strong> <strong>Market</strong>: By Application, By <strong>Value</strong>, 2014-2024(USD Million) 168<br />
Figure 162: Rest of World <strong>Soda</strong> <strong>Soda</strong> <strong>Ash</strong> <strong>Market</strong> Size, By <strong>Value</strong>, 2014-2018 (USD Million) 170<br />
Figure 163: Rest of World <strong>Soda</strong> <strong>Ash</strong> <strong>Market</strong> Size, By <strong>Value</strong>, Forecast, 2019-2024(USD Million ) 171<br />
Figure 164: Rest of World <strong>Soda</strong> <strong>Ash</strong> <strong>Market</strong> Size, By <strong>Volume</strong>, 2014-2018(Million Tone) 172<br />
Figure 165: Rest of World <strong>Soda</strong> <strong>Ash</strong> <strong>Market</strong> Size, By <strong>Volume</strong>, Forecast, 2019-2024 (Million Tone) 173<br />
Figure 166: Rest of World <strong>Soda</strong> <strong>Ash</strong> <strong>Market</strong>: By Product Type, By <strong>Value</strong>, 2014-2024(USD Million) 174<br />
Figure 167: Rest of world <strong>Soda</strong> <strong>Ash</strong> <strong>Market</strong>: By Process Type, By <strong>Value</strong>, 2014-2024(USD Million) 175<br />
Figure 168: Rest of World <strong>Soda</strong> <strong>Ash</strong> <strong>Market</strong>: By Application, By <strong>Value</strong>, 2014-2024(USD Million) 176<br />
Figure 169: <strong>Value</strong> of Construction Output in the Middle East in 2017, By Country ( USD Billion) 177<br />
Figure 170: Rest of World <strong>Soda</strong> <strong>Ash</strong> <strong>Market</strong>, Country Share, By <strong>Value</strong>, 2018 (% of Total) 179<br />
Figure 171: Rest of World <strong>Soda</strong> <strong>Ash</strong> <strong>Market</strong>, Country Share, , By <strong>Value</strong>,2024 (% of Total) 179<br />
Figure 172: Rest of World <strong>Soda</strong> <strong>Ash</strong> <strong>Market</strong>, Country Share, By <strong>Volume</strong>, 2018 (% of Total) 180<br />
Figure 173: Rest of World <strong>Soda</strong> <strong>Ash</strong> <strong>Market</strong>, Country Share, , By <strong>Volume</strong>,2024 (% of Total) 180<br />
Figure 174: Brazil <strong>Soda</strong> <strong>Ash</strong> <strong>Market</strong> Size, By <strong>Value</strong>, 2014-2018(USD Million) 182<br />
Figure 175: Brazil <strong>Soda</strong> <strong>Ash</strong> <strong>Market</strong> Size, By <strong>Value</strong>, 2019E-2024F (USD Million) 182<br />
Figure 176: Brazil <strong>Soda</strong> <strong>Ash</strong> <strong>Market</strong> Size, By <strong>Volume</strong>, 2014-2018(Million Tone) 183<br />
Figure 177: Brazil <strong>Soda</strong> <strong>Ash</strong> <strong>Market</strong> Size, By <strong>Volume</strong>, 2019E-2024F ( Million Tone) 183<br />
Figure 178: Brazil <strong>Soda</strong> <strong>Ash</strong> <strong>Market</strong>: By Application, By <strong>Value</strong>, 2014-2024(USD Million) 184<br />
Figure 179: Number of companies registered in the construction sector in Brazil from 2010 to 2016 (in 1,000s) 185<br />
Figure 180:<br />
Leading companies in the chemical and petrochemical industry in Brazil in 2017, based on net revenue (in<br />
billion Brazilian reals)<br />
186<br />
21
List of Figures<br />
Figure No. Figure Title Page No.<br />
Figure 181: Mexico <strong>Soda</strong> <strong>Ash</strong> <strong>Market</strong> Size, By <strong>Value</strong>, 2014-2018(USD Million) 188<br />
Figure 182: Mexico <strong>Soda</strong> <strong>Ash</strong> <strong>Market</strong> Size, By <strong>Value</strong>, 2019E-2024F (USD Million) 188<br />
Figure 183: Mexico <strong>Soda</strong> <strong>Ash</strong> <strong>Market</strong> Size, By <strong>Volume</strong>, 2014-2018(Million Tone) 189<br />
Figure 184: Mexico <strong>Soda</strong> <strong>Ash</strong> <strong>Market</strong> Size, By <strong>Volume</strong>, 2019E-2024F ( Million Tone) 189<br />
Figure 185: Mexico <strong>Soda</strong> <strong>Ash</strong> <strong>Market</strong>: By Application, By <strong>Value</strong>, 2014-2024(USD Million) 190<br />
Figure 186: Others <strong>Soda</strong> <strong>Ash</strong> <strong>Market</strong> Size, By <strong>Value</strong>, 2014-2018(USD Million) 193<br />
Figure 187: Others <strong>Soda</strong> <strong>Ash</strong> <strong>Market</strong> Size, By <strong>Value</strong>, 2019E-2024F (USD Million) 193<br />
Figure 188: Others <strong>Soda</strong> <strong>Ash</strong> <strong>Market</strong> Size, By <strong>Volume</strong>, 2014-2018 (Million Tone) 194<br />
Figure 189: Others <strong>Soda</strong> <strong>Ash</strong> <strong>Market</strong> Size, By <strong>Volume</strong>, 2019E-2024F (Million Tone) 194<br />
Figure 190: Others <strong>Soda</strong> <strong>Ash</strong> <strong>Market</strong>: By Application, By <strong>Value</strong>, 2014-2024(USD Million) 195<br />
Figure 191: Solvay Sales, 2015-2018 (USD Billion) 213<br />
Figure 192: Solvay Sales, By Business Group, 2018 (%) 213<br />
Figure 193: Solvay Sales, By Region, 2018(%) 213<br />
Figure 194: Tata Chemicals Sales, 2016-2018 (USD Billion) 215<br />
Figure 195: Tata Chemicals Sales, By Business Group, 2018 (%) 215<br />
Figure 196: Tata Chemicals Sales, By Region, 2018(%) 215<br />
Figure 197: Ciner Sales, 2016-2018 (USD Million) 217<br />
Figure 198: Ciner Sales, By Region, 2018(%) 217<br />
Figure 199: Ciech Sales, 2016-2018 (USD Million) 222<br />
Figure 200: Ciech Sales, By Region, 2018(%) 222<br />
Figure 201: Ciech Sales, By Segment, 2018(%) 222<br />
22
Research Methodology<br />
For our study on <strong>Soda</strong> <strong>Ash</strong>, we have conducted comprehensive secondary research followed by an<br />
extensive primary research. In the process of secondary research, we have scrutinized industry<br />
documents, accessed from open sources, premium paid databases (Bloomberg, Thomson Reuters,<br />
Factiva) and our internal knowledge base. In the process of primary research, we have interviewed<br />
various industry experts across the value chain of the <strong>Soda</strong> <strong>Ash</strong> industry.<br />
<strong>Market</strong> size of the actual period (2014-2018) has been evaluated on the basis of growth trends of<br />
the industry in the last five years, and confirming the findings through primary research. Annual<br />
reports of the companies are scanned to further validate the market size and to estimate the size<br />
of various other end-user sectors. <strong>Market</strong> sizing and growth in the forecast period (2019-2024) is<br />
estimated through product mapping, application in end-user industries, growth of allied sectors<br />
and historical growth pattern of the industry. All the relevant data points/ statistics in the forecast<br />
period are validated through relevant and reliable primary sources.<br />
Report Focus: <strong>Global</strong> <strong>Soda</strong> <strong>Ash</strong> <strong>Market</strong><br />
- By Product Type - Light, Dense<br />
By Process Type – Natural and Synthetic<br />
By Application- Glass and Ceramics, Soaps and detergents, Chemical, Metallurgical, Others<br />
By Region- APAC , North America, Europe and ROW<br />
By Country - US, Canada, Mexico, France, Germany, China, India, Brazil<br />
- Company Coverage (Tata Chemicals, Solvay, Ciner, Genesis Alkali, NIRMA Limited, Shandong<br />
Haihua, Ciech SA, Tangshan Sanyou Chaemicals, Solvay )<br />
23
<strong>Global</strong> <strong>Soda</strong> <strong>Ash</strong> <strong>Market</strong>, By <strong>Value</strong><br />
North America Heart Valve Devices <strong>Market</strong>, By <strong>Value</strong><br />
Increasing consumption of soda ash by industries like Glass, Chemical been backing the soda ash market<br />
Figure 3: <strong>Global</strong> <strong>Soda</strong> <strong>Ash</strong> <strong>Market</strong>, By <strong>Value</strong>, 2014-2018 (USD Million)<br />
CAGR 2014-2018<br />
xx%<br />
2014 2015 2016 2017 2018<br />
Source: Azoth Analytics Estimates<br />
Xx<br />
Xx<br />
Xx<br />
Xx<br />
Xx<br />
Xx<br />
Xx<br />
24
<strong>Global</strong> <strong>Soda</strong> <strong>Ash</strong> <strong>Market</strong>, By <strong>Value</strong><br />
Rapid economic development in countries such as India and China is expected to drive soda ash market<br />
Figure 4: <strong>Global</strong> <strong>Soda</strong> <strong>Ash</strong> <strong>Market</strong>, By <strong>Value</strong>, Forecast, 2019-2024 (USD Million)<br />
CAGR 2019-2024<br />
xx%<br />
2019 2020 2021 2022 2023 2024<br />
Xx<br />
Source: Azoth Analytics Estimates<br />
Xx<br />
Xx<br />
Xx<br />
Xx<br />
Xx<br />
Xx<br />
25
<strong>Global</strong> <strong>Soda</strong> <strong>Ash</strong> <strong>Market</strong>, By <strong>Volume</strong><br />
North America Heart Valve Devices <strong>Market</strong>, By <strong>Value</strong><br />
Wide application of soda ash backed market growth in the past few years.<br />
Figure 14: <strong>Global</strong> <strong>Soda</strong> <strong>Ash</strong> <strong>Market</strong>, By <strong>Volume</strong>, 2014-2018(Million Tone)<br />
CAGR 2014-2018<br />
xx%<br />
2014 2015 2016 2017 2018<br />
Xx<br />
Source: Azoth Analytics Estimates<br />
Xx<br />
Xx<br />
Xx<br />
Xx<br />
Xx<br />
Xx<br />
26
<strong>Global</strong> <strong>Soda</strong> <strong>Ash</strong> <strong>Market</strong>, By <strong>Volume</strong><br />
Rising demand of <strong>Soda</strong> ash in water treatment and paper making industry would impel the growth of<br />
market in the foreseeable future.<br />
Figure 15: <strong>Global</strong> <strong>Soda</strong> <strong>Ash</strong> <strong>Market</strong>, By <strong>Volume</strong>, Forecast, 2019-2024 (Million Tone)<br />
CAGR 2019-2024<br />
xx%<br />
2019 2020 2021 2022 2023 2024<br />
Xx<br />
Source: Azoth Analytics Estimates<br />
Xx<br />
Xx<br />
Xx<br />
Xx<br />
Xx<br />
Xx<br />
27
<strong>Global</strong> Light <strong>Soda</strong> <strong>Ash</strong> <strong>Market</strong>, By <strong>Value</strong><br />
<strong>Global</strong> Heart Valve Replacement Devices <strong>Market</strong>, By <strong>Value</strong><br />
Figure 18: <strong>Global</strong> Light <strong>Soda</strong> <strong>Ash</strong> <strong>Market</strong>, By <strong>Value</strong>,<br />
2014-2018 (USD Million)<br />
Figure 19: <strong>Global</strong> Light <strong>Soda</strong> <strong>Ash</strong> <strong>Market</strong>, By <strong>Value</strong>,<br />
2019-2024 (USD Million)<br />
CAGR 2014-2018<br />
xx%<br />
CAGR 2019-2024<br />
xx%<br />
2014 2015 2016 2017 2018 2019 2020 2021 2022 2023 2024<br />
Source: Azoth Analytics Estimates<br />
Xx<br />
Xx<br />
Xx<br />
Xx<br />
Xx<br />
Xx<br />
28
<strong>Global</strong> Dense <strong>Soda</strong> <strong>Ash</strong> <strong>Market</strong>, By <strong>Value</strong><br />
<strong>Global</strong> Heart Valve Replacement Devices <strong>Market</strong>, By <strong>Value</strong><br />
Figure 20: <strong>Global</strong> Dense <strong>Soda</strong> <strong>Ash</strong> <strong>Market</strong>, By <strong>Value</strong>,<br />
2014-2018 (USD Million)<br />
Figure 21: <strong>Global</strong> Dense <strong>Soda</strong> <strong>Ash</strong> <strong>Market</strong>, By <strong>Value</strong>,<br />
2019-2024 (USD Million)<br />
CAGR 2014-2018<br />
xx%<br />
CAGR 2019-2024<br />
xx%<br />
2014 2015 2016 2017 2018 2019 2020 2021 2022 2023 2024<br />
Source: Azoth Analytics Estimates<br />
Xx<br />
Xx<br />
Xx<br />
Xx<br />
Xx<br />
Xx<br />
29
<strong>Global</strong> <strong>Soda</strong> <strong>Ash</strong> <strong>Market</strong>, By Natural Process, By <strong>Value</strong><br />
<strong>Global</strong> Heart Valve Replacement Devices <strong>Market</strong>, By <strong>Value</strong><br />
Figure 24: <strong>Global</strong> <strong>Soda</strong> <strong>Ash</strong> <strong>Market</strong>, By Natural Process,<br />
By <strong>Value</strong>, 2014-2018 (USD Million)<br />
Figure 25: <strong>Global</strong> <strong>Soda</strong> <strong>Ash</strong> <strong>Market</strong>, By Natural Process,<br />
By <strong>Value</strong>, 2019-2024 (USD Million)<br />
CAGR 2014-2018<br />
xx%<br />
CAGR 2019-2024<br />
xx%<br />
2014 2015 2016 2017 2018 2019 2020 2021 2022 2023 2024<br />
Source: Azoth Analytics Estimates<br />
Xx<br />
Xx<br />
Xx<br />
Xx<br />
Xx<br />
Xx<br />
30
<strong>Global</strong> Heart <strong>Soda</strong> <strong>Ash</strong> Valve <strong>Market</strong>, Replacement By Synthetic Devices Process, <strong>Market</strong>, By <strong>Value</strong><br />
Figure 26: <strong>Global</strong> <strong>Soda</strong> <strong>Ash</strong> <strong>Market</strong>, By Synthetic<br />
Process, By <strong>Value</strong>, 2014-2018 (USD Million)<br />
Figure 27: <strong>Global</strong> <strong>Soda</strong> <strong>Ash</strong> <strong>Market</strong>, By Synthetic<br />
Process, By <strong>Value</strong>, 2019-2024 (USD Million)<br />
CAGR 2014-2018<br />
xx%<br />
CAGR 2019-2024<br />
xx%<br />
2014 2015 2016 2017 2018 2019 2020 2021 2022 2023 2024<br />
Source: Azoth Analytics Estimates<br />
Xx<br />
Xx<br />
Xx<br />
Xx<br />
Xx<br />
Xx<br />
31
<strong>Global</strong> <strong>Soda</strong> <strong>Ash</strong> <strong>Market</strong>, By Glass, By <strong>Value</strong><br />
<strong>Global</strong> Heart Valve Replacement Devices <strong>Market</strong>, By <strong>Value</strong><br />
Figure 30: <strong>Global</strong> <strong>Soda</strong> <strong>Ash</strong> <strong>Market</strong>, By Glass,By <strong>Value</strong>,<br />
2014-2018 (USD Million)<br />
Figure 31: <strong>Global</strong> <strong>Soda</strong> <strong>Ash</strong> <strong>Market</strong>, By Glass,By <strong>Value</strong>,<br />
Forecast,2019-2024 ( USD Million)<br />
CAGR 2014-2018<br />
xx%<br />
CAGR 2019-2024<br />
xx%<br />
2014 2015 2016 2017 2018 2019 2020 2021 2022 2023 2024<br />
Source: Azoth Analytics Estimates<br />
Xx<br />
Xx<br />
Xx<br />
Xx<br />
Xx<br />
Xx<br />
32
<strong>Global</strong> <strong>Soda</strong> Heart <strong>Ash</strong> Valve <strong>Market</strong>, Replacement By Soaps Devices and Detergents, <strong>Market</strong>, By By <strong>Value</strong><br />
Figure 36: <strong>Global</strong> <strong>Soda</strong> <strong>Ash</strong> <strong>Market</strong>, By Soaps and<br />
Detergents ,By <strong>Value</strong>, 2014-2018 (USD Million)<br />
Figure 37: <strong>Global</strong> <strong>Soda</strong> <strong>Ash</strong> <strong>Market</strong>, By Soaps and<br />
Detergents ,,By <strong>Value</strong>, Forecast,2019-2024 ( USD Million)<br />
CAGR 2014-2018<br />
xx%<br />
CAGR 2019-2024<br />
xx%<br />
2014 2015 2016 2017 2018 2019 2020 2021 2022 2023 2024<br />
Source: Azoth Analytics Estimates<br />
Xx<br />
Xx<br />
Xx<br />
Xx<br />
Xx<br />
Xx<br />
33
<strong>Global</strong> <strong>Soda</strong> <strong>Ash</strong> <strong>Market</strong>, By Chemical, By <strong>Value</strong><br />
<strong>Global</strong> Heart Valve Replacement Devices <strong>Market</strong>, By <strong>Value</strong><br />
Figure 38: <strong>Global</strong> <strong>Soda</strong> <strong>Ash</strong> <strong>Market</strong>, By Chemical , By<br />
<strong>Value</strong>, 2014-2018 (USD Million)<br />
Figure 39: <strong>Global</strong> <strong>Soda</strong> <strong>Ash</strong> <strong>Market</strong>, By Chemical, By<br />
<strong>Value</strong>, Forecast,2019-2024 ( USD Million)<br />
CAGR 2014-2018<br />
xx%<br />
CAGR 2019-2024<br />
xx%<br />
2014 2015 2016 2017 2018 2019 2020 2021 2022 2023 2024<br />
Source: Azoth Analytics Estimates<br />
Xx<br />
Xx<br />
Xx<br />
Xx<br />
Xx<br />
Xx<br />
34
<strong>Global</strong> <strong>Soda</strong> <strong>Ash</strong> <strong>Market</strong>, By Metallurgy , By <strong>Value</strong><br />
<strong>Global</strong> Heart Valve Replacement Devices <strong>Market</strong>, By <strong>Value</strong><br />
Figure 42: <strong>Global</strong> <strong>Soda</strong> <strong>Ash</strong> <strong>Market</strong>, By Metallurgy, By<br />
<strong>Value</strong>, 2014-2018 (USD Million)<br />
Figure 43: <strong>Global</strong> <strong>Soda</strong> <strong>Ash</strong> <strong>Market</strong>, By Metallurgy, By<br />
<strong>Value</strong>, Forecast,2019-2024 ( USD Million)<br />
CAGR 2014-2018<br />
xx%<br />
CAGR 2019-2024<br />
xx%<br />
2014 2015 2016 2017 2018 2019 2020 2021 2022 2023 2024<br />
Source: Azoth Analytics Estimates<br />
Xx<br />
Xx<br />
Xx<br />
Xx<br />
Xx<br />
Xx<br />
35
<strong>Global</strong> <strong>Soda</strong> <strong>Ash</strong> <strong>Market</strong>, By Other Application, By <strong>Value</strong><br />
<strong>Global</strong> Heart Valve Replacement Devices <strong>Market</strong>, By <strong>Value</strong><br />
Figure 44: <strong>Global</strong> <strong>Soda</strong> <strong>Ash</strong> <strong>Market</strong>, By Other<br />
Application,By <strong>Value</strong>, 2014-2018 (USD Million)<br />
Figure 45: <strong>Global</strong> <strong>Soda</strong> <strong>Ash</strong> <strong>Market</strong>, By Other<br />
Application,By <strong>Value</strong>, Forecast,2019-2024 ( USD Million)<br />
CAGR 2014-2018<br />
xx%<br />
CAGR 2019-2024<br />
xx%<br />
2014 2015 2016 2017 2018 2019 2020 2021 2022 2023 2024<br />
Source: Azoth Analytics Estimates<br />
Xx<br />
Xx<br />
Xx<br />
Xx<br />
Xx<br />
Xx<br />
36
North America <strong>Soda</strong> <strong>Ash</strong> <strong>Market</strong>, By <strong>Value</strong><br />
Increasing demand from industries like glass, chemical has been backing the soda ash market in the region.<br />
Figure 51: North America <strong>Soda</strong> <strong>Ash</strong> <strong>Market</strong> Size, By <strong>Value</strong>, 2014-2018 (USD Million)<br />
CAGR 2014-2018<br />
xx%<br />
2014 2015 2016 2017 2018<br />
Source: Azoth Analytics Estimates<br />
Xx<br />
Xx<br />
Xx<br />
Xx<br />
Xx<br />
Xx<br />
Xx<br />
37
North America <strong>Soda</strong> <strong>Ash</strong> <strong>Market</strong>, By <strong>Value</strong><br />
Increasing production activities will support the growth of the market during forecast period.<br />
Figure 52: North America <strong>Soda</strong> <strong>Ash</strong> <strong>Market</strong> Size, By <strong>Value</strong>, Forecast, 2019-2024 (USD Million )<br />
CAGR 2019-2024<br />
xx%<br />
2019 2020 2021 2022 2023 2024<br />
Source: Azoth Analytics Estimates<br />
Xx<br />
Xx<br />
Xx<br />
Xx<br />
Xx<br />
Xx<br />
Xx<br />
38
North America <strong>Soda</strong> <strong>Ash</strong> <strong>Market</strong>, By <strong>Volume</strong><br />
Increasing demand of soda ash for construction material has been propelling the demand of <strong>Soda</strong> <strong>Ash</strong>.<br />
Figure 53: North America <strong>Soda</strong> <strong>Ash</strong> <strong>Market</strong> Size, By <strong>Volume</strong>, 2014-2018(Million Tone)<br />
CAGR 2014-2018<br />
xx%<br />
2014 2015 2016 2017 2018<br />
Source: Azoth Analytics Estimates<br />
Xx<br />
Xx<br />
Xx<br />
Xx<br />
Xx<br />
Xx<br />
Xx<br />
39
North America <strong>Soda</strong> <strong>Ash</strong> <strong>Market</strong>, By <strong>Volume</strong><br />
Increasing demand from glass as well as metallurgy sector is foreseen to support the market.<br />
Figure 54: North America <strong>Soda</strong> <strong>Ash</strong> <strong>Market</strong> Size, By <strong>Volume</strong>, Forecast, 2019-2024(Million Tone)<br />
CAGR 2019-2024<br />
xx%<br />
2019 2020 2021 2022 2023 2024<br />
Xx<br />
Source: Azoth Analytics Estimates<br />
Xx<br />
Xx<br />
Xx<br />
Xx<br />
Xx<br />
Xx<br />
40
North America <strong>Soda</strong> <strong>Ash</strong> <strong>Market</strong>, By Product Type, By <strong>Value</strong><br />
Figure 55: North America <strong>Soda</strong> <strong>Ash</strong> <strong>Market</strong>: By Product Type, By <strong>Value</strong>, 2014-2024(USD Million)<br />
CAGR 2014-2018<br />
Dense: xx%<br />
Light: xx%<br />
CAGR 2019-2024<br />
Dense: xx%<br />
Light: xx%<br />
2014 2015 2016 2017 2018 2019 2020 2021 2022 2023 2024<br />
Dense 614.83 520.15 657.31 654.69 676.89 692.63 708.58 724.75 741.14 757.75 772.79<br />
Light 516.00 620.67 540.74 533.23 545.82 554.68 563.56 572.46 581.38 590.32 601.06<br />
Source: Azoth Analytics Estimates<br />
Xx<br />
Xx<br />
Xx<br />
Xx<br />
Xx<br />
41
Rest of World <strong>Soda</strong> <strong>Ash</strong> <strong>Market</strong>, By Process Type, By <strong>Value</strong><br />
Figure 56: Rest of world <strong>Soda</strong> <strong>Ash</strong> <strong>Market</strong>: By Process Type, By <strong>Value</strong>, 2014-2024(USD Million)<br />
CAGR 2014-2018<br />
Natural: xx%<br />
Synthetic: xx%<br />
CAGR 2019-2024<br />
Natural: xx%<br />
Synthetic : xx%<br />
2014 2015 2016 2017 2018 2019 2020 2021 2022 2023 2024<br />
Natural 742.17 748.60 756.12 736.60 765.79 773.62 781.30 788.83 796.20 803.40 810.44<br />
Synthetic 388.67 392.22 441.93 451.32 456.93 473.68 490.83 508.37 526.32 544.66 563.42<br />
Source: Azoth Analytics Estimates<br />
Xx<br />
Xx<br />
Xx<br />
Xx<br />
42
North America <strong>Soda</strong> <strong>Ash</strong> <strong>Market</strong>, By Application, By <strong>Value</strong><br />
Figure 57: North America <strong>Soda</strong> <strong>Ash</strong> <strong>Market</strong>: By Application, By <strong>Value</strong>, 2014-2024(USD Million)<br />
CAGR 2014-2018<br />
Glass and Ceramics: xx%<br />
Soaps and Detergents: xx%<br />
Chemicals : xx%<br />
Metallurgy : xx%<br />
Others: xx%<br />
CAGR 2019-2024<br />
Glass and Ceramics: xx%<br />
Soaps and Detergents: xx%<br />
Chemicals : xx%<br />
Metallurgy : xx%<br />
Others: %<br />
2014 2015 2016 2017 2018 2019 2020 2021 2022 2023 2024<br />
Glass and Ceramics 511.81 520.44 551.74 551.04 572.09 585.71 599.52 613.53 627.75 642.16 656.78<br />
Soaps and Detergents 75.79 73.82 74.86 71.43 70.75 70.15 69.49 68.76 67.97 67.10 66.17<br />
Chemicals 328.87 327.12 339.17 331.27 336.28 338.58 340.78 342.87 344.84 346.70 348.44<br />
Metallurgy 61.31 62.53 66.48 66.59 69.33 70.99 72.68 74.39 76.12 77.88 79.67<br />
Others 111.18 114.54 122.97 124.34 130.64 137.13 143.80 150.65 157.68 164.90 172.30<br />
Source: Azoth Analytics Estimates<br />
43
United States <strong>Soda</strong> <strong>Ash</strong> <strong>Market</strong> Overview<br />
Figure 63: United States <strong>Soda</strong> <strong>Ash</strong> <strong>Market</strong> Size, By<br />
<strong>Value</strong>, 2014-2018 (USD Million)<br />
Figure 64: United States <strong>Soda</strong> <strong>Ash</strong> <strong>Market</strong> Size, By<br />
<strong>Value</strong>, 2019E-2024F (USD Million)<br />
CAGR 2014-2018<br />
xx%<br />
CAGR 2019-2024<br />
xx%<br />
2014 2015 2016 2017 2018 2019 2020 2021 2022 2023 2024<br />
Source: Azoth Analytics Estimates<br />
Xx<br />
Xx<br />
• .<br />
Xx<br />
Xx<br />
Xx<br />
Xx<br />
44
United States <strong>Soda</strong> <strong>Ash</strong> <strong>Market</strong> Overview<br />
Figure 68: United States <strong>Soda</strong> <strong>Ash</strong> <strong>Market</strong> Size, By<br />
<strong>Volume</strong>, 2014-2018 (Million Ton)<br />
Figure 69: United States <strong>Soda</strong> <strong>Ash</strong> <strong>Market</strong> Size, By<br />
<strong>Value</strong>, 2019E-2024F (Million Ton)<br />
CAGR 2014-2018<br />
xx%<br />
CAGR 2019-2024<br />
xx%<br />
2014 2015 2016 2017 2018 2019 2020 2021 2022 2023 2024<br />
Source: Azoth Analytics Estimates<br />
Xx<br />
Xx<br />
• .<br />
Xx<br />
Xx<br />
Xx<br />
Xx<br />
45
United States <strong>Soda</strong> <strong>Ash</strong> <strong>Market</strong>, By Application, By <strong>Value</strong><br />
Figure 70: United States <strong>Soda</strong> <strong>Ash</strong> <strong>Market</strong>: By Application, By <strong>Value</strong>, 2014-2024(USD Million)<br />
CAGR 2014-2018<br />
Glass and Ceramics: xx%<br />
Soaps and Detergents: xx%<br />
Chemicals : xx%<br />
Metallurgy : xx%<br />
Others: xx%<br />
CAGR 2019-2024<br />
Glass and Ceramics: xx%<br />
Soaps and Detergents: xx%<br />
Chemicals : xx%<br />
Metallurgy : xx%<br />
Others: %<br />
2014 2015 2016 2017 2018 2019 2020 2021 2022 2023 2024<br />
Glass and Ceramics 511.81 520.44 551.74 551.04 572.09 585.71 599.52 613.53 627.75 642.16 656.78<br />
Soaps and Detergents 75.79 73.82 74.86 71.43 70.75 70.15 69.49 68.76 67.97 67.10 66.17<br />
Chemicals 328.87 327.12 339.17 331.27 336.28 338.58 340.78 342.87 344.84 346.70 348.44<br />
Metallurgy 61.31 62.53 66.48 66.59 69.33 70.99 72.68 74.39 76.12 77.88 79.67<br />
Others 111.18 114.54 122.97 124.34 130.64 137.13 143.80 150.65 157.68 164.90 172.30<br />
Source: Azoth Analytics Estimates<br />
46
About Azoth Analytics Pvt Ltd.<br />
Azoth Analytics (ISO 9001:2015) is a business research and analytics company that creates in-depth research reports and provides customized research<br />
solutions and consulting services. An ISO 9001:2015 certified company, Azoth Analytics adheres to international quality management standard and has strong<br />
commitment to a culture of continuous improvement. The business research and market analysis of Azoth Analytics helps organizations across different<br />
industry verticals solve their business problems. Strategic market sizing and data dredging techniques include secondary research, and primary research<br />
(interviews with management personnel and industry experts). Azoth Analytics provide syndicated and customized market research reports on different<br />
verticals including pharmaceutical and healthcare, oil and gas and power, chemicals, automotive, technology, FMCG, food & beverages and media sectors.<br />
47


