Industrial Automation Software Market Size, 2023
The food and beverages segment is expected to generate revenue of $XX in 2018 and is expected to reach $XX billion by 2023, growing at a CAGR of XX% during the forecast period 2018-2023. The food and beverages industry has been an early adopter of industrial automation.
The food and beverages segment is expected to generate revenue of $XX in 2018 and is expected to reach $XX billion by 2023, growing at a CAGR of XX% during the forecast period 2018-2023. The food and beverages industry has been an early adopter of industrial automation.
Create successful ePaper yourself
Turn your PDF publications into a flip-book with our unique Google optimized e-Paper software.
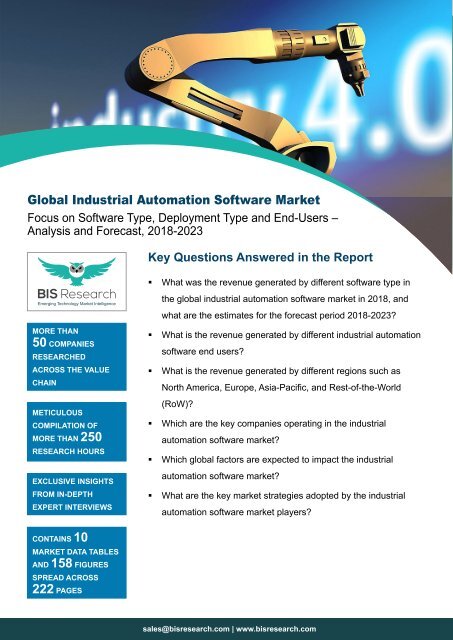
Global <strong>Industrial</strong> <strong>Automation</strong> <strong>Software</strong> <strong>Market</strong><br />
Focus on <strong>Software</strong> Type, Deployment Type and End-Users –<br />
Analysis and Forecast, 2018-<strong>2023</strong><br />
Key Questions Answered in the Report<br />
• What was the revenue generated by different software type in<br />
the global industrial automation software market in 2018, and<br />
what are the estimates for the forecast period 2018-<strong>2023</strong>?<br />
MORE THAN<br />
50 COMPANIES<br />
RESEARCHED<br />
ACROSS THE VALUE<br />
CHAIN<br />
METICULOUS<br />
COMPILATION OF<br />
MORE THAN 250<br />
RESEARCH HOURS<br />
EXCLUSIVE INSIGHTS<br />
FROM IN-DEPTH<br />
EXPERT INTERVIEWS<br />
• What is the revenue generated by different industrial automation<br />
software end users?<br />
• What is the revenue generated by different regions such as<br />
North America, Europe, Asia-Pacific, and Rest-of-the-World<br />
(RoW)?<br />
• Which are the key companies operating in the industrial<br />
automation software market?<br />
• Which global factors are expected to impact the industrial<br />
automation software market?<br />
• What are the key market strategies adopted by the industrial<br />
automation software market players?<br />
CONTAINS 10<br />
MARKET DATA TABLES<br />
AND 158 FIGURES<br />
SPREAD ACROSS<br />
222 PAGES<br />
sales@bisresearch.com | www.bisresearch.com
Table of Contents<br />
MARKET DYNAMICS<br />
COMPETITIVE INSIGHTS<br />
INDUSTRY ANALYSIS<br />
GLOBAL INDUSTRIAL AUTOMATION<br />
SOFTWARE MARKET<br />
GLOBAL INDUSTRIAL AUTOMATION<br />
SOFTWARE MARKET<br />
(BY SOFTWARE TYPE)<br />
GLOBAL INDUSTRIAL AUTOMATION<br />
SOFTWARE MARKET<br />
(BY DEPLOYMENT TYPE)<br />
GLOBAL INDUSTRIAL AUTOMATION<br />
SOFTWARE MARKET<br />
(BY END USER)<br />
GLOBAL INDUSTRIAL AUTOMATION<br />
SOFTWARE MARKET (BY REGION)<br />
• Overview<br />
• <strong>Market</strong> Drivers<br />
• <strong>Market</strong> Challenges<br />
• <strong>Market</strong> Opportunities<br />
• <strong>Market</strong> Dynamics: Impact Analysis<br />
• Key Developments and Strategies<br />
• <strong>Market</strong> Share Analysis<br />
• Industry Overview<br />
• Product Assortment of Major Companies<br />
• R&D Analysis of Leading Players<br />
• Value Chain Analysis<br />
• Industry Attractiveness<br />
• Assumption and Limitations<br />
• <strong>Market</strong> Overview<br />
• <strong>Market</strong> Overview<br />
• Planning and Designing Management<br />
• Operation Management<br />
• Maintenance and Monitoring<br />
Management<br />
• Training Management<br />
• <strong>Market</strong> Overview<br />
• On-Premises<br />
• Cloud<br />
• <strong>Market</strong> Overview<br />
• Food and Beverages<br />
• Pharmaceuticals<br />
• Automotive<br />
• FMCG<br />
• Oil and Gas<br />
• Metal and Machining<br />
• Others<br />
• <strong>Market</strong> Overview<br />
• North America<br />
• Europe<br />
• Asia-Pacific<br />
• Rest-of-the-World<br />
COMPANY PROFILES<br />
• ABB Ltd<br />
• Aegis <strong>Industrial</strong><br />
<strong>Software</strong> Corporation<br />
• CANNON-Automata<br />
• Dassault Systèmes<br />
• Emerson Electric CO.<br />
• General Electric<br />
• Honeywell International<br />
Inc<br />
• IBM Corporation<br />
• OMRON Corporation<br />
• Mitsubishi Electric<br />
Corporation<br />
• Parsec <strong>Automation</strong><br />
Corp.<br />
• Rockwell <strong>Automation</strong><br />
Inc.<br />
• Schneider Electric<br />
• Siemens AG<br />
• Werum IT Solutions<br />
• Other Key Players<br />
• Aquarius <strong>Software</strong><br />
• Hexagon AB<br />
• InSource Solutions<br />
• Litmus <strong>Automation</strong><br />
• Progea<br />
International SA<br />
• List of Emerging<br />
Companies<br />
REPORT SCOPE AND<br />
METHODOLOGY<br />
• Report Scope<br />
• Global <strong>Industrial</strong><br />
<strong>Automation</strong> <strong>Software</strong><br />
<strong>Market</strong> Research<br />
Methodology<br />
APPENDIX<br />
• Related Reports<br />
VIEW COMPLETE TABLE OF CONTENT<br />
sales@bisresearch.com | www.bisresearch.com
List of Tables<br />
1. <strong>Market</strong> Dynamics: Impact Analysis<br />
2. Product Offerings by Leading <strong>Industrial</strong> <strong>Automation</strong> <strong>Software</strong> Companies<br />
3. R&D Activities by Leading Companies<br />
4. Global <strong>Industrial</strong> <strong>Automation</strong> <strong>Software</strong> (by <strong>Software</strong> Type), $Billion, 2017-<strong>2023</strong><br />
5. Planning and Designing Management <strong>Industrial</strong> <strong>Automation</strong> <strong>Software</strong> <strong>Market</strong>, $Billion, 2017-<strong>2023</strong><br />
6. Operation Management <strong>Industrial</strong> <strong>Automation</strong> <strong>Software</strong> <strong>Market</strong>, $Billion, 2017-<strong>2023</strong><br />
7. Global <strong>Industrial</strong> <strong>Automation</strong> <strong>Software</strong> <strong>Market</strong> (by Maintenance and Monitoring Management),<br />
$Billion, 2017-<strong>2023</strong><br />
8. Global <strong>Industrial</strong> <strong>Automation</strong> <strong>Software</strong> <strong>Market</strong> (by Deployment Type), $Billion, 2017-<strong>2023</strong><br />
9. Global <strong>Industrial</strong> <strong>Automation</strong> <strong>Software</strong> <strong>Market</strong> (by End User), $Billion, 2017-<strong>2023</strong><br />
10. Global <strong>Industrial</strong> <strong>Automation</strong> <strong>Software</strong> <strong>Market</strong> (by Region), $Billion, 2017-<strong>2023</strong><br />
sales@bisresearch.com | www.bisresearch.com
List of Figures<br />
1. Estimated Worldwide Supply of <strong>Industrial</strong> Robots,<br />
2009-2021<br />
2. Leading Factors Affecting the Global <strong>Industrial</strong><br />
<strong>Automation</strong> <strong>Software</strong> <strong>Market</strong><br />
3. Global <strong>Industrial</strong> <strong>Automation</strong> <strong>Software</strong> <strong>Market</strong><br />
(by Value), 2017-<strong>2023</strong><br />
4. Global <strong>Industrial</strong> <strong>Automation</strong> <strong>Software</strong><br />
(by <strong>Software</strong> Type)<br />
5. Global <strong>Industrial</strong> <strong>Automation</strong> <strong>Software</strong> <strong>Market</strong><br />
(by <strong>Software</strong> Type), 2017-<strong>2023</strong><br />
6. Global <strong>Industrial</strong> <strong>Automation</strong> <strong>Software</strong> <strong>Market</strong><br />
(by Deployment Type), 2017-<strong>2023</strong><br />
7. Global <strong>Industrial</strong> <strong>Automation</strong> <strong>Software</strong> <strong>Market</strong><br />
(by End User), 2017and <strong>2023</strong><br />
8. Global <strong>Industrial</strong> <strong>Automation</strong> <strong>Software</strong> <strong>Market</strong><br />
(by Region), $Billion, <strong>2023</strong><br />
9. <strong>Market</strong> Dynamics<br />
10. <strong>Industrial</strong> IoT Opportunity<br />
11. Challenges of Industry 4.0 and <strong>Industrial</strong> IoT.<br />
12. Estimated Worldwide Supply of <strong>Industrial</strong> Robots<br />
by Region.<br />
13. Some of the Organic and Inorganic Growth<br />
Strategies Adopted by the Key Players<br />
14. Percentage Share of Strategies Adopted by the<br />
<strong>Market</strong> Players, January 2016-March 2019<br />
15. Number of Strategic Developments by Leading<br />
Companies in the Global <strong>Industrial</strong> <strong>Automation</strong><br />
<strong>Software</strong> <strong>Market</strong>, 2016-2018<br />
16. Product Launches and Developments, by<br />
Companies, January 2016- February 2019<br />
17. Partnerships/Collaborations/Joint Ventures,<br />
by Companies, January 2016- February 2019<br />
18. Mergers and Acquisitions, by Companies,<br />
January 2016- February 2019<br />
19. Global <strong>Industrial</strong> <strong>Automation</strong> <strong>Software</strong> <strong>Market</strong>:<br />
<strong>Market</strong> Share Analysis, 2018<br />
20. Timeline in the field of <strong>Automation</strong><br />
21. R&D Analysis of Top Leading Players<br />
22. Value Chain Analysis: <strong>Industrial</strong> <strong>Automation</strong><br />
<strong>Software</strong> <strong>Market</strong><br />
23. <strong>Industrial</strong> <strong>Automation</strong> <strong>Software</strong>: Porter’s Five<br />
Forces<br />
24. Bargaining Power of Suppliers<br />
25. Bargaining Power of Buyers<br />
26. Threat of New Entrants<br />
27. Intensity of Competitive Rivalry<br />
28. Global <strong>Industrial</strong> <strong>Automation</strong> <strong>Software</strong> <strong>Market</strong> (by<br />
Value), 2017-<strong>2023</strong><br />
29. Global <strong>Industrial</strong> <strong>Automation</strong> <strong>Software</strong> <strong>Market</strong> (by<br />
<strong>Software</strong> Type)<br />
30. Global <strong>Industrial</strong> <strong>Automation</strong> <strong>Software</strong> <strong>Market</strong> (by<br />
<strong>Software</strong> Type), $Billion, 2017-<strong>2023</strong><br />
31. Global <strong>Industrial</strong> <strong>Automation</strong> <strong>Software</strong> <strong>Market</strong> (by<br />
Planning and Designing Management), $Billion,<br />
2017-<strong>2023</strong><br />
32. Global <strong>Industrial</strong> <strong>Automation</strong> <strong>Software</strong> <strong>Market</strong> (by<br />
Engineering and Designing <strong>Software</strong>), $Billion,<br />
2017-<strong>2023</strong><br />
33. Global <strong>Industrial</strong> <strong>Automation</strong> <strong>Software</strong> <strong>Market</strong><br />
(by Planning and Scheduling <strong>Software</strong>), $Billion,<br />
2017-<strong>2023</strong><br />
34. Global <strong>Industrial</strong> <strong>Automation</strong> <strong>Software</strong> <strong>Market</strong> (by<br />
Simulation <strong>Software</strong>), $Billion, 2017-<strong>2023</strong><br />
35. Global <strong>Industrial</strong> <strong>Automation</strong> <strong>Software</strong> <strong>Market</strong> (by<br />
Operation Management), $Billion, 2017-<strong>2023</strong><br />
36. Global <strong>Industrial</strong> <strong>Automation</strong> <strong>Software</strong> <strong>Market</strong> (by<br />
SCADA), $Billion, 2017-<strong>2023</strong><br />
37. Global <strong>Industrial</strong> <strong>Automation</strong> <strong>Software</strong> <strong>Market</strong> (by<br />
Process and Production Optimization <strong>Software</strong>),<br />
$Billion, 2017-<strong>2023</strong><br />
38. Global <strong>Industrial</strong> <strong>Automation</strong> <strong>Software</strong> <strong>Market</strong><br />
(by Visualization and Reporting Management),<br />
$Billion, 2017-<strong>2023</strong><br />
39. Global <strong>Industrial</strong> <strong>Automation</strong> <strong>Software</strong> <strong>Market</strong> (by<br />
Incident Management), $Billion, 2017-<strong>2023</strong><br />
40. Global <strong>Industrial</strong> <strong>Automation</strong> <strong>Software</strong> <strong>Market</strong> (by<br />
Manufacturing Operation Management), $Billion,<br />
2017-<strong>2023</strong><br />
41. Global <strong>Industrial</strong> <strong>Automation</strong> <strong>Software</strong> <strong>Market</strong><br />
(by Maintenance and Monitoring Management),<br />
$Billion, 2017-<strong>2023</strong><br />
42. Global <strong>Industrial</strong> <strong>Automation</strong> <strong>Software</strong> <strong>Market</strong><br />
(by Intelligence and Analytics <strong>Software</strong>), $Billion,<br />
2017-<strong>2023</strong><br />
43. Global <strong>Industrial</strong> <strong>Automation</strong> <strong>Software</strong> <strong>Market</strong> (by<br />
Asset and Workforce Management <strong>Software</strong>),<br />
$Billion, 2017-<strong>2023</strong><br />
44. Global <strong>Industrial</strong> <strong>Automation</strong> <strong>Software</strong> <strong>Market</strong> (by<br />
Energy Management <strong>Software</strong>), $Billion, 2017-<br />
<strong>2023</strong><br />
45. Global <strong>Industrial</strong> <strong>Automation</strong> <strong>Software</strong> <strong>Market</strong> (by<br />
Monitoring Management <strong>Software</strong>), $Billion, 2017-<br />
<strong>2023</strong><br />
46. Global <strong>Industrial</strong> <strong>Automation</strong> <strong>Software</strong> <strong>Market</strong> (by<br />
Training Management), $Billion, 2017-<strong>2023</strong><br />
sales@bisresearch.com | www.bisresearch.com
List of Figures<br />
47. Global <strong>Industrial</strong> <strong>Automation</strong> <strong>Software</strong> <strong>Market</strong><br />
(by Deployment Type)<br />
48. Global <strong>Industrial</strong> <strong>Automation</strong> <strong>Software</strong> <strong>Market</strong><br />
(by Deployment Type), <strong>Market</strong> Share 2018 and<br />
<strong>2023</strong><br />
49. Global <strong>Industrial</strong> <strong>Automation</strong> <strong>Software</strong> <strong>Market</strong><br />
(by On-Premises), $Billion, 2017-<strong>2023</strong><br />
50. Global <strong>Industrial</strong> <strong>Automation</strong> <strong>Software</strong> <strong>Market</strong><br />
(by Cloud), $Billion, 2017-<strong>2023</strong><br />
51. Global <strong>Industrial</strong> <strong>Automation</strong> <strong>Software</strong> <strong>Market</strong><br />
(by End user)<br />
52. Global <strong>Industrial</strong> <strong>Automation</strong> <strong>Software</strong> <strong>Market</strong><br />
(by Food and Beverages), $Billion, 2017-<strong>2023</strong><br />
53. Global <strong>Industrial</strong> <strong>Automation</strong> <strong>Software</strong> <strong>Market</strong><br />
(by Pharmaceuticals), $Billion, 2017-<strong>2023</strong><br />
54. Global <strong>Industrial</strong> <strong>Automation</strong> <strong>Software</strong> <strong>Market</strong><br />
(by Automotive), $Billion, 2017-<strong>2023</strong><br />
55. Global <strong>Industrial</strong> <strong>Automation</strong> <strong>Software</strong> <strong>Market</strong><br />
(by FMCG), $Billion, 2017-<strong>2023</strong><br />
56. Global <strong>Industrial</strong> <strong>Automation</strong> <strong>Software</strong> <strong>Market</strong><br />
(by Oil and Gas), $Billion, 2017-<strong>2023</strong><br />
57. Global <strong>Industrial</strong> <strong>Automation</strong> <strong>Software</strong> <strong>Market</strong><br />
(by Metal and Machining), $Billion, 2017-<strong>2023</strong><br />
58. Global <strong>Industrial</strong> <strong>Automation</strong> <strong>Software</strong> <strong>Market</strong><br />
(by Others), $Billion, 2017-<strong>2023</strong><br />
59. Classification of Global <strong>Industrial</strong> <strong>Automation</strong><br />
<strong>Software</strong> <strong>Market</strong> (by Region)<br />
60. North America <strong>Industrial</strong> <strong>Automation</strong> <strong>Software</strong><br />
<strong>Market</strong>, $Billion, 2017-<strong>2023</strong><br />
61. The U.S <strong>Industrial</strong> <strong>Automation</strong> <strong>Software</strong> <strong>Market</strong>,<br />
$Billion, 2017-<strong>2023</strong><br />
62. Canada <strong>Industrial</strong> <strong>Automation</strong> <strong>Software</strong> <strong>Market</strong>,<br />
$Billion, 2017-<strong>2023</strong><br />
63. Europe <strong>Industrial</strong> <strong>Automation</strong> <strong>Software</strong> <strong>Market</strong>,<br />
$Billion, 2017-<strong>2023</strong><br />
64. The U.K. <strong>Industrial</strong> <strong>Automation</strong> <strong>Software</strong> <strong>Market</strong>,<br />
$Billion, 2017-<strong>2023</strong><br />
65. Germany <strong>Industrial</strong> <strong>Automation</strong> <strong>Software</strong> <strong>Market</strong>,<br />
$Billion, 2017-<strong>2023</strong><br />
66. France <strong>Industrial</strong> <strong>Automation</strong> <strong>Software</strong> <strong>Market</strong>,<br />
$Billion, 2017-<strong>2023</strong><br />
67. Spain <strong>Industrial</strong> <strong>Automation</strong> <strong>Software</strong> <strong>Market</strong>,<br />
$Billion, 2017-<strong>2023</strong><br />
68. Italy <strong>Industrial</strong> <strong>Automation</strong> <strong>Software</strong> <strong>Market</strong>,<br />
$Billion, 2017-<strong>2023</strong><br />
69. Rest-of-Europe <strong>Industrial</strong> <strong>Automation</strong> <strong>Software</strong><br />
<strong>Market</strong>, $Billion, 2017-<strong>2023</strong><br />
70. Asia-Pacific <strong>Industrial</strong> <strong>Automation</strong> <strong>Software</strong><br />
<strong>Market</strong>, $Billion, 2017-<strong>2023</strong><br />
71. China <strong>Industrial</strong> <strong>Automation</strong> <strong>Software</strong> <strong>Market</strong>,<br />
$Billion, 2017-<strong>2023</strong><br />
72. India <strong>Industrial</strong> <strong>Automation</strong> <strong>Software</strong> <strong>Market</strong>,<br />
$Billion, 2017-<strong>2023</strong><br />
73. Japan <strong>Industrial</strong> <strong>Automation</strong> <strong>Software</strong> <strong>Market</strong>,<br />
$Billion, 2017-<strong>2023</strong><br />
74. South Korea <strong>Industrial</strong> <strong>Automation</strong> <strong>Software</strong><br />
<strong>Market</strong>, $Billion, 2017-<strong>2023</strong><br />
75. Rest-of-Asia-Pacific <strong>Industrial</strong> <strong>Automation</strong><br />
<strong>Software</strong> <strong>Market</strong>, $Billion, 2017-<strong>2023</strong><br />
76. Rest-of-the-World <strong>Industrial</strong> <strong>Automation</strong><br />
<strong>Software</strong> <strong>Market</strong>, $Billion, 2017-<strong>2023</strong><br />
77. Middle East <strong>Industrial</strong> <strong>Automation</strong> <strong>Software</strong><br />
<strong>Market</strong>, $Billion, 2017-<strong>2023</strong><br />
78. Latin America <strong>Industrial</strong> <strong>Automation</strong> <strong>Software</strong><br />
<strong>Market</strong>, $Billion, 2017-<strong>2023</strong><br />
79. Africa <strong>Industrial</strong> <strong>Automation</strong> <strong>Software</strong> <strong>Market</strong>,<br />
$Billion, 2017-<strong>2023</strong><br />
80. Share of Key Players<br />
81. ABB Ltd -- Product Portfolio<br />
82. ABB Ltd -- Overall Financials, 2015-2017<br />
83. ABB Ltd -- Business Revenue Mix, 2015-2017<br />
84. ABB Ltd -- Region Revenue Mix, 2015-2017<br />
85. ABB Ltd -- R&D Expenditure, 2015-2017<br />
86. SWOT Analysis – ABB Ltd<br />
87. Aegis <strong>Industrial</strong> <strong>Software</strong> Corporation --<br />
Product Portfolio<br />
88. SWOT Analysis -- Aegis <strong>Industrial</strong> <strong>Software</strong><br />
Corporation:<br />
89. CANNON-Automata -- Product Portfolio<br />
90. SWOT Analysis -- CANNON-Automata<br />
91. Dassault Systèmes -- Product Offerings<br />
92. Dassault Systèmes -- Overall Financials,<br />
2015-2017<br />
93. Dassault Systèmes -- Business Revenue,<br />
2015-2017<br />
94. Dassault Systèmes -- Region Revenue Mix,<br />
2015-2017<br />
95. Dassault Systèmes -- R&D Expenditure,<br />
2015-2017<br />
96. SWOT Analysis -- Dassault Systèmes<br />
97. Emerson Electric CO -- Product Portfolio<br />
98. Emerson Electric CO -- Overall Financials,<br />
2016-2018<br />
99. Emerson Electric CO -- Business Revenue Mix,<br />
sales@bisresearch.com | www.bisresearch.com
List of Figures<br />
2016-2018<br />
100. Emerson Electric CO -- Region Revenue Mix,<br />
2016-2018<br />
101. Emerson Electric CO -- R&D Expenditure,<br />
2016-2018<br />
102. SWOT Analysis -- Emerson Electric CO.<br />
103. General Electric.: Product Portfolio<br />
104. General Electric -- Overall Financials, 2015-2017<br />
105. General Electric -- Business Revenue Mix,<br />
2015-2017<br />
106. General Electric -- Region Revenue Mix,<br />
2015-2017<br />
107. General Electric -- R&D Expenditure, 2015-2017<br />
108. SWOT Analysis -- General Electric<br />
109. Honeywell International – Product Offerings<br />
110. Honeywell International -- Overall Financials,<br />
2016-2018<br />
111. Honeywell International: Business Revenue Mix,<br />
2016-2018<br />
112. Honeywell International -- Region Revenue Mix,<br />
2016-2018<br />
113. Honeywell International -- R&D Expenditure,<br />
2016-2018<br />
114. SWOT Analysis -- Honeywell International<br />
115. IBM Corporation -- Product Offerings<br />
116. IBM Corporation -- Overall Financials, 2015-2017<br />
117. IBM Corporation -- Business Revenue Mix,<br />
2015-2017<br />
118. IBM Corporation -- Region Revenue Mix,<br />
2015-2017<br />
119. IBM Corporation -- R&D Expenditure, 2015-2017<br />
120. SWOT Analysis -- IBM Corporation<br />
121. OMRON Corporation -- Product Offerings<br />
122. OMRON Corporation – Overall Financials,<br />
2015-2017<br />
123. OMRON Corporation – Business Revenue Mix,<br />
2015 -- 2017<br />
124. OMRON Corporation – Region Revenue Mix,<br />
2015-2017<br />
125. OMRON Corporation -- R&D Expenditure,<br />
2015-2017<br />
126. SWOT Analysis -- OMRON Corporation<br />
127. Mitsubishi Electric Corporation -- Product<br />
Offerings<br />
128. Mitsubishi Electric Corporation – Overall<br />
Financials, 2015-2017<br />
129. Mitsubishi Electric Corporation – Business<br />
Revenue Mix, 2015 -- 2017<br />
130. Mitsubishi Electric Corporation – Region Revenue<br />
Mix, 2015-2017<br />
131. Mitsubishi Electric Corporation– Research and<br />
Development Expenditure, 2015-2017<br />
132. SWOT Analysis -- Mitsubishi Electric Corporation<br />
133. Parsec <strong>Automation</strong> Corp -- Product Offering<br />
134. SWOT Analysis -- Parsec <strong>Automation</strong> Corp<br />
135. Rockwell <strong>Automation</strong> Inc -- Product Portfolio<br />
136. Rockwell <strong>Automation</strong> Inc -- Overall Financials,<br />
2016-2018<br />
137. Rockwell <strong>Automation</strong> Inc. -- Business Revenue<br />
Mix, 2016-2018<br />
138. Rockwell <strong>Automation</strong> Inc --– Region Revenue Mix,<br />
2016-2018<br />
139. Rockwell <strong>Automation</strong> Inc -- R&D Expenditure,<br />
2016-2018<br />
140. SWOT Analysis -- Rockwell <strong>Automation</strong> Inc<br />
141. Product Portfolio<br />
142. Schneider Electric -- Overall Financials,<br />
2015-2017<br />
143. Schneider Electric -- Business Revenue Mix,<br />
2015-2017<br />
144. Schneider Electric -- Region Revenue Mix,<br />
2015-2017<br />
145. SWOT Analysis -- Schneider Electric<br />
146. Siemens AG – Product Offerings<br />
147. Siemens AG -- Overall Financials, 2016-2018<br />
148. Siemens AG -- Business Revenue Mix, 2016-2018<br />
149. Siemens AG -- Region Revenue Mix, 2016-2018<br />
150. Siemens AG -- R&D Expenditure, 2016-2018<br />
151. SWOT Analysis -- Siemens AG<br />
152. Werum IT Solutions -- Product Portfolio<br />
153. SWOT Analysis -- Werum IT Solutions.<br />
154. Global <strong>Industrial</strong> <strong>Automation</strong> <strong>Software</strong> <strong>Market</strong><br />
Segmentation<br />
155. Secondary Data Source<br />
156. <strong>Industrial</strong> <strong>Automation</strong> <strong>Software</strong> <strong>Market</strong> Bottom-up<br />
and Top-down<br />
157. <strong>Industrial</strong> <strong>Automation</strong> <strong>Software</strong> <strong>Market</strong> Influencing<br />
Factors<br />
158. Assumptions and Limitations<br />
sales@bisresearch.com | www.bisresearch.com
Research Scope & BIS Methodology<br />
1. Scope of the Report<br />
This report is intended to be a comprehensive study of the global industrial automation software market. It focuses largely<br />
on providing market information for different automation software, covering different segments including software type,<br />
deployment type, end user, and region. Further, the report considers “2018-<strong>2023</strong>” as the forecast period for estimating<br />
the market in the different sections.<br />
1.2 Global <strong>Industrial</strong> <strong>Automation</strong> <strong>Software</strong> <strong>Market</strong> Research<br />
Methodology<br />
The research methodology design adopted for this specific study includes a mix of data collected from primary and<br />
secondary sources. Both primary sources (in-house experts, industry leaders, and market players) and secondary<br />
sources (a host of paid and unpaid databases) along with analytical tools are exhaustively used to build forecast and<br />
predictive models.<br />
Primary Data Sources<br />
The primary sources involve the industry experts from the automation industry, including the suppliers, device<br />
manufacturers, and distributors, among others. Primary resources such as CEOs, vice presidents, marketing directors,<br />
and technology and innovation directors have been interviewed to obtain and verify both qualitative and quantitative<br />
aspects of this research study.<br />
The primary research also includes interviews with participants throughout the value chain. Besides this, online surveys<br />
of the participants were conducted to understand the demand from original equipment manufacturers (OEMs) and other<br />
stakeholders in the market. An extensive questionnaire was shared to get insights from the experts who didn’t participate<br />
in discussions. For some cases in which the information was not available, the Delphi method has been used to arrive<br />
at mutual consent with BIS consultants.<br />
sales@bisresearch.com | www.bisresearch.com
Research Scope & BIS Methodology<br />
Figure 1: Research Methodology<br />
Scope Definition<br />
Research Design<br />
<strong>Market</strong> Study<br />
Qualitative<br />
Quantitative<br />
Primary Interviews/<br />
Secondary Research<br />
Top Down and<br />
Bottom Up<br />
Primary &<br />
Secondary Data<br />
Report<br />
Writing<br />
Data Validation<br />
Data Analysis<br />
Data Collection<br />
The Key Data Points Taken From Primary Sources Include:<br />
• Validation and triangulation of all the numbers and graphs<br />
• Validation of reports segmentation and key qualitative findings<br />
• Understanding the competitive landscape<br />
• Current and proposed production values of a particular product by market players<br />
• Validation of the numbers of the various markets for market type<br />
• Percentage split of individual markets for geographical analysis<br />
sales@bisresearch.com | www.bisresearch.com
Research Scope & BIS Methodology<br />
Secondary Data Sources<br />
The research study involves the usage of extensive secondary sources such as databases, company websites, and<br />
annual reports, among others.<br />
The key data points taken from secondary sources include:<br />
• Segmentation breakups, split-ups, and percentage shares<br />
• Data for market value<br />
• Key industry trends of the top players of the market<br />
• Qualitative insights into various aspects of the market, key trends, and emerging areas of innovation<br />
• Quantitative data for mathematical and statistical calculations<br />
Data Triangulation:<br />
This research study involves the usage of extensive secondary sources, directories, company websites, and annual<br />
reports. It also makes use of databases such as Hoovers, Bloomberg, Business-Week, Factiva, and One-Source to<br />
collect useful and effective information for an extensive, technical, market-oriented, and commercial study of the global<br />
industrial automation software market.<br />
The process of market engineering involves the calculation of the market statistics, market size estimation, market<br />
forecast, market crackdown, and data triangulation (the methodology for these quantitative data processes is explained<br />
in the further sections). An extensive primary research study has been undertaken to gather the information and<br />
authenticate the critical numbers derived through segmentation types, industry trends, and the key players of each type<br />
of products in the market.<br />
sales@bisresearch.com | www.bisresearch.com
Research Scope & BIS Methodology<br />
Figure 4: Data Triangulation<br />
The following figure exhibits the key secondary data sources considered:<br />
BIS Research Internal Repository<br />
• Key players<br />
• Opportunities/Challenges<br />
• <strong>Market</strong> size and market share<br />
• Driving factors<br />
• <strong>Market</strong> estimates<br />
• Geographical analysis<br />
Bis Research<br />
Internal Repository<br />
Primary Sources<br />
DATA<br />
TRIANGULATION<br />
Secondary Sources<br />
Primary Sources<br />
Secondary Sources<br />
INTERVIEWS WITH:<br />
• Top management of companies such as<br />
presidents, vice-presidents, marketing<br />
directors, sales managers and other key<br />
opinion leaders<br />
• Leading industrial automation software<br />
providers across the globe<br />
• Technology analysts<br />
• End users<br />
• Annual reports<br />
• SEC filings<br />
• Investor presentations<br />
• News articles<br />
• Journals<br />
• Paid databases<br />
• IFR<br />
REQUEST FOR SAMPLE<br />
sales@bisresearch.com | www.bisresearch.com
BIS Research<br />
39111 Paseo Padre PKWY STE 313,<br />
Fremont CA 94538-1686,<br />
Tel: +1-510-404-8135<br />
Global Delivery Centre<br />
Tapasya Corp Heights, Subarea,<br />
Sector 126, Noida, NCR-201303 India<br />
Tel: +91 120 4261540 / +91 120 4261544<br />
To know more about us, please visit our website:<br />
bisresearch.com<br />
For other queries contact:<br />
sales@bisresearch.com<br />
sales@bisresearch.com | | www.bisresearch.com<br />
www.bisresearch.com


