WADI Sustainability
Sustainable Architecture Research Studio
Sustainable Architecture Research Studio
- No tags were found...

Create successful ePaper yourself
Turn your PDF publications into a flip-book with our unique Google optimized e-Paper software.
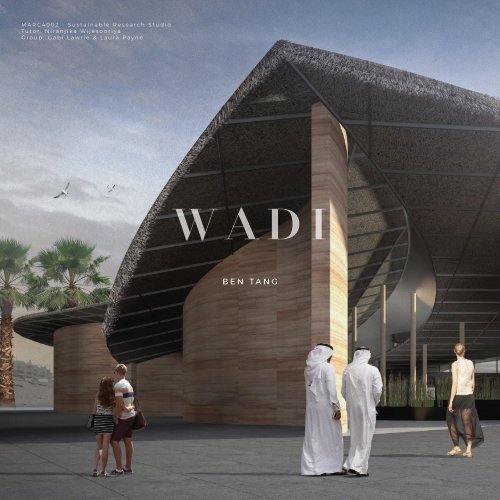
MARC4002 - Sustainable Research Studio<br />
Tutor: Niranjika Wijesooriya<br />
Group: Gabi Lawrie & Laura Payne<br />
<strong>WADI</strong><br />
BEN TANG<br />
MARC4002 Sustainable Architecture Research Studio<br />
1
<strong>Sustainability</strong>, for us, is the idea that humanity should<br />
not merely be a burden on the earth but should also give<br />
something back. The pinnacle of human progress over it’s<br />
surroundings is not an ideal of comfort and convenience, but<br />
rather a pragmatic goal: balancing the needs of humans and<br />
the needs of nature more equally, and fostering a way of life<br />
that is environmentally conscious and connected to nature.<br />
Currently, Australian minimum standards of efficient<br />
heating and cooling energy are worse than both Europe and<br />
America by 40%. More efficient in heating and cooling energy<br />
“Pioneering” Australian sustainability measures are not at all<br />
impressive when compared to the rest of the world.<br />
However, something may be gained from looking at the past.<br />
Australia is the oldest landmass on earth, our native flora<br />
and fauna some of the most unique. In addition, Indigenous<br />
Australian notions of place, land and community in relation to<br />
the human experience are of particular interest and relevancy<br />
today; considering them as an example of living connected<br />
with and in care of nature. These are the elements of<br />
Australian culture that we want to display through the design<br />
of our pavilion.<br />
MARC4002<br />
Sustainable Architecture Research Studio<br />
Tutor: Niranjika Wijesooriya<br />
Semester One 2019<br />
Collaboration: Gabi Lawrie, Laura Payne
CONTENT<br />
02 - Introduction<br />
03 - Contents<br />
04 - Site<br />
05 - Site Analysis<br />
06 - Inspiration<br />
07 - Process<br />
08 - Form Finding<br />
12 - Success Matrix<br />
14 - Water<br />
16 - Materials<br />
18 - Comfort<br />
20 - Biophilia<br />
22 - Environmental Impact<br />
24 - <strong>WADI</strong> - Valley of Wetlands<br />
26 - Entry<br />
27 - Auditorium<br />
28 - Roof Plan<br />
29 - Ground Plan<br />
30 - Lower Ground Plan<br />
31 - Construction Detail<br />
32 - East & West Elevation<br />
33 - Section A and B<br />
34 - North & South Elevation<br />
35 - Section C and D<br />
36 - Physical Model<br />
MARC4002 Sustainable Architecture Research Studio<br />
38 - Critical Reflection<br />
3
THE SITE<br />
DUBAI
Ab-Anbar<br />
Vernacular Iranian water storage architecture.<br />
https://i2.wp.com/cdn.surfiran.com/wp-content/uploads/2017/06/Ab-Anbar-01-845x321.jpg?resize=845%2C321<br />
Jan<br />
Jan<br />
Jan<br />
Jan<br />
Jan<br />
Feb<br />
Feb<br />
Feb<br />
Feb<br />
Mar<br />
Mar<br />
Mar<br />
Mar<br />
Apr<br />
20 o<br />
Apr<br />
30 o<br />
Apr<br />
Apr<br />
Apr<br />
May<br />
May<br />
May<br />
22<br />
May<br />
Jun<br />
Jun<br />
Jun<br />
Jun<br />
Jul<br />
Jul<br />
Jul<br />
Jul<br />
Jul<br />
DATE (DAILY FREQ)<br />
Aug<br />
Aug<br />
Aug<br />
Aug<br />
Sep<br />
Sep<br />
Sep<br />
Sep<br />
Oct<br />
Oct<br />
Oct<br />
Oct<br />
Oct<br />
Nov<br />
Nov<br />
Nov<br />
Nov<br />
Dec<br />
Dec<br />
Dec<br />
Dec<br />
Dec<br />
pg<br />
EAST<br />
NORTH<br />
10 o<br />
WEST<br />
ServiceRoad<br />
40 o<br />
50 o<br />
SITE DRY BULB TEMP<br />
60 o<br />
70 o<br />
80 o<br />
MARC4002 _ GABI LAWRIE, LAURA PAYNE, BEN TANG_<br />
21<br />
23<br />
EAST<br />
TASK 03 _ NIRANJIKA WIJESOORIYA<br />
20 o<br />
22<br />
30 o<br />
62000<br />
62000<br />
EST<br />
40 o<br />
50 o<br />
60 o<br />
70 o<br />
80 o<br />
EAST<br />
49000<br />
34000<br />
40000<br />
24<br />
ServiceRoad<br />
23<br />
49000<br />
34000<br />
40000<br />
SOUTH<br />
62000<br />
26<br />
49000<br />
34000<br />
40000<br />
26<br />
25<br />
24<br />
25<br />
25<br />
SOUTH<br />
UAE Pavilion<br />
26<br />
ServiceRoad<br />
UAE Pavilion<br />
25<br />
aza<br />
n 1:200<br />
tre<br />
lia<br />
27<br />
Al Wasi Plaza<br />
26<br />
Path of travel from arrival plazas<br />
Site<br />
Greenspace<br />
TEMPERATURE (C)<br />
40<br />
35<br />
Prevailing Hot Summer Winds<br />
Prevailing Warm Winter Winds<br />
30<br />
Prevailing Cool Winter Winds<br />
25<br />
20<br />
21<br />
25<br />
UAE Pavilion<br />
Path of travel from arrival plazas<br />
Site<br />
1m Contours<br />
Greenspace<br />
NORTH<br />
29<br />
27<br />
Al Wasi Plaza<br />
26<br />
Prevailing Hot Summer Winds<br />
Prevailing Warm Winter Winds<br />
Prevailing Cool Winter Winds<br />
Bus Drop-off / Pick-up<br />
1m Contours<br />
28<br />
SITE TEMPERATURE<br />
0 12.5<br />
Path of travel from arrival plazas<br />
29<br />
Site<br />
26<br />
27<br />
25 50 100 m<br />
SITE Greenspace PLAN _ 1:2500<br />
N<br />
ServiceRoad<br />
Bus Drop-off / Pick-up<br />
28<br />
0 12.5<br />
26<br />
1m Contours<br />
27<br />
25 50 100 m<br />
SITE PLAN _ 1:2500<br />
21<br />
N<br />
29<br />
MARC4002 Sustainable Architecture Research Studio<br />
ture.<br />
15<br />
Jan-02<br />
Jan-02<br />
Jan-02<br />
Jan-02<br />
Jan-02<br />
Feb-02<br />
Feb-02<br />
Feb-02<br />
Feb-02<br />
Mar-02<br />
Mar-02<br />
Mar-02<br />
Mar-02<br />
Apr-02<br />
10 o<br />
Apr-02<br />
20 o<br />
30 o<br />
Apr-02<br />
Apr-02<br />
Apr-02<br />
May-02<br />
May-02<br />
May-02<br />
22<br />
May-02<br />
Jun-02<br />
Jun-02<br />
Jun-02<br />
Jun-02<br />
Jul-02<br />
Jul-02<br />
Jul-02<br />
Jul-02<br />
Jul-02<br />
DATE (DAILY FREQ)<br />
Aug-02<br />
Aug-02<br />
Aug-02<br />
Aug-02<br />
Sep-02<br />
Sep-02<br />
Sep-02<br />
Sep-02<br />
Oct-02<br />
Oct-02<br />
Oct-02<br />
Oct-02<br />
Oct-02<br />
Nov-02<br />
Nov-02<br />
Nov-02<br />
Nov-02<br />
Dec-02<br />
Dec-02<br />
Dec-02<br />
Dec-02<br />
Dec-02<br />
Site Temperature<br />
WEST<br />
ServiceRoad<br />
40 o<br />
50 o<br />
60 o<br />
70 o<br />
80 o<br />
SITE DRY BULB TEMP<br />
21<br />
23<br />
EAST<br />
5<br />
Se<br />
22
THE INSPIRATION<br />
MARC4002 _ GABI LAWRIE, LAU<br />
TASK 03<br />
s<br />
Kata-T<br />
Gregory Bu<br />
https://i.pinimg.com/originals<br />
https://upload.wikimedia.org/wikipedia/commons/f/fe/AbAnbarNain2.jpg<br />
https://i2.wp.com/cdn.surfiran.com/wp-content/uploads/2017/06/Ab-Anbar-01-845x321.jpg?resize=845%2C321<br />
g<br />
s<br />
ic<br />
re<br />
nd<br />
.<br />
-n<br />
s-<br />
d<br />
ar<br />
of<br />
https://1.bp.blogspot.com/-yro3R8foIA8/Wbai0qo2xvI/AAAAAAAAACg/x8Lfe02FFD0pbH9XmkRCtJgyDcIB8kHIgCLcBGAs/s1600/V01_run_ranchana_rungwatanawong.jpg<br />
https://www.architectureanddesign.com.au/getmedia/7f523415-d2e5-4bd1-96fe-e96bc245be87/Ulura-Kata-Tjuta-Cultural-Centre_2.aspx<br />
523415-d2e5-4bd1-96fe-e96bc245be87/Ulura-Kaentre_2.aspx<br />
counts/2810/images/Mia_Mia.jpg<br />
https://i.pinimg.com/originals/91/03/9c/91039cd7f0a36cbad85a2a754c6411f4.jpg<br />
East Elevation 1:200<br />
Kata-Tjuta Cultural Centre<br />
Gregory Burgess Architects, Uluru, Australia<br />
Ab-Anbar<br />
Vernacular Iranian water storage architecture.<br />
https://i2.wp.com/cdn.surfiran.com/wp-content/uploads/2017/06/Ab-Anbar-01-845x321.jpg?resize=845%2C321<br />
NORTH<br />
TEMPERATURE (C)<br />
https://www.designboom.com/cms/images/andrea05/musgum01.jpg<br />
40<br />
35<br />
30<br />
25<br />
20<br />
15<br />
Jan-02<br />
Jan-02<br />
THE WIND TOWERS OF DUBAI AND<br />
INDIGENOUS WEST AUSTRALIAN VERNACULAR<br />
NORTH<br />
10 o<br />
20 o<br />
30 o<br />
40 o<br />
https://s3.amazonaws.com/libapps/accounts/2810/images/Mia_Mia.jpg<br />
50 o<br />
60 o<br />
70 o<br />
80 o<br />
WEST<br />
We look back at these ways of NORTH building methods, materiality and designs to bring<br />
back into our current trends to help make our SOUTH pavilion resilient to climate change.<br />
10 o<br />
Jan-02<br />
Jan-02<br />
Jan-02<br />
21<br />
Feb-02<br />
Feb-02<br />
Feb-02<br />
Feb-02<br />
Mar-02<br />
Mar-02<br />
Mar-02<br />
Mar-02<br />
ServiceRoad<br />
Apr-02<br />
Apr-02<br />
20 o<br />
30 o<br />
40 o<br />
50 o<br />
60 o<br />
70 o<br />
80 o<br />
Apr-02<br />
Apr-02<br />
Apr-02<br />
May-02<br />
May-02<br />
SITE TEMPERATURE<br />
For centuries, vernacular architecture had been known for their sustainable<br />
designs. These efficient structures were able to withstand these extreme weather<br />
conditions without the use of electricity for comfort through the use of smart<br />
passive cooling and heating techniques. One of the major uses of electricity in<br />
current buildings is through the heavy uses of HVAC systems. Also in vernacular,<br />
natural materials were mostly found locally, reducing embodied energy.<br />
May-02<br />
22<br />
May-02<br />
Jun-02<br />
Jun-02<br />
21<br />
3<br />
Jun-02<br />
Jun-02<br />
Jul-02<br />
Jul-02<br />
Jul-02<br />
Jul-02<br />
Jul-02<br />
DATE (DAILY FREQ)<br />
SITE DRY BULB TEMP<br />
Aug-02<br />
25<br />
EAST<br />
Aug-02<br />
Aug-02<br />
Aug-02<br />
26<br />
Sep-02<br />
Ab-Anb<br />
Vernacular<br />
https://i2.wp.com/cdn.surfira<br />
Sep-02<br />
Sep-02<br />
Sep-02<br />
Oct-02
THE PROCESS<br />
The early explorations of form, the experience,<br />
the atmosphere, the elements of water,<br />
natural materials and organic shapes. Inspired<br />
by sand dunes of the desert and the comfort<br />
of the burrows to shelter from the hot direct<br />
sunlight.<br />
Seeking for natural lighting and ventilation<br />
with the comfort of earth materials to keep<br />
cool or warm. Water as a way of cooling<br />
method without the required need for<br />
mechanical cooling systems.<br />
MARC4002 Sustainable Architecture Research Studio<br />
7
FORM FINDING
Started with a vault like structure that could be built<br />
out of individual mud pressed bricks. This idea became<br />
a problem of restriction to the plan, these vaults had<br />
to be symmetrical in order to build them sustainably.<br />
It became a question of labour and time intensive to<br />
make it possible for the pavilion. From this we were<br />
directed to another approach which was concrete shell<br />
structures.<br />
MARC4002 Sustainable Architecture Research Studio<br />
9
MARC4002 Sustainable Architecture Research Studio<br />
The form we had in interim became a question of how we could construct it,<br />
making it more unsustainable than what we wanted. In order to achieve this<br />
organic form we had to rely on high embodied energy materials like concrete and<br />
steel mesh.<br />
Throughout the semester we wanted to shift our form to another direction that<br />
would be much more sustainable to build. We learnt that our curved form would<br />
had to be greatly simplified.<br />
11
SUCCESS<br />
MATRIX<br />
CRITERIA<br />
Our Success Matrix is what set our goals to achieve what<br />
we have now in our final design, we learnt along the<br />
way that not all things could be perfect, some sacrifices<br />
were needed in order to achieve a balance between all<br />
elements.<br />
Through the categories of Water, materials, comfort,<br />
Biophilia and Environmental Impacts we had listed the<br />
criteria and scored them between 1 and 10.<br />
The Fuller the compliance star, the better the building<br />
performance.
CRITERIA MATRIX<br />
A<br />
WATER<br />
COMFO RT<br />
6<br />
4<br />
8<br />
ENVIRONMENT AL I M PACTS<br />
8<br />
2<br />
2<br />
WATER<br />
7<br />
6<br />
6<br />
6 6 7<br />
8<br />
8<br />
7<br />
BIOPH<br />
I LIA<br />
MATERIALS<br />
A.1 REDUCE CRITERIA<br />
A.1.1 Water Demand Percentage of total water use<br />
reduction (kL) from Sydney Water<br />
Benchmark:<br />
1. >10%<br />
2. >20%<br />
3. >30%<br />
4. >40%<br />
5. >50%<br />
A.1.2 Water Source Environmental impact of water supply<br />
source:<br />
1. 1 (Desalination)<br />
2. 2 (Surface Water)<br />
3. 3 (Ground Water)<br />
4. 4 (Reclaimed Water)<br />
5. 5 (Rainwater/Fog Capturing)<br />
MARC4002 Sustainable Architecture Research Studio<br />
A.2 REUSE CRITERIA<br />
A.2.1 Waste Water Percentage of total water recycled<br />
treatment and reuse (kL) in comparison to estimated wate<br />
(Grey Water + Black used:<br />
Water)<br />
1. >40%<br />
2. >60%<br />
3. >80%<br />
4. >90%<br />
5. >100%<br />
A.2.2<br />
Biogases from<br />
water treatment<br />
systems captured<br />
and reused<br />
Percentage of total biogas used to<br />
generate electricity (Kw/h) in<br />
comparison to estimated electricity<br />
consumption:<br />
1. >5%<br />
2. >10%<br />
3. >15%<br />
4. >20%<br />
5. >25%<br />
comparison to treated water returne<br />
A.3 REPLACE CRITERIA<br />
A.3.1 Closed Systems Percentage of water used on site in<br />
to closed system (kL):<br />
1. >25%<br />
2. >50%<br />
3. >75%<br />
4. >85%<br />
5. >100%<br />
A.3.2<br />
Beautiful and<br />
Transparent<br />
Clarity of processes in the system,<br />
capturing the methods in an<br />
educational manner and minimising the<br />
industrial nature of the process.<br />
Public Rating system:<br />
1. 1/5<br />
2. 2/5<br />
3. 3/5<br />
4. 4/5<br />
5. 5/5<br />
<strong>Sustainability</strong> Matrix<br />
Each of the Five Elements hold points worth between<br />
1 and 10,<br />
The fuller the compliance star, the better the<br />
building performance.<br />
13
A<br />
WATER<br />
WATER<br />
CENTRAL SPINE<br />
CENTRAL SPINE<br />
FLOW OF WATER OVERLAY OF USES<br />
THE FLOW GRID OF WATER CENTRAL THE SPINE GRID<br />
CENTRAL SPINE PROGRAMS OVERLAY SET OF ALONG USES<br />
PROGRAMS SET ALONG<br />
FALL<br />
MEMBRANE (PAINT FINISH)<br />
GRAVEL<br />
FILTER FABRIC<br />
PROTECTION BOARD<br />
MEMBRANE<br />
DRAINAGE CELL WITH<br />
FILTER FABRIC<br />
AG DRAIN TO FA IN GEO<br />
FABRIC SLEEVE AND GRAVEL<br />
MEMBRANE WITH ROOT<br />
DETERRENT<br />
SCREED WITH 1:80 FALLS<br />
TO RWO<br />
15 X 15 FILLET/BOND<br />
BREAKER (40 x 40 IF SHEET<br />
MEMBRANE)<br />
A.1 REDUCE CRITERIA ASSESSMENT METHOD VALUE NO.<br />
A.1.1 Water Demand Percentage of total water use Water use measured Aim >30% 5<br />
reduction (kL) from Sydney<br />
Water Benchmark:<br />
1. >10%<br />
2. >20%<br />
3. >30%<br />
4. >40%<br />
5. >50%<br />
against Sydney Water<br />
Benchmark:<br />
https://www.sydneywa<br />
ter.com.au/SW/yourbusiness/managingyour-wateruse/benchmarks-forwater-use/index.htm<br />
Achieved =<br />
56.75%<br />
A.1.2 Water Source<br />
Environmental impact of water<br />
supply source:<br />
1. 1 (Desalination)<br />
2. 2 (Surface Water)<br />
3. 3 (Ground Water)<br />
4. 4 (Reclaimed Water)<br />
5. 5 (Rainwater/Fog Capturing)<br />
Trace water supply<br />
system determines<br />
impact level.<br />
Ranking system from:<br />
https://www.iwapublis<br />
hing.com/news/sustain<br />
ability-water-supply<br />
Aim: 3<br />
Achieved =<br />
3.5<br />
Total= 8 / 10 (x10) SCORE = 8<br />
A.2 REUSE CRITERIA ASSESSMENT METHOD VALUE NO.<br />
A.2.1 Waste Water Percentage of total water Total water usage for Aim >80% 5<br />
treatment and recycled (kL) in comparison to site (L)/capacity of<br />
reuse (Grey estimated water used: water treatment Achieved =<br />
Water + Black 1. >40%<br />
system432.9L/Day/38, 100%<br />
Water) 2. >60%<br />
3. >80%<br />
4. >90%<br />
5. >100%<br />
860L<br />
A.2.2 Biogases from<br />
water<br />
treatment<br />
systems<br />
captured and<br />
reused<br />
Percentage of total biogas<br />
used to generate electricity<br />
(Kw/h) in comparison to<br />
estimated electricity<br />
consumption:<br />
1. >5%<br />
2. >10%<br />
3. >15%<br />
4. >20%<br />
5. >25%<br />
Total electricity<br />
consumption for site<br />
(Kw/h)/capacity of<br />
biogas generator.<br />
Total Electricity<br />
consumption per year<br />
= 193947.9 kWh<br />
Electricity produced<br />
from Biogas per year<br />
= 5.685 kWh/Day x<br />
365 = 2075 kWh<br />
Aim >15%<br />
Achieved =<br />
1.06%<br />
Total= 6 / 10 (x10) SCORE = 6<br />
A.3 REPLACE CRITERIA ASSESSMENT METHOD VALUE NO.<br />
A.3.1 Closed<br />
Systems<br />
Aim >75% 4<br />
A.3.2 Beautiful and<br />
Transparent<br />
Percentage of water used on<br />
site in comparison to treated<br />
water returned to closed<br />
system (kL):<br />
1. >25%<br />
2. >50%<br />
3. >75%<br />
4. >85%<br />
5. >100%<br />
Water processes shown<br />
educationally and with clarity.<br />
Industrial feel minimized. Public<br />
Rating system:<br />
1. 1/5<br />
2. 2/5<br />
3. 3/5<br />
4. 4/5<br />
5. 5/5<br />
Estimated total water<br />
use for site (kL)/<br />
total amount of water<br />
dispersed into this<br />
closed system (kL)<br />
Public rating system<br />
via brief questionaire<br />
upon leaving the<br />
pavilion<br />
Achieved =<br />
85% with<br />
ability to<br />
meet 100%<br />
Aim: 3/5<br />
Achieved =<br />
3/5<br />
Total= 7 / 10 (x10) SCORE = 7<br />
3<br />
1<br />
3<br />
Constructed Wetland Detail<br />
Constructed Wetland Detail Section _ 1:10<br />
TOTAL WATER SCORE =<br />
21<br />
/30<br />
3<br />
Drafting 1<br />
1 : 10<br />
Max = 30
Central Spine _ Closed-loop Water Treatment System<br />
03a<br />
02<br />
04<br />
113.6 L<br />
05<br />
333.6 L<br />
08<br />
06<br />
412.4 L<br />
07<br />
03<br />
38,000 L<br />
The total capacity of this system<br />
=38,860 L / Day<br />
The total volume of biogas produced<br />
=2.85m 2 / Day<br />
= 5.685kWh / Day<br />
01. Groundwater is accessed<br />
02. Water is used in toilets, sinks and for cleaning<br />
03. The used water - a combination of grey and black water, is collected in two 19,000 Litre anoxic tanks, located underground.<br />
Here, “naturally occurring microbial organisms use the wastewater as food. They digest ammonia, phosphorus, nitrogen,<br />
potassium, and many other substances in the water.” (Omega, 2019) 1<br />
03.a Biogas (a waste bby product of the anerobic processes that breakdown waste materials) is siphoned from the anoxic tanks.<br />
This is fed to a generator onsite to produce energy for the pavilion<br />
04. From the anoxic tanks, the water flows to four man-made wetlands. Approximately 900mm deep, lined with rubber and<br />
completely filled with gravel. Wastewater flows about 5cm under the surface, stopping evaporation. Microorganisms<br />
and native plants, including cattails and bulrushes “reduce biochemical oxygen demand, remove odorous gases,<br />
continue the denitrification process and harvest nutrients such as phosphorus.” (Omega, 2019) 1<br />
05. Two aerated lagoons, containing four cells each and about 3m deep, utilise tropical plants as filters. “At this stage, the<br />
water looks and smells clean, but it's not safe to touch. The plants, fungi, algae, snails, and other microorganisms<br />
convert ammonia into nitrates and toxins into harmless base elements”. (Omega, 2019) 1<br />
06. The final treatment stage uses a recirculating sand filter. Here, sand and microorganisms absorb and digest remaining<br />
fine particulates and nitrates that may be present. At this stage the treated water is drinkable standard,<br />
without using any chemicals.<br />
07. Testing of the water quality is done at this stage to ensure it is in the best possible condition before being released<br />
into the groundwater table<br />
08. Water is taken back through the purification process if it does not meet standards at the testing point.<br />
09. The purified water is released back into the groundwater table, where the process can begin again.<br />
01 09<br />
Diagram _ Closed-loop water treatment system<br />
20<br />
20<br />
17.5<br />
1. Omega. (2019). Omega Center for Sustainable Living. [online] Available at:<br />
https://www.eomega.org/omega-center-for-sustainable-living-0 [Accessed 7 Apr. 2019].<br />
Graphics: Laura Payne<br />
MARC4002 Sustainable Architecture Research Studio<br />
11.4%<br />
2.5%<br />
13.3%<br />
27.8%<br />
13.3%<br />
WATER CONSUMPTION<br />
(Annual demand in KL)<br />
4.4%<br />
6.3%<br />
11.4%<br />
2.5%<br />
27.8%<br />
WATER CONSUMPTION<br />
(Annual demand in KL)<br />
4.4%<br />
6.3%<br />
34.2%<br />
34.2%<br />
Kitchen Sinks<br />
Dishwashing<br />
Kitchen Sinks<br />
CookingDishwashing<br />
Cleaning Cooking<br />
ToiletsCleaning<br />
Toilets<br />
Urinals<br />
Urinals<br />
Taps Taps<br />
108 K L<br />
88 K<br />
108 L K L<br />
42 88 K L K L<br />
8 K42 L<br />
K L<br />
36 8 KK L L<br />
36 K<br />
14 K<br />
L<br />
14 L K L<br />
20 20 K L K L<br />
WATER CONSUMPTION<br />
(Litres/ Person/ Day)<br />
17.5<br />
WATER CONSUMPTION<br />
(Litres/ Person/ Day)<br />
15<br />
12.5<br />
10<br />
7.5<br />
5<br />
15<br />
12.5<br />
10<br />
7.5<br />
5<br />
30%<br />
REDUCTION<br />
30%<br />
REDUCTION<br />
TOTAL<br />
TOTAL<br />
316 K<br />
316 K L<br />
L<br />
2.5<br />
2.5<br />
https://etoolglobal.com/<br />
https://etoolglobal.com/<br />
Water Consumption Analysis<br />
0<br />
865.75 L /day<br />
https://www.sydneywater.com.au/SW/your-business/managing-your-water-use/benchmarks-for-water-use/index.htm<br />
865.75 L /day<br />
https://www.sydneywater.com.au/SW/your-business/managing-your-water-use/benchmarks-for-water-use/<br />
BENCHMARK<br />
OUR AIM<br />
ACHIEVED<br />
0<br />
TOTAL = 20L TOTAL = 14L TOTAL = 8.65L<br />
per person/day BENCHMARK per person/day per OUR person/day AIM<br />
TOTAL = 20L TOTAL = 14L<br />
per person/day per person/day<br />
ACHIEVED<br />
TOTAL = 8.65L<br />
per person/day<br />
15
B<br />
MATERIALS<br />
MATERIALS<br />
B.1<br />
LIFE CYCLE<br />
ANALYSIS CRITERIA ASSESSMENT METHOD<br />
B.1.1 Global Warming<br />
Potential<br />
(GWP)<br />
Total GWP during the life cycle<br />
of the materials used in the<br />
building (kg CO2 eq/m2 Gross<br />
Floor Area/year)<br />
1. 30%<br />
Achieved =<br />
52%<br />
NO.<br />
5<br />
Material Palette<br />
B.2.2 Recycling -<br />
Solid Waste<br />
Recycling of solid waste (% in<br />
kg):<br />
1. >40%<br />
2. >45%<br />
3. >50%<br />
4. >55%<br />
5. >60%<br />
Measurement of total<br />
waste generated<br />
(weight).<br />
Dubai Brief Standard:<br />
Min. 2x10L recycling<br />
collection stations<br />
with: metals, glass,<br />
plastics, paper &<br />
corrugated cardboard.<br />
Aim >50%<br />
Achieved=<br />
50.5%<br />
3<br />
Total= 8 / 10 (x10) SCORE = 8<br />
B.3 BUILT WASTE CRITERIA ASSESSMENT METHOD<br />
B.3.1 Construction<br />
Waste<br />
Construction waste diverted<br />
from landfill: (m3/total m3)<br />
1. >40%<br />
2. >45%<br />
3. >50%<br />
4. >55%<br />
5. >60%<br />
Measurement of total<br />
waste generated<br />
(volume)<br />
VALUE<br />
ACHIEVED<br />
Aim >50%<br />
Achieved=<br />
50%<br />
NO.<br />
3<br />
B.3.2 Deconstruction<br />
Percentage of construction<br />
materials able to be recycled<br />
or reused (% in m3):<br />
1. >20%<br />
2. >25%<br />
3. >30%<br />
4. >35%<br />
5. >40%<br />
Measurement of total<br />
materials recycled<br />
(volume).<br />
Aim >30%<br />
Achieved:<br />
51%<br />
5<br />
Total= 8 / 10 (x10) SCORE = 8<br />
TOTAL MATERIALS SCORE =<br />
22
EXPO + EATING (GF)<br />
1 -1<br />
UNDERGROUND<br />
AUDITORIUM (GF) CAFÉ (GF) EXPO + EATING (GF) UNDERGROUND<br />
This graph reports whether the operative temperature falls into the 80% acceptability limits of the adaptive comfort in ASHRAE 55-2010<br />
PERCENTAGES<br />
Greater than 0 57%<br />
0 27%<br />
Less than 0 16%<br />
-1<br />
A value of 1 means within (inclusive) the limits, i.e. the zone operative temperature is no more than 2.5°C from than the ASHRAE 55 Adaptive model tem<br />
value of 0 means outside the limits (i.e. uncomfortable), and a value of -1 means not applicable, i.e. the running average outdoor air temperature is b<br />
0 -0.05511 -0.43414 0.5<br />
0 -0.00298 -0.41667 0.5<br />
0 0 -0.43212 0.5<br />
0 0 -0.42222 0.5<br />
0 0 -0.56989 0.5<br />
0 0 -0.66389 0.203472222<br />
-0.06586 -0.06452 -0.71707 -0.298387097<br />
-1 -1 -1 -1<br />
-0.87361 -0.76667 -0.92292 -0.825<br />
-0.02823 0 -0.47043 -0.25<br />
THATCHED ROOF (PALM LEAVES):<br />
Pros: Naturally insulative material, sustainable<br />
and local.<br />
Cons: Harder to construct than panellised<br />
system<br />
'DANPALON'PLASTIC ROOFING PANELS:<br />
Pros: Insulative properties, sustainable material.<br />
Cons: Look perhaps too chunky.<br />
TIMBER FRAMED ROOF STRUCTURE:<br />
Pros: Lightweight, lower embodied energy than<br />
using metal.<br />
Cons: Needs to be sustainably sourced.<br />
333.6 L<br />
08<br />
GLOBAL WARMING POTENTIAL<br />
(kg CO2 eq/m2 Gross Floor Area/year)<br />
50<br />
45<br />
40<br />
35<br />
30<br />
25<br />
20<br />
Construction Materials Diagram<br />
-PRODUCT REUSE<br />
END OF LIFE<br />
RECURRING<br />
CONSTRUCTION<br />
412.4 L<br />
TRANSPORT<br />
06<br />
15<br />
or cleaning<br />
PRODUCTS<br />
rey and black water, is collected in two 19,000 Litre anoxic tanks, located underground.<br />
bial organisms use the wastewater 10 as food. They digest ammonia, phosphorus, nitrogen,<br />
tances in the water.” (Omega, 2019) 1<br />
anerobic processes that breakdown waste materials) is siphoned from the anoxic tanks.<br />
e to produce energy for the pavilion 5<br />
ws to four man-made wetlands. Approximately 900mm deep, lined with rubber and<br />
astewater flows about 5cm under the surface, stopping evaporation. Microorganisms<br />
0<br />
ails and bulrushes “reduce biochemical oxygen demand, remove odorous gases,<br />
ess and harvest nutrients such as phosphorus.” (Omega, BENCHMARK 2019) OUR AIM<br />
1<br />
cells each and about 3m deep, utilise tropical plants TOTAL as filters. = “At this stage, the TOTAL =<br />
ut it's not safe to touch. The plants, fungi, algae, 44.12kg<br />
snails, and other microorganisms
TASK 03 _ NIRANJIKA WIJESOORIYA<br />
C<br />
COMFORT<br />
COMFORT<br />
VISUAL<br />
COMFORT CRITERIA ASSESSMENT METHOD VALUE NO.<br />
C.1<br />
C.1.1 Illuminance Monthly average of regularly<br />
occupied primary spaces with<br />
daylighting illuminance levels<br />
of > 200lux (per year):<br />
1. >20%<br />
2. >30%<br />
3. >40%<br />
4. >50%<br />
5. >60%<br />
C.1.2 Daylight<br />
Access<br />
Average exposure to direct<br />
sunlight that the building<br />
interior achieves (during<br />
daytime operative hours):<br />
1. >20%<br />
2. >25%<br />
3. >30%<br />
4. >35%<br />
5. >40%<br />
Daylight Visualiser (by<br />
Velux) programme<br />
Design Builder<br />
Ladybug Analysis<br />
tools<br />
Aim >40%<br />
Achieved =<br />
43.7%<br />
Aim >30%<br />
Achieved =<br />
1.4%<br />
Total= 4 / 10 (x10) SCORE = 4<br />
3<br />
1<br />
MARC4002 _ GABI<br />
BIOPHILIA COMFORT<br />
1.06% BIOGAS<br />
Sun Path Strategy Diagram (N.T.S)<br />
1<br />
GSPublisherVersion 0.95.100.100<br />
3<br />
2<br />
1<br />
4<br />
3<br />
2<br />
1 2 3<br />
ENERGY USE<br />
Gross Floor Area/year)<br />
350<br />
300<br />
250<br />
200<br />
150<br />
4<br />
ENTRY / EXIT<br />
Passive Cooling Strategy Diagram (N.T.S)<br />
Passive Ventilation Strategy Diagram (N.T.S)<br />
5<br />
Biophilia Analysis Diagrams - Human & Nature Connections (on a Journey Through Pavilion)<br />
MINIMUM<br />
5<br />
6<br />
4<br />
6<br />
THERMAL<br />
COMFORT CRITERIA ASSESSMENT METHOD VALUE NO.<br />
C.2<br />
C.2.1 Comfort Range Percentage of the year that<br />
regularly occupied spaces are<br />
within AHRAE comfort range:<br />
1. 90%<br />
5 6<br />
Design Builder<br />
Min ventilation value =<br />
0.5 (as per Section A4<br />
of CIBS guide).<br />
Online link:<br />
https://www.sciencedir<br />
ect.com/topics/enginee<br />
ring/minimumventilation-rate<br />
Aim >50%<br />
Achieved =<br />
14.6%<br />
CO2 monitors are to Aim >80%<br />
be placed between 900<br />
- 1800 mm above the Achieved =<br />
floor. CO2 monitors 83%<br />
are to indicate when<br />
3<br />
CO2 concentration<br />
exceeds 500-700 ppm.<br />
Total= 4 / 10 (x10)<br />
1<br />
SCORE =<br />
1<br />
4<br />
TOTAL COMFORT SCORE =<br />
2<br />
4<br />
1<br />
3<br />
3<br />
2<br />
4<br />
ENTRY / EXIT<br />
17
1000<br />
500<br />
0<br />
Jan-02 Feb-02Jan-02 Mar-02Feb-02 Apr-02Mar-02 May-02Apr-02 Jun-02May-02 Jul-02Jun-02 Aug-02Jul-02 Sep-02Aug-02 Oct-02Sep-02 Nov-02Oct-02 Dec-02Nov-02 Dec-02<br />
MONTHLY AVERAGE MONTHLY AVERAGE<br />
MONTHLY AVERAGE<br />
AUDITORIUM (GF) AUDITORIUM MONTHLY CAFÉ (GF) AVERAGE (GF) CAFÉ EXPO (GF) + EATING EXPO (GF) + EATING UNDERGROUND<br />
(GF) UNDERGROUND<br />
AUDITORIUM (GF) CAFÉ (GF) EXPO + EATING (GF) UNDERGROUND<br />
Jan-02 Feb-02 Mar-02 Apr-02 May-02 Jun-02 Jul-02 Aug-02 Sep-02 Oct-02 Nov-02 Dec-02<br />
Mar-02 Apr-02 May-02 Jun-02 Jul-02 Aug-02 Sep-02 Oct-02 Nov-02 Dec-02<br />
RIUM (GF) CAFÉ (GF) EXPO + EATING (GF) UNDERGROUND<br />
TOTAL TOTALS<br />
AVERAGE ILLUMI- TOTALS<br />
NANCE TOTALS (year)<br />
TOTALS<br />
16%<br />
16%<br />
16%<br />
16%<br />
27%<br />
27% 57%<br />
27%<br />
57%<br />
2000 lux<br />
1000<br />
200-2000 lux >2000 lux<br />
AUDITORIUM (GF) CAFÉ (GF) EXPO + EATING (GF) MARC4002 _ GABI UNDERGROUND<br />
LAWRIE, LAURA PAYNE, BEN TANG_<br />
TASK 03 _ NIRANJIKA WIJESOORIYA<br />
ptive Model 80% Acceptability Status<br />
F)<br />
GROUND<br />
0.5<br />
0.5<br />
0.5<br />
0.5<br />
0.5<br />
472<br />
839<br />
-1<br />
825<br />
.25<br />
222<br />
0.5<br />
734<br />
Dec-02<br />
57%<br />
2000<br />
KEY:<br />
1500<br />
2000 lux<br />
People in Zone ASHRAE 55 Adaptive Model<br />
80% Acceptability Status<br />
1<br />
0.8<br />
0.6<br />
0.4<br />
0.2<br />
0<br />
-0.2<br />
-0.4<br />
-0.6<br />
20<br />
-0.8<br />
-1<br />
ILLUMINANCE (LUX)<br />
4000<br />
3500<br />
3000<br />
2500<br />
57%<br />
500<br />
0<br />
Jan-02 Feb-02 Mar-02 Apr-02 May-02 Jun-02 Jul-02 Aug-02 Sep-02 Oct-02 Nov-02 Dec-02<br />
MONTHLY AVERAGE<br />
Thermal Comfort ASHRAE<br />
16%<br />
27%<br />
TOTALS<br />
VISUAL COMFORT (ILLUMINANCE)<br />
57%<br />
TEMPERATURE (C)<br />
40<br />
35<br />
30<br />
25<br />
2000 lux<br />
TEMPERATURE<br />
15<br />
Jan-02 Jan-02 Feb-02 Mar-02 Apr-02 May-02 Jun-02 Jul-02 Aug-02 Sep-02 Oct-02 Nov-02 Dec-02<br />
Feb-02 Mar-02 Apr-02 May-02 Jun-02 Jul-02 Aug-02 Sep-02 Oct-02 Nov-02 Dec-02<br />
DATE<br />
DATE (DAILY FREQ)<br />
MARC4002 Sustainable Architecture Research Studio<br />
AUDITORIUM (GF) CAFÉ (GF) EXPO + EATING (GF) UNDERGROUND<br />
UNDERGROUND AUDITORIUM (GF) CAFÉ (GF) EXPO + EATING (GF) SITE DRY BULB TEMP<br />
This graph reports whether the operative temperature falls into the 80% acceptability limits of the adaptive comfort in ASHRAE 55-2010:<br />
A value of 1 means within (inclusive) the limits, i.e. the zone operative temperature is no more than 2.5°C from than the ASHRAE 55 Adaptive model temperature. A<br />
value of 0 means outside the limits (i.e. uncomfortable), and a value of -1 means not applicable, i.e. the running average outdoor air temperature is below 10°C.<br />
19<br />
THATCHED ROOF (PALM LEAVES):<br />
Pros: Naturally insulative material, sustain-
D<br />
BIOPHILIA<br />
BIOPHILIA<br />
D.1 CONNECT CRITERIA ASSESSMENT METHOD VALUE NO.<br />
D.1.1 Human -<br />
Nature<br />
Connection<br />
Aim: 3 5<br />
D.1.2 Natural Views<br />
D.1.3 Human -<br />
Human<br />
Connection<br />
On a journey to each room or<br />
area of the pavilion, how many<br />
times does the visitor have<br />
the opportunity to interact<br />
with nature?<br />
1. 1 time<br />
2. 2<br />
3. 3<br />
4. 4<br />
5. 5<br />
Percentage of regularly<br />
occupied primary spaces (m2)<br />
that is to have a clear line of<br />
sight to a natural element:<br />
1. >50%<br />
2. >55%<br />
3. >60%<br />
4. >65%<br />
5. >70%<br />
How many spaces are there<br />
for people to socialise and<br />
gather on site?<br />
1 - 5 SCORE = 1 -5 spaces<br />
Interaction with nature<br />
means: the opportunity<br />
to see, hear, touch or<br />
smell a natural<br />
element.<br />
Analysis of visitor<br />
pathways and spaces.<br />
Views analysis in 2D<br />
and 3D model within<br />
8m zone - possible in<br />
most architectural<br />
programs<br />
Achieved =<br />
5<br />
Aim >60%<br />
Achieved =<br />
62%<br />
Analysis of social Aim: 3 3<br />
areas within design.<br />
Achieved =<br />
3 spaces<br />
Total= 11 / 15 (x10) SCORE = 7.33<br />
3<br />
D.2 ACCESS CRITERIA ASSESSMENT METHOD VALUE NO.<br />
D.2.1 Universal<br />
Access<br />
Analysis of circulation Aim: Yes<br />
pathways<br />
2<br />
D.2.2 Age access<br />
Are all areas of the pavillion<br />
able to be accessed by<br />
someone without the use of<br />
stairs?<br />
1. No<br />
2. Yes<br />
Percentage of exhibition area<br />
that is accessible to children<br />
and promotes child interaction:<br />
1. >40%<br />
2. >45%<br />
3. >50%<br />
4. >55%<br />
5. >60%<br />
Observation of<br />
children in building.<br />
Measure exhibition<br />
items height + childfriendlyness<br />
Achieved =<br />
Yes<br />
Aim >50%<br />
Achieved =<br />
50%<br />
Total= 5 / 7 (x10) SCORE = 7.14<br />
3<br />
D.3 EDUCATION CRITERIA ASSESSMENT METHOD VALUE NO.<br />
D.3.1 Sustainable<br />
Awareness -<br />
Pavilion<br />
Aim: 2 3<br />
How many of the pavilion's<br />
sustainable design elements<br />
are on display to the visitor?<br />
1. 0<br />
2. 1<br />
3. 2<br />
4. 3<br />
5. 4<br />
Measure of<br />
sustainable design<br />
points shown in<br />
completed structure.<br />
Possible analysis of<br />
number of people who<br />
visit these points.<br />
Achieved =<br />
2<br />
D.2.2 <strong>Sustainability</strong><br />
Awareness -<br />
General<br />
Percentage of visitors who<br />
leave the pavilion and<br />
incorporate a sustainable<br />
practice into their lifestyle:<br />
1. >20%<br />
2. >25%<br />
3. >30%<br />
4. >35%<br />
5. >40%<br />
Survey of each<br />
participant upon<br />
exiting pavilion.<br />
Additional survey &<br />
reminder email to be<br />
sent out 2 weeks<br />
after visitation.<br />
Aim >30%<br />
Achieved =<br />
30%<br />
Total= 6 / 10 (x10) SCORE = 6<br />
3<br />
TOTAL BIOPHILIC SCORE =<br />
20.5
4<br />
4<br />
5<br />
5<br />
3<br />
3<br />
6<br />
6<br />
1<br />
2<br />
1<br />
2<br />
MARC4002 Sustainable Architecture Research Studio<br />
3<br />
2<br />
1 2 3<br />
4<br />
5 6<br />
1<br />
1<br />
GSPublisherVersion 0.95.100.100<br />
Biophilia Analysis Diagrams - Human & Nature Connections (on a Journey Through Pavilion)<br />
21<br />
FALL<br />
Constructed Wetlands
E<br />
ENVIRONMENTAL IMPACTS<br />
ENVIRONMENTAL<br />
IMPACT<br />
E.1 NOISE CRITERIA ASSESSMENT METHOD<br />
E.1.1 Noise Pollution -<br />
Construction<br />
E.1.2 Noise Pollution -<br />
Internal<br />
Percentage of total<br />
construction time (hrs) that<br />
noise of construction is kept<br />
under 80dB:<br />
1. >50%<br />
2. >60%<br />
3. >70%<br />
4. >80%<br />
5. >90%<br />
Percentage of regularly<br />
occupied primary spaces (m2)<br />
from which noise from all<br />
continually-operating services<br />
is under 20 dB:<br />
1. >70%<br />
2. >75%<br />
3. >80%<br />
4. >85%<br />
5. >90%<br />
Testo sound level<br />
meter:<br />
https://www.testo.com<br />
/en-<br />
AU/products/soundmeter<br />
VALUE<br />
ACHIEVED<br />
Aim >70%<br />
Achieved =<br />
72%<br />
Non-habitable areas Aim >80%<br />
to be positioned within<br />
the design to absorb Achieved =<br />
noise from habitable 83%<br />
areas.<br />
Internal spaces<br />
measured with a<br />
sound pressure<br />
measurement.<br />
NO.<br />
3<br />
3<br />
Total= 6 / 10 (x10) SCORE = 6<br />
E.2 ECOLOGY CRITERIA ASSESSMENT METHOD<br />
E.2.1 Plants Sourcing All plants used are to be UAE Measure of number of<br />
or Australian natives. plants obtained from<br />
Percentage of plants used local sources (ie.<br />
(number of plants/total Dubai area)<br />
number) that are supplied from<br />
local sources:<br />
1. >30%<br />
2. >40%<br />
3. >50%<br />
4. >60%<br />
5. >70%<br />
E.2.2 Plants Impact<br />
Are plants selected an<br />
invasive or pest species in<br />
Dubai?<br />
1. Yes<br />
2. No<br />
Does plant appear on<br />
Global Register of<br />
Introduced and<br />
Invasive Species<br />
(GRIIS).<br />
http://www.griis.org/<br />
VALUE<br />
ACHIEVED<br />
Aim >50%<br />
Achieved =<br />
69%<br />
Aim: No<br />
invasive<br />
Achieved:<br />
No<br />
invasive<br />
NO.<br />
4<br />
Total= 6 / 7 (x10) SCORE = 8.57<br />
2<br />
E.3 ENERGY CRITERIA ASSESSMENT METHOD<br />
E.3.1 Efficiency Building energy use (kWh per Design Builder<br />
m2 per annum):<br />
1. 60%<br />
per year<br />
VALUE<br />
ACHIEVED<br />
Aim<br />
40%<br />
Achieved =<br />
19. 29%<br />
NO.<br />
1<br />
1<br />
Total= 2 / 10 (x10) SCORE = 2<br />
TOTAL ENVIRONMENTAL SCORE =<br />
16.6
FALL<br />
Constructed Wetlands<br />
MEMBRANE (PAINT FINISH)<br />
GRAVEL<br />
FILTER FABRIC<br />
PROTECTION BOARD<br />
4<br />
4<br />
Juncus Effusus<br />
- Soft Rush<br />
Phragmites Australis<br />
- Reeds<br />
MEMBRANE<br />
DRAINAGE CELL WITH<br />
FILTER FABRIC<br />
Typha Domingensis<br />
Typha Latifolia<br />
AG DRAIN TO FA IN GEO<br />
- Bulrush FABRIC SLEEVE AND - Common GRAVEL Cattails<br />
5<br />
5<br />
Aerated Lagoons<br />
MEMBRANE WITH ROOT<br />
DETERRENT<br />
SCREED WITH 1:80 FALLS<br />
TO RWO<br />
3<br />
3<br />
6<br />
6<br />
Cyperus Involucratus<br />
- Umbrella Sedge<br />
3<br />
Avicennia Marina<br />
- Grey Mangrove<br />
Constructed Wetland Detail Section _ 1:10<br />
Drafting 1<br />
Cyperus Papyrus<br />
- Paper Reed<br />
Recirculating Sand Filter<br />
ey Through Pavilion)<br />
Ficinia Nodosa<br />
- Knobby Club Sedge<br />
5 6<br />
Juncus Effusus<br />
- Soft Rush<br />
15 X 15 FILLET/BOND<br />
BREAKER (40 x 40 IF SHEET<br />
MEMBRANE)<br />
Hydrocleys Nymphoides<br />
- Water Poppies<br />
1 : 10<br />
Scirpus Validus<br />
- Softstem Bulrush<br />
1<br />
2<br />
1<br />
Nymphaea Caerulea<br />
- Egyptian Lotus<br />
2<br />
ENTRY / EXIT<br />
Nymphaea Lotus<br />
- White Lotus<br />
Thalia Geniculata<br />
- Alligator Flag<br />
Flora of South Australia (http://www.flora.sa.gov.au/)<br />
Flora of Victoria (http://www.floravictoria.com.au/)<br />
Planting Wetlands and Dams - A Practical Guide to Wetland<br />
Design, Construction and Propagation, Romanowski, N.<br />
(Landlinks Press, 2009)<br />
Tangible benefits of native vegetation - Restoring the balance<br />
and saving a dollar, Crouch, C. (Wimmera CMA, 2005)<br />
Waterplants in Australia - A Field Guide, GR Sainty & SW Jacobs<br />
(Sainty & Associates, 2003)<br />
Wetland habitats - A Practical Guide to Restoration and<br />
Management, Romanowski, N. (CSIRO PUBLISHING, 2010)<br />
What South East Native Plant is that? Neville Bonney (2010)<br />
RENEWABLE SOURCES<br />
(% total kWh per year)<br />
MARC4002 Sustainable Architecture Research Studio<br />
70<br />
350<br />
60<br />
300<br />
RENEWABLE SOURCES<br />
(% total kWh per year)<br />
50<br />
40<br />
30<br />
20<br />
10<br />
U.A.E 2050<br />
PLAN<br />
DUBAI 2030<br />
1.06% BIOGAS<br />
SOLAR<br />
ENERGY USE<br />
(kWh/m2 Gross Floor Area/year)<br />
250<br />
200<br />
150<br />
100<br />
50<br />
MINIMUM<br />
REQUIRED<br />
(DUBAI)<br />
BEST PRACTICE<br />
(DUBAI)<br />
PLAN<br />
.au/)<br />
.au/)<br />
tland<br />
ki, N.<br />
2009)<br />
lance<br />
2005)<br />
acobs<br />
2003)<br />
n and<br />
2010)<br />
(2010)<br />
0<br />
BENCHMARK<br />
TOTAL =<br />
44%<br />
BENCHMARK<br />
TOTAL =<br />
15%<br />
OUR AIM<br />
TOTAL = 40%<br />
ACHIEVED<br />
TOTAL =<br />
19.29%<br />
BENCHMARK SOURCES : https://www.rsbdubai.gov.ae/renewables/<br />
https://www.export.gov/article?id=United-Arab-Emirates-Renewable-Energy<br />
0<br />
BENCHMARK<br />
TOTAL =<br />
160 - 260kWh<br />
BENCHMARK<br />
TOTAL =<br />
110 - 160kWh<br />
OUR AIM<br />
TOTAL =<br />
<strong>WADI</strong><br />
VALLEY OF WETLANDS<br />
DUBAI EXPO 2020
Throughout our exploration and working through the success<br />
matrix goals we achieved something we were more proud of in<br />
terms of sustainability and climate resilient design<br />
MARC4002 Sustainable Architecture Research Studio<br />
25
THE ENTRANCE<br />
Wetlands seen from the Entry Lobby - visitors are able<br />
to walk along the wetlands and discover the journey<br />
process of water re-harvesting.
AUDITORIUM<br />
MARC4002 Sustainable Architecture Research Studio<br />
The Auditorium viewed from the west entrance, a place<br />
free of all sorts of topics and entertainment, but most<br />
important a place to educate visitors on how to be<br />
sustainable.<br />
27
ROOF PLAN
GROUND PLAN<br />
MARC4002 Sustainable Architecture Research Studio<br />
29
LOWER GROUND PLAN
Expo 2020, Dubai<br />
CONSTRUCTION DETAIL<br />
Each of the Five Elements hold points worth between 1 and 10,<br />
The fuller the compliance star, the better the building performance.<br />
THATCHED ROOF CLADDING<br />
THATCH TIES<br />
CONCRETE WALL COPING<br />
COVERING MOUNTING PARTS<br />
BIOPHILIA<br />
1<br />
RAMMED EARTH WALL 450mm<br />
RAMMED EARTH WALL 450mm<br />
BITUMEN COATiNG AND CLAY<br />
MORTAR 12mm<br />
PLINTH OF FLY-ASH INSULATING<br />
CONCRETE<br />
GRAVEL DRAINAGE<br />
XPS INSULATION<br />
GRAVEL<br />
SUBSOIL DRAIN<br />
BLINDING CONCRETE<br />
ENVIRONMENTAL IMPACTS<br />
GSPublisherVersion 0.95.100.100<br />
Biophilia Analy<br />
FALL<br />
Constructed Wetlands<br />
Juncus Effusus<br />
- Soft Rush<br />
Aerated Lagoons<br />
Cyperus Involucratus<br />
- Umbrella Sedge<br />
3<br />
MARC4002 Sustainable Architecture Research Studio<br />
Phragmites Au<br />
- Reeds<br />
Constructed Wetl<br />
Drafting 1<br />
Cyperus<br />
- Paper<br />
Recirculating Sand F<br />
Avicennia Marina<br />
- Grey Mangrove<br />
Ficinia Nodosa<br />
- Knobby Club S<br />
Rammed Earth Wall Detail Section _ 1:20<br />
Unnamed As indicated<br />
7<br />
Drafting 5<br />
1 : 20<br />
31
EAST ELEVATION<br />
WEST ELEVATION
Section D 1:200<br />
v<br />
v<br />
v<br />
v<br />
Section A 1:200<br />
SECTION Section A C 1:200<br />
v<br />
v<br />
Section C 1:200<br />
MARC4002 Sustainable Architecture Research Studio<br />
Section B 1:200<br />
Section D 1:200<br />
SECTION B<br />
Section D 1:200<br />
Section C 1:200<br />
33
v<br />
v<br />
v<br />
v<br />
v<br />
v<br />
Section C 1:200<br />
v<br />
Section C 1:200<br />
SECTION Section C<br />
v<br />
C 1:200<br />
Section D 1:200<br />
Section D 1:200<br />
Section D 1:200<br />
SECTION D<br />
Section C 1:200
NORTH ELEVATION<br />
MARC4002 Sustainable Architecture Research Studio<br />
SOUTH ELEVATION<br />
35
PHYSICAL MODEL
37<br />
MARC4002 Sustainable Architecture Research Studio
*Allow u<br />
CRITICAL REFLECTION<br />
Strengths<br />
Weaknesses<br />
*Reduced carbon footprint from materials which are either<br />
locally sourced, low embodied energy, long life expectancy<br />
and recyclable<br />
*Still requires the use of artificial cooling for comfort due to<br />
the climate of Dubai and the many visitors expected to be in<br />
the pavilion<br />
*Sets an<br />
method<br />
concret<br />
Environment<br />
*Giving water back through reharvesting in our gravity feed<br />
wetlands system<br />
*An option to become apart of nature again, aimed for self<br />
sustaining wetlands after the expo. The materials such as the<br />
thatched roof and walls are naturally given back.<br />
*Requires water taken from outside system due to the low<br />
precipitation for rainwater harvesting all year to generate<br />
enough demand<br />
*Able to<br />
workers<br />
*More h<br />
heavy m<br />
*Allow u<br />
wetland<br />
desert<br />
Economical<br />
*Locally sourced material means less transportation and<br />
building time<br />
*Provide jobs for locals to build with the use of palm tree<br />
(thatched roof) and Rammed Earth<br />
*Able to sustain many years and can be reused after the life of<br />
the pavilion.<br />
*The energy consumption to operate the pavilion was much<br />
greater than what we can generate through renewable<br />
sources which means we weren’t able to achieve net zero<br />
unless we have a much greater surface area for solar panels<br />
*Saving<br />
leaves a<br />
without<br />
*Renew<br />
*Oppor<br />
Social<br />
*A glimpse of Australia and our native plants in the heart of the<br />
Dubai desert. A way to educate sustainability through out the<br />
pavilion.<br />
*A place of gathering and social interaction, dedicated cafe,<br />
auditorium, exhibition spaces and the experience of the<br />
natural wetlands throughout the pavilion, able to see the<br />
progression of the system from the ground and into the lower<br />
ground.<br />
*The pavilion may not attract everyone in terms of the<br />
programs given.<br />
*A place<br />
sustaina<br />
*Hopefu<br />
building
Opportunities<br />
Threats<br />
ue to<br />
be in<br />
low<br />
ate<br />
*Sets an example of sustainable design for Dubai’s current<br />
methods of using high embodied energy materials like steel,<br />
concrete and glass.<br />
*Able to utilise locally grown materials and benefit local<br />
workers to build the pavilion<br />
*More hands on construction trying to reduce the reliance of<br />
heavy machinery when constructing<br />
<br />
*Palm trees would need to be re planted constantly to follow<br />
the demand as a building material. Palm trees which grows<br />
fully between 4-6years can be a long time to recover from.<br />
This means a risk of shortage to palm trees in Dubai<br />
*More suited to a particular location where the right materials<br />
can be found<br />
much<br />
ero<br />
anels<br />
*Allow us to give back to nature and enhance it with our<br />
wetlands that was never possible in the middle of Dubai’s<br />
desert<br />
*Allow us to reuse water instead of wasting it<br />
*Saving cost by using locally available materials such as palm<br />
leaves and taking natural materials for rammed earth walls<br />
without the need for manufacture<br />
*Renewable energy offset 20% of the total energy uses<br />
*Opportunity to Reuse after the Dubai Expo<br />
*Building a pavilions that only operates for 173days is not fully<br />
ideal<br />
*Can be labour intensive which may cost more depending on<br />
the worker and experience<br />
MARC4002 Sustainable Architecture Research Studio<br />
*A place to gather and educate others about the process of<br />
sustainability and methods of water reharvesting<br />
*Programs are not entirely attractive for all ages but a place for<br />
education and awareness<br />
*Hopefully providing awareness to future generations on how<br />
buildings should be approached to be more sustainable<br />
39