Vernier International k-12 catalog
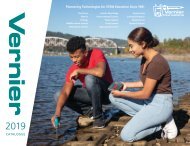
We introduced our first Go Direct sensors with Bluetooth® wireless technology and USB connectivity in 2017, and we are excited to say we now have more than 50 Go Direct sensors! The newest additions are Go Direct sensors for Blood Pressure, Weather, and a Structures & Materials Tester, along with a Go Direct Spirometer.
We introduced our first Go Direct sensors with Bluetooth® wireless
technology and USB connectivity in 2017, and we are excited to
say we now have more than 50 Go Direct sensors! The newest
additions are Go Direct sensors for Blood Pressure, Weather, and a
Structures & Materials Tester, along with a Go Direct Spirometer.

Create successful ePaper yourself
Turn your PDF publications into a flip-book with our unique Google optimized e-Paper software.
Software<br />
Graphical Analysis 4<br />
View a graph, table, and meter simultaneously.<br />
Collect, share, and<br />
analyze sensor data<br />
with our free software<br />
for Chrome OS, iOS,<br />
iPadOS, Android, <br />
Windows, and macOS.<br />
Using Graphical Analysis 4 app, you can<br />
collect data from Go Direct sensors<br />
or LabQuest sensors connected to a<br />
compatible interface.<br />
Key Features<br />
Data Collection<br />
• Collect data from multiple sensors<br />
simultaneously.<br />
• Select time-based or event-based data<br />
collection, including events with entry.<br />
• Adjust data-collection rate and duration<br />
as needed.<br />
• Enter data manually or using the<br />
clipboard.<br />
• Draw predictions before data collection.<br />
Use analysis tools, including text annotations and statistics.<br />
Data Analysis<br />
• Display one, two, or three graphs<br />
as needed.<br />
• Easily select what columns and data sets<br />
are plotted on each graph.<br />
• Calculate descriptive statistics and<br />
fit lines and curves to some or all of<br />
your data.<br />
• View data in a meter, on a graph, in a<br />
table, or all three at once.<br />
Download Graphical Analysis 4<br />
for free<br />
Download for Windows and<br />
macOS at vernier.com/ga4<br />
SECONDARY SCHOOL<br />
Enter data manually, copy data saved<br />
on your clipboard, or receive data from<br />
a Data Sharing source (LabQuest 2 or<br />
Logger Pro 3) using Wi-Fi.<br />
• Perform graph matching exercises with<br />
a Motion Detector.<br />
Learn more at vernier.com/graphical-analysis<br />
37