The Dynamics of Kea Behaviour and Interpretive Signage on Visitor ...
The Dynamics of Kea Behaviour and Interpretive Signage on Visitor ...
The Dynamics of Kea Behaviour and Interpretive Signage on Visitor ...

You also want an ePaper? Increase the reach of your titles
YUMPU automatically turns print PDFs into web optimized ePapers that Google loves.
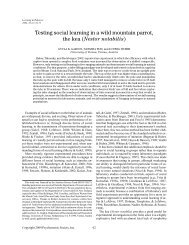
Table 3. Attracting Power <str<strong>on</strong>g>of</str<strong>on</strong>g> different signage treatments at Auckl<str<strong>on</strong>g>and</str<strong>on</strong>g> Zoological Park <str<strong>on</strong>g>and</str<strong>on</strong>g><br />
Franklin Zoo <str<strong>on</strong>g>and</str<strong>on</strong>g> Wildlife Sanctuary.<br />
ATTRACTING POWER ORIGINAL SIGN 1 SIGN 2 3DCAST<br />
AUCKLAND ZOO MALES 30% 49% 71% 50%<br />
FEMALES 37% 56% 66% 48%<br />
OVERALL 33% 53% 68% 49%<br />
FRANKLIN ZOO MALES 25% 60% 88% 32%<br />
FEMALES 33% 61% 76% 51%<br />
OVERALL 30% 61% 80% 44%<br />
ZOOS COMBINED (33)* 55% 73% 47%<br />
* Note that the wide variability in the signage type <str<strong>on</strong>g>and</str<strong>on</strong>g> design <str<strong>on</strong>g>of</str<strong>on</strong>g> the original signs may arguably make<br />
this combined percentage irrelevant.<br />
When the raw data for the Attracting Power <str<strong>on</strong>g>of</str<strong>on</strong>g> the two experimental sign treatments at both<br />
Zoological Parks were combined, expressed as proporti<strong>on</strong>s, <str<strong>on</strong>g>and</str<strong>on</strong>g> compared using Chi square,<br />
there was a significant difference in the proporti<strong>on</strong> <str<strong>on</strong>g>of</str<strong>on</strong>g> individuals that were attracted to the<br />
different sign treatments (x²=12.394, df=1, P-value =0.0001).<br />
26