- Page 1:
User Guide
- Page 4 and 5:
Canvas 12 User Guide GeoSpatial Dat
- Page 6 and 7:
Canvas 12 User Guide vi Starting An
- Page 8 and 9:
Canvas 12 User Guide viii Color Man
- Page 10 and 11:
Canvas 12 User Guide x C HAP TER 4
- Page 12 and 13:
Canvas 12 User Guide xii Using Scan
- Page 14 and 15:
Canvas 12 User Guide xiv Positionin
- Page 16 and 17:
Canvas 12 User Guide xvi Exporting
- Page 18 and 19:
Canvas 12 User Guide Welcome to Can
- Page 20 and 21:
Canvas 12 User Guide Smart Vector F
- Page 22 and 23:
Canvas 12 User Guide CGM4 file supp
- Page 24 and 25:
Canvas 12 User Guide Multi-save Exp
- Page 26 and 27:
Canvas 12 User Guide Enhanced usabi
- Page 28 and 29:
Canvas 12 User Guide Some menu item
- Page 30 and 31:
Canvas 12 User Guide For the latest
- Page 33 and 34:
Chapter 2: Documents and Setup
- Page 35 and 36:
Startup dialog box and new document
- Page 37 and 38:
Page Navigator Symbol Library Chapt
- Page 39 and 40:
To lock a tool palette: Chapter 2:
- Page 41 and 42:
To access tool palettes and tools v
- Page 43 and 44:
Pen ink Fill ink When editing an im
- Page 45 and 46:
Rulers Displays the vertical and ho
- Page 47 and 48:
To move an object: Do one of the fo
- Page 49 and 50:
To cache text objects: 1. Group the
- Page 51 and 52:
Chapter 2: Documents and Setup To a
- Page 53 and 54:
Docking palettes Chapter 2: Documen
- Page 55 and 56:
Chapter 2: Documents and Setup Hint
- Page 57 and 58:
Changing the view magnification Cha
- Page 59 and 60:
Using Views commands Chapter 2: Doc
- Page 61 and 62:
View options Chapter 2: Documents a
- Page 63 and 64:
current operation. Chapter 2: Docum
- Page 65 and 66:
Chapter 2: Documents and Setup 2. C
- Page 67 and 68:
Saving files To save a new Canvas d
- Page 69 and 70:
3. Click the Options button to sele
- Page 71 and 72:
Reverting to the saved version of a
- Page 73 and 74:
Chapter 2: Documents and Setup The
- Page 75 and 76:
Print range All pages: Prints all t
- Page 77 and 78:
Chapter 2: Documents and Setup No t
- Page 79 and 80:
Additional Information Chapter 2: D
- Page 81 and 82:
To preview a printed document: 1. D
- Page 83 and 84:
Chapter 2: Documents and Setup size
- Page 85 and 86:
To create a new document from insid
- Page 87 and 88:
Presentations Animations Chapter 2:
- Page 89 and 90:
Orientation Chapter 2: Documents an
- Page 91 and 92:
To display and hide rulers: Chapter
- Page 93 and 94:
Document scale methods Chapter 2: D
- Page 95 and 96:
To use the Set Document Scale comma
- Page 97 and 98:
3. Enter a value in the Line Distan
- Page 99 and 100:
Chapter 2: Documents and Setup This
- Page 101 and 102:
Using the Page Navigator palette Th
- Page 103 and 104:
Palette options Chapter 2: Document
- Page 105 and 106:
To select an item in the list: Type
- Page 107 and 108:
To add pages: 1. Click the New page
- Page 109 and 110:
Chapter 2: Documents and Setup When
- Page 111 and 112:
Chapter 2: Documents and Setup Disp
- Page 113 and 114:
Chapter 2: Documents and Setup 3. I
- Page 115 and 116:
Hotkey Action V Selection Arrow A D
- Page 117 and 118:
Chapter 2: Documents and Setup Pres
- Page 119 and 120:
Chapter 2: Documents and Setup When
- Page 121 and 122:
Chapter 2: Documents and Setup stan
- Page 123 and 124:
Filter Operations Apply individuall
- Page 125 and 126:
Chapter 2: Documents and Setup Bicu
- Page 127 and 128:
Auto correct Use these options to s
- Page 129 and 130:
Chapter 2: Documents and Setup sele
- Page 131 and 132:
Printing settings Chapter 2: Docume
- Page 133 and 134:
Chapter 2: Documents and Setup Prin
- Page 135 and 136:
To show or hide grids: Do one of th
- Page 137 and 138:
Chapter 2: Documents and Setup You
- Page 139 and 140:
Preferences for two-byte text entry
- Page 141 and 142:
Chapter 2: Documents and Setup pale
- Page 143 and 144:
To assign a shortcut key to a fill
- Page 145 and 146:
Chapter 2: Documents and Setup 2. C
- Page 147 and 148:
Rendering images Chapter 2: Documen
- Page 149 and 150:
To view EXIF information: 1. Select
- Page 151 and 152:
Opening PDF files Chapter 2: Docume
- Page 153 and 154:
Canvas image mode CGM image mode Gr
- Page 155 and 156:
Using Drawing Interchange format (D
- Page 157 and 158:
3. Select options in the dialog box
- Page 159 and 160:
Chapter 2: Documents and Setup Conv
- Page 161 and 162:
Chapter 2: Documents and Setup 5. I
- Page 163 and 164:
Chapter 2: Documents and Setup Web:
- Page 165 and 166:
TIFF Compression Chapter 2: Documen
- Page 167 and 168:
4. In the Save AVI Options dialog b
- Page 169 and 170:
Chapter 2: Documents and Setup 3. S
- Page 171:
Chapter 2: Documents and Setup driv
- Page 174 and 175:
Canvas 12 User Guide Working with o
- Page 176 and 177:
Canvas 12 User Guide To select all
- Page 178 and 179:
Canvas 12 User Guide Editing object
- Page 180 and 181:
Canvas 12 User Guide Using selectio
- Page 182 and 183:
Canvas 12 User Guide These options
- Page 184 and 185:
Canvas 12 User Guide Canvas places
- Page 186 and 187:
Canvas 12 User Guide Attributes pas
- Page 188 and 189:
Canvas 12 User Guide With a selecti
- Page 190 and 191:
Canvas 12 User Guide 3. As you drag
- Page 192 and 193:
Canvas 12 User Guide Replicate opti
- Page 194 and 195:
Canvas 12 User Guide After you grou
- Page 196 and 197:
Canvas 12 User Guide 1. Select the
- Page 198 and 199:
Canvas 12 User Guide To align or di
- Page 200 and 201:
Canvas 12 User Guide Horizontal Ali
- Page 202 and 203:
Canvas 12 User Guide Rotating, skew
- Page 204 and 205:
Canvas 12 User Guide To apply the H
- Page 206 and 207:
Canvas 12 User Guide You can also p
- Page 208 and 209:
Canvas 12 User Guide To skew a sele
- Page 210 and 211:
Canvas 12 User Guide Flipping objec
- Page 212 and 213:
Canvas 12 User Guide Scale options
- Page 214 and 215:
Canvas 12 User Guide To edit an obj
- Page 216 and 217:
Canvas 12 User Guide Position data
- Page 218 and 219:
Canvas 12 User Guide Choke trapping
- Page 220 and 221:
Canvas 12 User Guide objects. These
- Page 222 and 223:
Canvas 12 User Guide EasyShapes Mar
- Page 224 and 225:
Canvas 12 User Guide If you deselec
- Page 226 and 227:
Canvas 12 User Guide Generate Text
- Page 228 and 229:
Canvas 12 User Guide Define Propert
- Page 230 and 231:
Canvas 12 User Guide 214 e.g, for F
- Page 232 and 233:
Canvas 12 User Guide To add a prope
- Page 234 and 235:
Canvas 12 User Guide To select prop
- Page 236 and 237:
Canvas 12 User Guide Statistics by
- Page 238 and 239:
Canvas 12 User Guide Add Property d
- Page 240 and 241:
Canvas 12 User Guide 224
- Page 242 and 243:
Canvas 12 User Guide Fill ink Click
- Page 244 and 245:
Canvas 12 User Guide To identify in
- Page 246 and 247:
Canvas 12 User Guide icon with a di
- Page 248 and 249:
Canvas 12 User Guide Tint Color Sel
- Page 250 and 251:
Canvas 12 User Guide PANTONE When y
- Page 252 and 253:
Canvas 12 User Guide Gradient manag
- Page 254 and 255:
Canvas 12 User Guide Working with g
- Page 256 and 257:
Canvas 12 User Guide To apply gradi
- Page 258 and 259:
Canvas 12 User Guide Gradient optio
- Page 260 and 261:
Canvas 12 User Guide Working with h
- Page 262 and 263:
Canvas 12 User Guide Attribute Desc
- Page 264 and 265:
Canvas 12 User Guide Rotation The a
- Page 266 and 267:
Canvas 12 User Guide All pattern in
- Page 268 and 269:
Canvas 12 User Guide To save a Favo
- Page 270 and 271:
Canvas 12 User Guide Using the Colo
- Page 272 and 273:
Canvas 12 User Guide To select a co
- Page 274 and 275:
Canvas 12 User Guide Standard: Stro
- Page 276 and 277:
Canvas 12 User Guide Calligraphic p
- Page 278 and 279:
Canvas 12 User Guide To remove all
- Page 280 and 281:
Canvas 12 User Guide 3. Select the
- Page 282 and 283:
Canvas 12 User Guide To select a st
- Page 284 and 285:
Canvas 12 User Guide To apply taper
- Page 286 and 287:
Canvas 12 User Guide Using symbol s
- Page 288 and 289:
Canvas 12 User Guide To add setting
- Page 290 and 291:
Canvas 12 User Guide To create a ca
- Page 292 and 293:
Canvas 12 User Guide To create cust
- Page 294 and 295:
Canvas 12 User Guide 4. Select colo
- Page 296 and 297:
Canvas 12 User Guide Add Preset Cli
- Page 298 and 299:
Canvas 12 User Guide To modify clas
- Page 300 and 301:
Canvas 12 User Guide To create a da
- Page 302 and 303:
Canvas 12 User Guide Drawing basics
- Page 304 and 305:
Canvas 12 User Guide Arcs Drag from
- Page 306 and 307:
Canvas 12 User Guide 5. Move to a p
- Page 308 and 309:
Canvas 12 User Guide Press Shift an
- Page 310 and 311:
Canvas 12 User Guide Perpendicular:
- Page 312 and 313:
Canvas 12 User Guide Registration M
- Page 314 and 315:
Canvas 12 User Guide To constrain t
- Page 316 and 317:
Canvas 12 User Guide Drawing multig
- Page 318 and 319:
Canvas 12 User Guide Drawing regist
- Page 320 and 321:
Canvas 12 User Guide To use the Eas
- Page 322 and 323:
Canvas 12 User Guide Tab Length: Th
- Page 324 and 325:
Canvas 12 User Guide Smart Vector F
- Page 326 and 327:
Canvas 12 User Guide 4. Move the cu
- Page 328 and 329:
Canvas 12 User Guide To replace one
- Page 330 and 331:
Canvas 12 User Guide Loading additi
- Page 332 and 333:
Canvas 12 User Guide Formula: r=1-s
- Page 334 and 335:
Canvas 12 User Guide 318 To constra
- Page 336 and 337:
Canvas 12 User Guide Paths drawn wi
- Page 338 and 339:
Canvas 12 User Guide 5. To complete
- Page 340 and 341:
Canvas 12 User Guide Editing object
- Page 342 and 343:
Canvas 12 User Guide In general, if
- Page 344 and 345:
Canvas 12 User Guide Object path dr
- Page 346 and 347:
Canvas 12 User Guide Smooth: Availa
- Page 348 and 349:
Canvas 12 User Guide segments that
- Page 350 and 351:
Canvas 12 User Guide To use the Sci
- Page 352 and 353:
Canvas 12 User Guide You cannot cro
- Page 354 and 355:
Canvas 12 User Guide To join paths
- Page 356 and 357:
Canvas 12 User Guide 340 1. With th
- Page 358 and 359:
Canvas 12 User Guide To simultaneou
- Page 360 and 361:
Canvas 12 User Guide “holes” in
- Page 362 and 363:
Canvas 12 User Guide Original illus
- Page 364 and 365:
Canvas 12 User Guide Simplifying ve
- Page 366 and 367:
Canvas 12 User Guide 4. Do one of t
- Page 368 and 369:
Canvas 12 User Guide Geometric Expo
- Page 370 and 371:
Canvas 12 User Guide To place a 2D
- Page 372 and 373:
Canvas 12 User Guide Wireframe Disp
- Page 374 and 375:
Canvas 12 User Guide To display dim
- Page 376 and 377:
Canvas 12 User Guide To use the Cha
- Page 378 and 379:
Canvas 12 User Guide Separate Thous
- Page 380 and 381:
Canvas 12 User Guide Style and Text
- Page 382 and 383:
Canvas 12 User Guide 3. Click the R
- Page 384 and 385:
Canvas 12 User Guide For this const
- Page 386 and 387:
Canvas 12 User Guide To view the po
- Page 388 and 389:
Canvas 12 User Guide About the vani
- Page 390 and 391:
Canvas 12 User Guide The Effects |
- Page 392 and 393:
Canvas 12 User Guide Editing clippi
- Page 394 and 395:
Canvas 12 User Guide 378 Original o
- Page 396 and 397:
Canvas 12 User Guide 380 Create and
- Page 398 and 399:
Canvas 12 User Guide Artists often
- Page 400 and 401:
Canvas 12 User Guide Enveloping obj
- Page 402 and 403:
Canvas 12 User Guide Envelope style
- Page 404 and 405:
Canvas 12 User Guide Parallel prese
- Page 406 and 407:
Canvas 12 User Guide Extrude option
- Page 408 and 409:
Canvas 12 User Guide 1. Rotate an e
- Page 410 and 411:
Canvas 12 User Guide Fractalize opt
- Page 412 and 413:
Canvas 12 User Guide Shadow options
- Page 414 and 415:
Canvas 12 User Guide To change the
- Page 416 and 417:
Canvas 12 User Guide Canvas searche
- Page 418 and 419:
Canvas 12 User Guide Save your new
- Page 420 and 421:
Canvas 12 User Guide 404 3. In the
- Page 422 and 423:
Canvas 12 User Guide Painting & ima
- Page 424 and 425:
Canvas 12 User Guide A paint object
- Page 426 and 427:
Canvas 12 User Guide Working with p
- Page 428 and 429:
Canvas 12 User Guide To set paintin
- Page 430 and 431:
Canvas 12 User Guide Tolerance The
- Page 432 and 433:
Canvas 12 User Guide Copying areas
- Page 434 and 435:
Canvas 12 User Guide Lightening (
- Page 436 and 437:
Canvas 12 User Guide To use the Spo
- Page 438 and 439:
Canvas 12 User Guide New brush opti
- Page 440 and 441:
Canvas 12 User Guide To set the for
- Page 442 and 443:
Canvas 12 User Guide Mode Function
- Page 444 and 445:
Canvas 12 User Guide Fat Bits When
- Page 446 and 447:
Canvas 12 User Guide A rectangle an
- Page 448 and 449:
Canvas 12 User Guide Width and Heig
- Page 450 and 451:
Canvas 12 User Guide 1. Choose File
- Page 452 and 453:
Canvas 12 User Guide How Canvas ass
- Page 454 and 455:
Canvas 12 User Guide Indexed image
- Page 456 and 457:
Canvas 12 User Guide Web browsers.
- Page 458 and 459:
Canvas 12 User Guide CMYK Color ima
- Page 460 and 461:
Canvas 12 User Guide Duotone option
- Page 462 and 463:
Canvas 12 User Guide To use the Red
- Page 464 and 465:
Canvas 12 User Guide Are you scanni
- Page 466 and 467:
Canvas 12 User Guide 3. Click a squ
- Page 468 and 469:
Canvas 12 User Guide To trim an ima
- Page 470 and 471:
Canvas 12 User Guide To restore a c
- Page 472 and 473:
Canvas 12 User Guide Changing resol
- Page 474 and 475:
Canvas 12 User Guide To calculate r
- Page 476 and 477:
Canvas 12 User Guide Auto Trace set
- Page 478 and 479:
Canvas 12 User Guide You can apply
- Page 480 and 481:
Canvas 12 User Guide Original RGB i
- Page 482 and 483:
Canvas 12 User Guide Original RGB I
- Page 484 and 485:
Canvas 12 User Guide 4. Enter a Con
- Page 486 and 487:
Canvas 12 User Guide Levels dialog
- Page 488 and 489:
Canvas 12 User Guide Saving and loa
- Page 490 and 491:
Canvas 12 User Guide lightness leve
- Page 492 and 493:
Canvas 12 User Guide Motion Blur Th
- Page 494 and 495:
Canvas 12 User Guide Radial Blur di
- Page 496 and 497:
Canvas 12 User Guide To sharpen an
- Page 498 and 499:
Canvas 12 User Guide To use the Des
- Page 500 and 501:
Canvas 12 User Guide Selection bord
- Page 502 and 503:
Canvas 12 User Guide To make a circ
- Page 504 and 505:
Canvas 12 User Guide To use the Wan
- Page 506 and 507:
Canvas 12 User Guide Selecting unse
- Page 508 and 509:
Canvas 12 User Guide Image after ta
- Page 510 and 511:
Canvas 12 User Guide Keep in mind t
- Page 512 and 513:
Canvas 12 User Guide Deselecting an
- Page 514 and 515:
Canvas 12 User Guide To modify an a
- Page 516 and 517:
Canvas 12 User Guide The accuracy o
- Page 518 and 519:
Canvas 12 User Guide Option Result
- Page 520 and 521:
Canvas 12 User Guide Using the Chan
- Page 522 and 523:
Canvas 12 User Guide Channel Option
- Page 524 and 525:
Canvas 12 User Guide Activating cha
- Page 526 and 527:
Canvas 12 User Guide To create a ch
- Page 528 and 529:
Canvas 12 User Guide When you detac
- Page 530 and 531:
Canvas 12 User Guide When you make
- Page 532 and 533:
Canvas 12 User Guide Image with tra
- Page 534 and 535:
Canvas 12 User Guide 518 Color chan
- Page 536 and 537:
Canvas 12 User Guide paint objects
- Page 538 and 539:
Canvas 12 User Guide To solarize an
- Page 540 and 541:
Canvas 12 User Guide Offsetting sel
- Page 542 and 543:
Canvas 12 User Guide 5. Turn on Pre
- Page 544 and 545:
Canvas 12 User Guide Ripple example
- Page 546 and 547:
Canvas 12 User Guide Spherical dist
- Page 548 and 549:
Canvas 12 User Guide No Anti-Alias
- Page 550 and 551:
Canvas 12 User Guide Lens Flare dia
- Page 552 and 553:
Canvas 12 User Guide 536 Before Sta
- Page 554 and 555:
Canvas 12 User Guide Bevel dialog b
- Page 556 and 557:
Canvas 12 User Guide Editing with P
- Page 558 and 559:
Canvas 12 User Guide Blurred image
- Page 560 and 561:
Canvas 12 User Guide Original bitma
- Page 562 and 563:
Canvas 12 User Guide Opacity Adjust
- Page 564 and 565:
Canvas 12 User Guide To combine cha
- Page 566 and 567:
Canvas 12 User Guide Examples of Ca
- Page 568 and 569:
Canvas 12 User Guide Replacing an i
- Page 570 and 571:
Canvas 12 User Guide Make sure when
- Page 572 and 573:
Canvas 12 User Guide To replace a p
- Page 574 and 575:
Canvas 12 User Guide To update all
- Page 576 and 577:
Canvas 12 User Guide Text entry & l
- Page 578 and 579:
Canvas 12 User Guide To type text w
- Page 580 and 581:
Canvas 12 User Guide To create an e
- Page 582 and 583:
Canvas 12 User Guide Using Vertical
- Page 584 and 585:
Canvas 12 User Guide Sections make
- Page 586 and 587:
Canvas 12 User Guide To create sect
- Page 588 and 589:
Canvas 12 User Guide Displaying col
- Page 590 and 591:
Canvas 12 User Guide Defining text
- Page 592 and 593:
Canvas 12 User Guide To check a tex
- Page 594 and 595:
Canvas 12 User Guide To select all
- Page 596 and 597:
Canvas 12 User Guide Applying text
- Page 598 and 599:
Canvas 12 User Guide Specifying fon
- Page 600 and 601:
Canvas 12 User Guide To set type si
- Page 602 and 603:
Canvas 12 User Guide Canvas does no
- Page 604 and 605:
Canvas 12 User Guide Tab menu Left:
- Page 606 and 607:
Canvas 12 User Guide Applying parag
- Page 608 and 609:
Canvas 12 User Guide Before paragra
- Page 610 and 611:
Canvas 12 User Guide Type options L
- Page 612 and 613:
Canvas 12 User Guide 3. Click Apply
- Page 614 and 615:
Canvas 12 User Guide To apply parag
- Page 616 and 617:
Canvas 12 User Guide so that each l
- Page 618 and 619:
Canvas 12 User Guide Widow Turn on
- Page 620 and 621:
Canvas 12 User Guide To insert head
- Page 622 and 623:
Canvas 12 User Guide To open the Ty
- Page 624 and 625:
Canvas 12 User Guide Create Type St
- Page 626 and 627:
Canvas 12 User Guide Using type sty
- Page 628 and 629:
Canvas 12 User Guide To delete a st
- Page 630 and 631:
Canvas 12 User Guide To enter edit
- Page 632 and 633:
Canvas 12 User Guide "Text edit mod
- Page 634 and 635:
Canvas 12 User Guide Finding and ch
- Page 636 and 637:
Canvas 12 User Guide box and attrib
- Page 638 and 639:
Canvas 12 User Guide Inserting spec
- Page 640 and 641:
Canvas 12 User Guide 4. Click in th
- Page 642 and 643:
Canvas 12 User Guide Showing and hi
- Page 644 and 645:
Canvas 12 User Guide Replace Click
- Page 646 and 647:
Canvas 12 User Guide To place text
- Page 648 and 649:
Canvas 12 User Guide Applying inks
- Page 650 and 651:
Canvas 12 User Guide Wrapping and r
- Page 652 and 653:
Canvas 12 User Guide An object with
- Page 654 and 655:
Canvas 12 User Guide This text is c
- Page 656 and 657:
Canvas 12 User Guide Bind Position
- Page 658 and 659:
Canvas 12 User Guide To create a ci
- Page 660 and 661:
Canvas 12 User Guide To freeform ed
- Page 662 and 663:
Canvas 12 User Guide You cannot edi
- Page 664 and 665:
Canvas 12 User Guide 2. Click the p
- Page 666 and 667:
Canvas 12 User Guide SpriteEffects
- Page 668 and 669:
Canvas 12 User Guide which are in t
- Page 670 and 671:
Canvas 12 User Guide To save effect
- Page 672 and 673:
Canvas 12 User Guide The Mode optio
- Page 674 and 675:
Canvas 12 User Guide outline. Also,
- Page 676 and 677:
Canvas 12 User Guide In the SpriteE
- Page 678 and 679:
Canvas 12 User Guide Setting a lens
- Page 680 and 681:
Canvas 12 User Guide 1. Select the
- Page 682 and 683:
Canvas 12 User Guide Save a documen
- Page 684 and 685:
Canvas 12 User Guide Opacity affect
- Page 686 and 687:
Canvas 12 User Guide Consider a gro
- Page 688 and 689:
Canvas 12 User Guide To turn off th
- Page 690 and 691:
Canvas 12 User Guide Masked object
- Page 692 and 693:
Canvas 12 User Guide If the paint o
- Page 694 and 695:
Canvas 12 User Guide When you detac
- Page 696 and 697:
Canvas 12 User Guide To create a ve
- Page 698 and 699:
Canvas 12 User Guide mask. 2. Drag
- Page 700 and 701:
Canvas 12 User Guide Setting node o
- Page 702 and 703:
Canvas 12 User Guide Color modes Ov
- Page 704 and 705:
Canvas 12 User Guide If a transpare
- Page 706 and 707: Canvas 12 User Guide Designing for
- Page 708 and 709: Canvas 12 User Guide Link Manager p
- Page 710 and 711: Canvas 12 User Guide Apply Click th
- Page 712 and 713: Canvas 12 User Guide With page link
- Page 714 and 715: Canvas 12 User Guide You can enter
- Page 716 and 717: Canvas 12 User Guide We suggest tha
- Page 718 and 719: Canvas 12 User Guide Using the Slic
- Page 720 and 721: Canvas 12 User Guide Certain slice
- Page 722 and 723: Canvas 12 User Guide Slice operatio
- Page 724 and 725: Canvas 12 User Guide Force default
- Page 726 and 727: Canvas 12 User Guide To modify a We
- Page 728 and 729: Canvas 12 User Guide To add buttons
- Page 730 and 731: Canvas 12 User Guide Optimize frame
- Page 732 and 733: Canvas 12 User Guide 716 CSS2 (Casc
- Page 734 and 735: Canvas 12 User Guide Metatags When
- Page 736 and 737: Canvas 12 User Guide 5. Select an a
- Page 738 and 739: Canvas 12 User Guide Save these set
- Page 740 and 741: Canvas 12 User Guide Transparency U
- Page 742 and 743: Canvas 12 User Guide Shape: Specifi
- Page 744 and 745: Canvas 12 User Guide Unicode text e
- Page 746 and 747: Canvas 12 User Guide speaker notes.
- Page 748 and 749: Canvas 12 User Guide Remember to fi
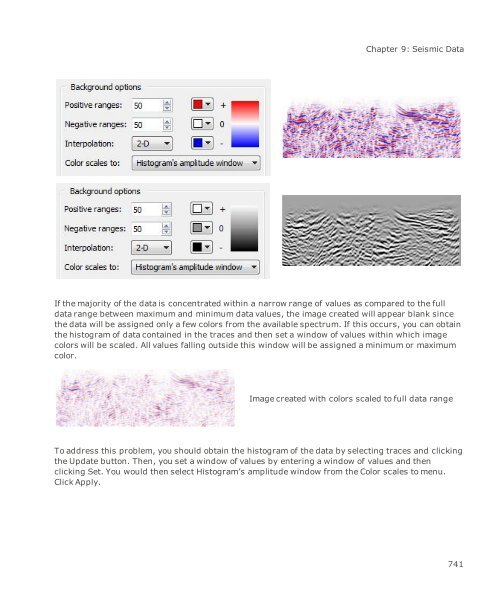
- Page 751 and 752: Chapter 9: Seismic Data
- Page 753 and 754: %: Select a percentage for scaling
- Page 755: Wiggle options Chapter 9: Seismic D
- Page 759 and 760: Chapter 10: Visualization And Analy
- Page 761 and 762: Chapter 10: Visualization And Analy
- Page 763 and 764: Raw Image Export Options dialog box
- Page 765 and 766: Chapter 10: Visualization And Analy
- Page 767 and 768: Original image Image with Erode fil
- Page 769 and 770: Outline Chapter 10: Visualization A
- Page 771 and 772: Scientific filters Chapter 10: Visu
- Page 773 and 774: Using the Colorize filter Chapter 1
- Page 775 and 776: Operation Explanation Chapter 10: V
- Page 777 and 778: Chapter 10: Visualization And Analy
- Page 779 and 780: To load a kernel: 1. Click on the m
- Page 781 and 782: Image Data Viewer dialog box Chapte
- Page 783: Image Measurement Properties Select
- Page 786 and 787: Canvas 12 User Guide System Require
- Page 788 and 789: Canvas 12 User Guide 772 _ _blank 6
- Page 790 and 791: Canvas 12 User Guide 774 applying a
- Page 792 and 793: Canvas 12 User Guide 776 dynamic 38
- Page 794 and 795: Canvas 12 User Guide 778 channels p
- Page 796 and 797: Canvas 12 User Guide 780 Lab 121 mo
- Page 798 and 799: Canvas 12 User Guide 782 dust and s
- Page 800 and 801: Canvas 12 User Guide 784 repeating
- Page 802 and 803: Canvas 12 User Guide 786 convert cu
- Page 804 and 805: Canvas 12 User Guide 788 strokes 12
- Page 806 and 807:
Canvas 12 User Guide 790 rotate 187
- Page 808 and 809:
Canvas 12 User Guide 792 orientatio
- Page 810 and 811:
Canvas 12 User Guide 794 masks 667
- Page 812 and 813:
Canvas 12 User Guide 796 file trans
- Page 814 and 815:
Canvas 12 User Guide 798 frame stro
- Page 816 and 817:
Canvas 12 User Guide 800 hotkeys 11
- Page 818 and 819:
Canvas 12 User Guide 802 importing
- Page 820 and 821:
Canvas 12 User Guide Knife tool 334
- Page 822 and 823:
Canvas 12 User Guide 806 managers d
- Page 824 and 825:
Canvas 12 User Guide 808 none (sele
- Page 826 and 827:
Canvas 12 User Guide 810 opening Ca
- Page 828 and 829:
Canvas 12 User Guide 812 Sharpen 41
- Page 830 and 831:
Canvas 12 User Guide 814 halftone s
- Page 832 and 833:
Canvas 12 User Guide 816 transparen
- Page 834 and 835:
Canvas 12 User Guide 818 RGB color
- Page 836 and 837:
Canvas 12 User Guide 820 Canvas doc
- Page 838 and 839:
Canvas 12 User Guide 822 properties
- Page 840 and 841:
Canvas 12 User Guide 824 spell chec
- Page 842 and 843:
Canvas 12 User Guide SVG options di
- Page 844 and 845:
Canvas 12 User Guide 828 paragraph
- Page 846 and 847:
Canvas 12 User Guide 830 Crop 452 C
- Page 848 and 849:
Canvas 12 User Guide 832 SpriteLaye
- Page 850 and 851:
Canvas 12 User Guide 834 vector mas
- Page 852:
Serial number © 2006-2010 ACD Syst