Rexam PLC Annual Report 2011
Rexam PLC Annual Report 2011
Rexam PLC Annual Report 2011

Create successful ePaper yourself
Turn your PDF publications into a flip-book with our unique Google optimized e-Paper software.
18 <strong>Rexam</strong> annual report <strong>2011</strong> directors’ report<br />
market review<br />
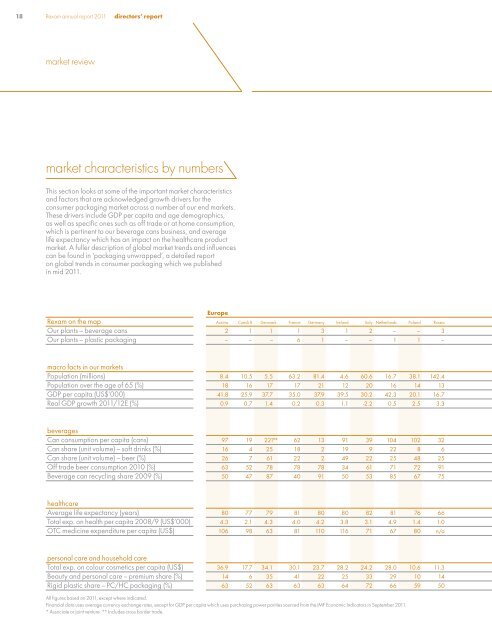
market characteristics by numbers<br />
This section looks at some of the important market characteristics<br />
and factors that are acknowledged growth drivers for the<br />
consumer packaging market across a number of our end markets.<br />
These drivers include GDP per capita and age demographics,<br />
as well as specific ones such as off trade or at home consumption,<br />
which is pertinent to our beverage cans business, and average<br />
life expectancy which has an impact on the healthcare product<br />
market. A fuller description of global market trends and influences<br />
can be found in ‘packaging unwrapped’, a detailed report<br />
on global trends in consumer packaging which we published<br />
in mid <strong>2011</strong>.<br />
Europe<br />
<strong>Rexam</strong> on the map Austria Czech R Denmark France Germany Ireland Italy Netherlands Poland Russia<br />
Our plants – beverage cans 2 1 1 1 3 1 2 – – 3<br />
Our plants – plastic packaging – – – 6 1 – – 1 1 –<br />
macro facts in our markets<br />
Population (millions) 8.4 10.5 5.5 63.2 81.4 4.6 60.6 16.7 38.1 142.4<br />
Population over the age of 65 (%) 18 16 17 17 21 12 20 16 14 13<br />
GDP per capita (US$’000) 41.8 25.9 37.7 35.0 37.9 39.5 30.2 42.3 20.1 16.7<br />
Real GDP growth <strong>2011</strong>/12E (%) 0.9 0.7 1.4 0.2 0.3 1.1 -2.2 0.5 2.5 3.3<br />
beverages<br />
Can consumption per capita (cans) 97 19 221** 62 13 91 39 104 102 32<br />
Can share (unit volume) – soft drinks (%) 16 4 25 18 2 19 9 22 8 6<br />
Can share (unit volume) – beer (%) 26 7 61 22 2 49 22 25 48 25<br />
Off trade beer consumption 2010 (%) 63 52 78 78 78 34 61 71 72 91<br />
Beverage can recycling share 2009 (%) 50 47 87 40 91 50 53 85 67 75<br />
healthcare<br />
Average life expectancy (years) 80 77 79 81 80 80 82 81 76 66<br />
Total exp. on health per capita 2008/9 (US$’000) 4.3 2.1 4.3 4.0 4.2 3.8 3.1 4.9 1.4 1.0<br />
OTC medicine expenditure per capita (US$) 106 98 63 81 110 116 71 67 80 n/a<br />
personal care and household care<br />
Total exp. on colour cosmetics per capita (US$) 36.9 17.7 34.1 30.1 23.7 28.2 24.2 28.0 10.6 11.3<br />
Beauty and personal care – premium share (%) 14 6 35 41 22 25 33 29 10 14<br />
Rigid plastic share – PC/HC packaging (%) 63 52 63 63 63 64 72 66 59 50<br />
All figures based on <strong>2011</strong>, except where indicated.<br />
Financial data uses average currency exchange rates, except for GDP per capita which uses purchasing power parities sourced from the IMF Economic Indicators in September <strong>2011</strong>.<br />
* Associate or joint venture. ** Includes cross border trade.