Property Times European Logistics H1 2011 - DTZ
Property Times European Logistics H1 2011 - DTZ
Property Times European Logistics H1 2011 - DTZ

Create successful ePaper yourself
Turn your PDF publications into a flip-book with our unique Google optimized e-Paper software.
30 September <strong>2011</strong><br />
Contents<br />
Executive summary 1<br />
Economic overview 2-4<br />
Retail, E-retail & logistics 5<br />
Investment market 6-7<br />
Fair value index 8-9<br />
Occupier market<br />
<strong>European</strong> overview 10-12<br />
Market overview 13-26<br />
United Kingdom 13<br />
Ireland 14<br />
Belgium 15<br />
France 16<br />
Germany 17<br />
Netherlands 18<br />
Italy & Spain 19<br />
Nordics & Sweden 20<br />
CEE 21<br />
Poland 22<br />
Czech Republic 23<br />
Hungary & Romania 24<br />
Ukraine & Russia 25<br />
Middle East - Dubai 26<br />
Definitions 28<br />
Contacts 29<br />
Authors<br />
Magali Marton<br />
Head of CEMEA Research<br />
+33 (0)1 49 64 49 54<br />
magali.marton@dtz.com<br />
Matthew Hall<br />
Forecasting & Strategy Research<br />
+44 (0)20 3296 3011<br />
matthew.hall@dtz.com<br />
Contacts<br />
Tony McGough<br />
Forecasting & Strategy Research<br />
+44 (0)20 3296 2314<br />
tony.mcgough@dtz.com<br />
Hans Vrensen<br />
Global Head of Research<br />
+44 (0)20 3296 2159<br />
hans.vrensen@dtz.com<br />
<strong>Property</strong> <strong>Times</strong><br />
<strong>European</strong> <strong>Logistics</strong> <strong>H1</strong> <strong>2011</strong><br />
Good results in <strong>H1</strong> but<br />
uncertainty predicted in H2<br />
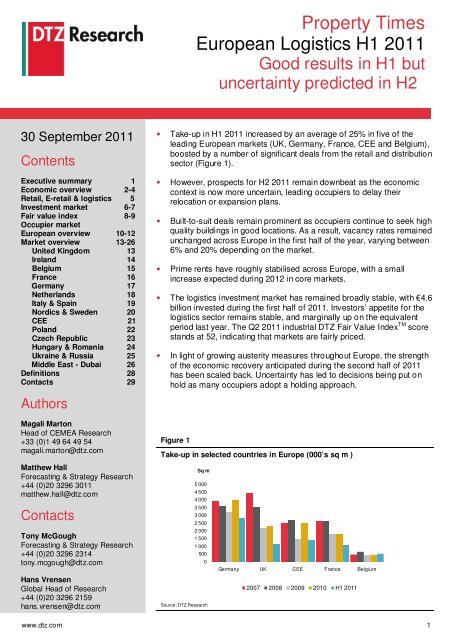
• Take-up in <strong>H1</strong> <strong>2011</strong> increased by an average of 25% in five of the<br />
leading <strong>European</strong> markets (UK, Germany, France, CEE and Belgium),<br />
boosted by a number of significant deals from the retail and distribution<br />
sector (Figure 1).<br />
• However, prospects for H2 <strong>2011</strong> remain downbeat as the economic<br />
context is now more uncertain, leading occupiers to delay their<br />
relocation or expansion plans.<br />
• Built-to-suit deals remain prominent as occupiers continue to seek high<br />
quality buildings in good locations. As a result, vacancy rates remained<br />
unchanged across Europe in the first half of the year, varying between<br />
6% and 20% depending on the market.<br />
• Prime rents have roughly stabilised across Europe, with a small<br />
increase expected during 2012 in core markets.<br />
• The logistics investment market has remained broadly stable, with €4.6<br />
billion invested during the first half of <strong>2011</strong>. Investors’ appetite for the<br />
logistics sector remains stable, and marginally up on the equivalent<br />
period last year. The Q2 <strong>2011</strong> industrial <strong>DTZ</strong> Fair Value Index TM score<br />
stands at 52, indicating that markets are fairly priced.<br />
• In light of growing austerity measures throughout Europe, the strength<br />
of the economic recovery anticipated during the second half of <strong>2011</strong><br />
has been scaled back. Uncertainty has led to decisions being put on<br />
hold as many occupiers adopt a holding approach.<br />
Figure 1<br />
Take-up in selected countries in Europe (000’s sq m )<br />
Sq m<br />
5 000<br />
4 500<br />
4 000<br />
3 500<br />
3 000<br />
2 500<br />
2 000<br />
1 500<br />
1 000<br />
500<br />
0<br />
Source: <strong>DTZ</strong> Research<br />
Germany UK CEE France Belgium<br />
2007 2008 2009 2010 <strong>H1</strong> <strong>2011</strong><br />
www.dtz.com 1
Economic overview<br />
The improvement in the <strong>European</strong> economic<br />
environment has not lasted the summer as<br />
concerns over the debt crisis are rising. Market<br />
conditions will become more challenging with an<br />
increasingly mixed pictured of economic trends<br />
across Europe.<br />
• Stress tests of the banking system, debt crisis in<br />
Europe, inability of governments to restore market<br />
confidence and downgrading of the US economy: the<br />
global and <strong>European</strong> economy has entered into a<br />
new phase. <strong>European</strong> businesses continue to face<br />
challenging credit conditions as banks are still<br />
cautious about their loan policies.<br />
Restrictive credit conditions will continue to weigh on<br />
consumption and investment, and as a result<br />
industrial production, consumption and retail sales<br />
remain slow across Europe.<br />
• The debt crisis has forced governments in many<br />
<strong>European</strong> countries to put in place austerity<br />
packages to reduce their fiscal deficit. Furthermore,<br />
most of Europe is also facing a reduction in<br />
government led growth, as a result of a slowdown in<br />
private sector demand. In this context, <strong>European</strong><br />
GDP forecasts have been downgraded to 1.9% in<br />
<strong>2011</strong> and 1.6% in 2012 (Figure 2).<br />
• In Europe, those countries most affected by the debt<br />
crisis will post negative GDP growth in <strong>2011</strong> while<br />
Germany, the Nordics and CEE continue to<br />
outperform the <strong>European</strong> average (Figure 3). Neither<br />
the Nordics nor the CEE are part of the Eurozone,<br />
enabling control over monetary policy and hence,<br />
exchange rates. Neither region has particularly high<br />
levels of national debt requiring austerity measures.<br />
• After a strong rebound in 2010, a modest 6.4%<br />
increase of trade growth is anticipated for <strong>2011</strong>,<br />
However, uncertainty remains over the impact of a<br />
number of recent events, including the earthquake<br />
and tsunami in Japan. If achieved, this would be<br />
higher than the 6.0% average yearly increase<br />
witnessed between 1990 and 2008.<br />
Figure 2<br />
GDP growth 2007-2010 and forecasts <strong>2011</strong>-2014<br />
www.dtz.com 2<br />
%<br />
8<br />
6<br />
4<br />
2<br />
0<br />
-2<br />
-4<br />
-6<br />
2007 2008 2009 2010 <strong>2011</strong>F 2012F 2013F 2014F<br />
Asia Pacific Eurozone United States<br />
Source: Oxford Economics<br />
Figure 3<br />
GDP growth and growth forecasts in selected<br />
<strong>European</strong> countries<br />
%<br />
4<br />
4<br />
3<br />
3<br />
2<br />
2<br />
1<br />
1<br />
0<br />
<strong>2011</strong>F 2012F 2013F 2014F<br />
France Germany Nordics<br />
United Kingdom Eurozone<br />
Source: Oxford Economics<br />
Figure 4<br />
Merchandise exports by region, 2007-<strong>2011</strong><br />
%<br />
20<br />
15<br />
10<br />
5<br />
0<br />
-5<br />
-10<br />
-15<br />
-20<br />
Source: WTO<br />
14,5<br />
6,4<br />
12,9<br />
World Developed<br />
economies<br />
4,5<br />
16,7<br />
9,5<br />
Developing<br />
economies and<br />
CIS<br />
2007 2008 2009 2010 <strong>2011</strong>F
Economic overview<br />
• Industrial production forecasts suggest that Europe<br />
will be polarised in the short term: Germany, CEE<br />
and the Nordics growing by between 7% and 9% in<br />
<strong>2011</strong> - whilst the UK and France remain well below<br />
the Eurozone average of 5.7% (Figure 5). However,<br />
the latest PMI (Purchasing Manager Index) published<br />
in August <strong>2011</strong> has clearly shown declining<br />
confidence in the industrial sector, posting the<br />
second weakest rate of expansion since the recovery<br />
began in August 2009.<br />
• Consumer confidence has also declined across<br />
Europe with an increasingly negative balance of<br />
opinions, down to -16.5% from -11% in December<br />
2010 (Figure 6). Pressure is increasing on<br />
governments to accelerate austerity programs and<br />
reduce public debt. This is acting as a further drag on<br />
consumer confidence as employees tighten their<br />
belts. This is anticipated to have a significant impact<br />
on the retail sector as consumer spending is forecast<br />
to bear the brunt of austerity measures.<br />
• Consumer spending in Europe will remain subdued in<br />
the medium term with 1.2% pa expected between<br />
<strong>2011</strong> and 2014 (Figure 7). The three major<br />
economies – UK, France and Germany – are slightly<br />
above the regional average whilst CEE and Nordics<br />
will outperform with between 2% and 3% pa over the<br />
same period. There, domestic demand is supported<br />
by strong GDP growth and limited exposure to<br />
austerity measures.<br />
• In conclusion, the logistics market in Europe will be<br />
driven by two opposing economic trends: firstly,<br />
strong prospects for CEE and the Nordics on both<br />
the industrial and consumer side, and secondly,<br />
direct or indirect impacts of austerity measures<br />
across the region. A degradation of the general<br />
sentiment has already become apparent, leading<br />
industrial and logistics companies to act with caution<br />
regarding their expansion or relocation plans.<br />
Figure 5<br />
Industrial production in selected <strong>European</strong> countries<br />
www.dtz.com 3<br />
%<br />
15<br />
10<br />
5<br />
0<br />
-5<br />
-10<br />
-15<br />
-20<br />
2007 2008 2009 2010 <strong>2011</strong>F 2012F 2013F 2014F<br />
CEE France Germany<br />
Nordics United Kingdom Eurozone<br />
Source: Oxford Economics<br />
Figure 6<br />
Eurozone business & consumer confidence<br />
(% balance)<br />
% Balance<br />
1,6<br />
1,4<br />
1,2<br />
1<br />
0,8<br />
0,6<br />
0,4<br />
0,2<br />
0<br />
Source: Oxford Economics<br />
Figure 7<br />
Business (LHS) Consumer (RHS)<br />
0<br />
-2<br />
-4<br />
-6<br />
-8<br />
-10<br />
-12<br />
-14<br />
-16<br />
-18<br />
Consumer spending in selected <strong>European</strong> countries<br />
%<br />
6<br />
4<br />
2<br />
0<br />
-2<br />
-4<br />
-6<br />
2007 2008 2009 2010 <strong>2011</strong>F 2012F 2013F 2014F<br />
CEE France Germany<br />
Nordics United Kingdom Eurozone<br />
Source: Oxford Economics
Economic overview<br />
Figure 8<br />
GDP growth in <strong>2011</strong><br />
GDP growth in <strong>2011</strong><br />
-4.8% - 0%<br />
0.1% - 2.0%<br />
2.1% - 4.0%<br />
4.1% - 6.4%<br />
No data<br />
Portugal<br />
Ireland<br />
Spain<br />
United Kingdom<br />
Source : <strong>DTZ</strong> Research, ESRI, Oxford Economics<br />
Source: Oxford Economics<br />
France<br />
Belgium<br />
Denmark<br />
Netherlands<br />
Luxembourg<br />
Norway<br />
Germany<br />
Switzerland<br />
Sweden<br />
Czech Republic<br />
Italy<br />
Austria<br />
• Figure 8 illustrates the GDP growth anticipated for<br />
<strong>2011</strong>. The 3 major economies – the UK, France and<br />
Germany – will see their GDP figures grow. Germany<br />
will lead with 3.5% growth expected, followed by<br />
France (2.2%) and the UK (1.4%).<br />
Bosnia and Herzegovina<br />
Serbia<br />
Montenegro Kosovo<br />
Russian Federation<br />
www.dtz.com 4<br />
Poland<br />
Slovenia<br />
Croatia<br />
Malta<br />
Slovakia<br />
Hungary<br />
Albania<br />
Finland<br />
Estonia<br />
Latvia<br />
Lithuania<br />
FYR of Macedonia<br />
Greece<br />
Romania<br />
Belarus<br />
Bulgaria<br />
Ukraine<br />
Republic of Moldova<br />
Turkey<br />
Cyprus<br />
• GDP growth is expected to be strongest in the<br />
Nordics and CEE, especially in Poland, Russia and<br />
Turkey, while the PIIGS struggle well below the<br />
<strong>European</strong> average (1.9%).
Retail, E-retail & logistics<br />
Retail & <strong>Logistics</strong><br />
• Although retail sales growth was still in negative<br />
territory at the end of 2010, the declines are much<br />
shallower than in 2009. By the end of <strong>2011</strong>, all the<br />
major markets in Europe are forecast to return to<br />
retail sales growth, with the exceptions of Greece,<br />
Spain, Portugal and Italy (Figure 9).<br />
• As a result of the downturn, retailers have become<br />
extremely selective on their choice of stores and<br />
locations, favouring larger units in new retail formats<br />
located in city centres. These changes, mainly<br />
prevalent in the food sector, will impact their supply<br />
chain and, ultimately, their logistics requirements.<br />
• Increased efficiency in the supply chain and cost<br />
cutting measures will drive retailers and their third<br />
party providers to review their existing networks in<br />
two ways: by relocating to main distribution hubs<br />
across Europe in order to take advantage of good<br />
locations for both production and distribution, and by<br />
identifying hot spots at a local level for the distribution<br />
of goods to the consumers.<br />
E-retail & logistics<br />
• E-commerce is one of the fastest-growing sectors in<br />
Europe, with an average increase of 5.9% during<br />
2010. Online sales are forecast to increase by 14% in<br />
the UK this year. In continental Europe, the pace of<br />
the online retail growth will be higher, ranging from<br />
15% in Germany to a record level of 33.5% in Poland<br />
(Figure 10). Consequently, the market share of online<br />
sales will grow to represent 12% in the UK, and an<br />
average of 6% in Continental Europe.<br />
• The anticipation of business growth linked to eretailing<br />
has already generated new orders from eretailers<br />
in UK, France and more recently Germany,<br />
where Amazon has signed the two biggest<br />
transactions of <strong>H1</strong> <strong>2011</strong>. E-retailer requirements are<br />
focused on large logistics schemes on the periphery<br />
but also medium and small sized warehouses close<br />
to town centres for “last mile” distribution.<br />
Figure 9<br />
Retail sales annual forecasts (<strong>2011</strong>-2020) in Europe<br />
Source: Oxford Economics<br />
Figure 10<br />
Forecast growth in online sales, <strong>2011</strong><br />
Poland<br />
www.dtz.com 5<br />
50<br />
40<br />
30<br />
20<br />
10<br />
0<br />
% increase<br />
online<br />
sales 2010-<br />
<strong>2011</strong><br />
Italy<br />
Spain<br />
France<br />
Switzerland<br />
Benelux<br />
UK<br />
Germany<br />
0 3 6 9 12 15<br />
<strong>2011</strong> online share of all retail business (%)<br />
Source: Centre for Retail Research
Investment Market<br />
High investment volumes in the Nordic and<br />
CEE countries.<br />
• The logistics investment market has remained<br />
broadly stable in the first half of <strong>2011</strong> – with €4.6<br />
billion invested. This level is roughly in line with the<br />
€8.4 billion invested during the whole of 2010. As<br />
highlighted previously, the recovery in the logistics<br />
investment market is still on track, but at a slower<br />
pace than the global market, which registered a 13%<br />
increase during the same period.<br />
• The proportion of industrial and logistics assets in<br />
global investment volumes grew by 10% in <strong>H1</strong> <strong>2011</strong>,<br />
up from the 8% recorded in 2010. Despite this<br />
increase in market share, the logistics sector remains<br />
secondary to the market recovery witnessed in the<br />
retail and office sectors.<br />
• The UK market has the highest investment volume in<br />
Europe with €1.3 billion, representing 29% of<br />
<strong>European</strong> deals during <strong>H1</strong> <strong>2011</strong> (Figure 12). Strong<br />
performance in the UK market is mainly linked to<br />
several portfolio purchases and a strong activity in<br />
the €20-50 million range.<br />
• The German investment market remains dynamic<br />
with volumes close to €800 million, well on track to<br />
exceed the €1.2 billion transacted during 2010. Two<br />
deals above €100 million were registered, including<br />
one by Goodman on the ING's Industrial Fund<br />
portfolio (11 properties representing 367,091 sq m<br />
located in or in the vicinity of Bremen and Berlin).<br />
• Market activity has remained subdued in France with<br />
less than €300 million invested, while the CEE<br />
markets registered their best performance in over a<br />
decade with €450 million invested. This strong<br />
performance is mainly linked to the €272 million<br />
Europolis portfolio deal.<br />
• After its peak of H2 2010, with €1.1 billion transacted,<br />
the Nordics has maintained its high performance by<br />
posting one of the highest levels of investment<br />
volumes recorded in <strong>H1</strong> <strong>2011</strong> – near €900 million.<br />
Local investors showed strong demand for logistics<br />
assets ranging between €20 and €100 million.<br />
Figure 11<br />
<strong>European</strong> investment activity in logistics<br />
www.dtz.com 6<br />
Bn €<br />
18<br />
16<br />
14<br />
12<br />
10<br />
8<br />
6<br />
4<br />
2<br />
0<br />
Source: <strong>DTZ</strong> Research<br />
Figure 12<br />
12%<br />
10%<br />
8%<br />
6%<br />
4%<br />
2%<br />
0%<br />
<strong>Logistics</strong> investment Share of logistics investment<br />
<strong>Logistics</strong> investment volume in Europe<br />
18<br />
16<br />
14<br />
12<br />
10<br />
8<br />
6<br />
4<br />
2<br />
0<br />
UK France Germany CEE Nordics Others<br />
Source: <strong>DTZ</strong> Research
Investment Market<br />
Prime yields stabilizing in the UK and<br />
French markets; elsewhere compression is<br />
ongoing<br />
• Contrasting trends between prime <strong>European</strong> logistics<br />
yields have been observed in <strong>H1</strong> <strong>2011</strong>. After strong<br />
compression in 2010, yields in the UK, Sweden and<br />
France have stabilised or increased slightly.<br />
Elsewhere compression is still ongoing but at a<br />
varied pace, depending on the country considered.<br />
Compression is slow in Brussels (-150 bps) and<br />
Germany (-100 bps), as the yields are approaching<br />
their lowest point and more pronounced in Warsaw (-<br />
250 bps), and CEE, where compression has just<br />
begun (Figure 13).<br />
• The range of prime logistics yields across Europe<br />
has been reduced in <strong>H1</strong> <strong>2011</strong> with most of the<br />
markets covered in our analysis now priced between<br />
6 and 8%. However, Bucharest, Budapest, Moscow<br />
and Kiev are priced above 9%. Average prime yields<br />
in Europe are close to 7.50%, with the UK market<br />
slightly below and CEE markets above.<br />
• Looking forward to 2015, prime yields are not<br />
expected to change dramatically, with a modest<br />
annual capital growth of 1.2% anticipated from 2012<br />
to 2015. CEE markets and Spain will outperform with<br />
an increase from 2 to 5% over the same period. The<br />
three major markets – UK, France and Germany –<br />
will see yields moving by 10-15 bps in France, 10-15<br />
bps in Germany and 0-25 bps in UK between <strong>2011</strong><br />
and 2015.<br />
Figure 13<br />
<strong>Logistics</strong> prime yields in Europe, 2000-Q4 2010<br />
www.dtz.com 7<br />
%<br />
14<br />
12<br />
10<br />
8<br />
6<br />
4<br />
Source: <strong>DTZ</strong> Research<br />
Brussels Paris<br />
Munich Warsaw<br />
Stockholm London (Heathrow)
Fair Value Index<br />
<strong>Logistics</strong> shown as fairly priced across<br />
Europe in Q2 <strong>2011</strong>, as Fair Value Index<br />
stands at 52<br />
• Based on our Fair Value analysis, both logistics and<br />
retail remain the most attractive sectors with an index<br />
score of 52, compared to only 28 for offices (Figure<br />
14). More than 24 of the 27 <strong>European</strong> logistics<br />
markets covered by our Fair Value Index are<br />
currently attractively priced.<br />
• The number of <strong>European</strong> logistics markets currently<br />
identified as HOT (under-priced by more than 5%)<br />
decreased in the 2 nd quarter <strong>2011</strong>, to five from eight<br />
at the end of 2010.<br />
• Prime industrial yields in most major markets have<br />
held at a relatively high level. Notable exceptions are<br />
London Heathrow and the Greater Paris Region,<br />
where international interest has driven significant<br />
yield compression.<br />
• A wide range of attractive markets across Europe<br />
have been identified in Q2 <strong>2011</strong>: Prague, Antwerp,<br />
Barcelona, Manchester, Brussels and Bucharest. The<br />
latter has posted the largest upgrade of the half year,<br />
moving from twenty fourth place in Q4 2010 to sixth<br />
position in Q2 <strong>2011</strong>. Its attractiveness is explained by<br />
high income returns and expected annualised capital<br />
growth of around 1.6% per year between <strong>2011</strong> and<br />
2015 over a risk free rate of around 5%.<br />
• Some opportunities can still be found in emerging<br />
CEE markets, like Prague (classified as HOT) and<br />
Warsaw (WARM). Budapest is currently classified as<br />
COLD as forecast rent and yield movements of over<br />
the next 5 years fail to deliver returns strong enough<br />
to compensate for the given risks (Table 1).<br />
• Amongst the most mature markets, Germany<br />
(Hamburg and Frankfurt) and France (Greater Paris<br />
Region, Lyon, and Marseilles) are now classified in<br />
the WARM category. Prime yield compression has<br />
not matched the five year government bond yield<br />
movements, restoring some relative attractiveness<br />
for logistics assets.<br />
Figure 14<br />
Fair Value Index – Europe<br />
www.dtz.com 8<br />
70<br />
60<br />
50<br />
40<br />
30<br />
20<br />
10<br />
0<br />
All property Office Retail <strong>Logistics</strong><br />
Q2 2010 Q3 2010 Q4 2010 Q1 <strong>2011</strong> Q2 <strong>2011</strong><br />
Source: <strong>DTZ</strong> Research<br />
Table 1<br />
Fair Value Classifications – Key Industrial Markets<br />
Q2 <strong>2011</strong><br />
Under/over<br />
Category Market<br />
valuation<br />
HOT<br />
WARM<br />
COLD<br />
Source: <strong>DTZ</strong> Research<br />
Prague -9%<br />
Antwerp -9%<br />
Barcelona -8%<br />
Manchester -8%<br />
Brussels -6%<br />
Greater Paris<br />
Region<br />
-3%<br />
Hamburg -2%<br />
Madrid -0%<br />
Warsaw 2%<br />
Rotterdam 3%<br />
London Heathrow 4%<br />
Amsterdam<br />
Budapest<br />
Oslo<br />
Dublin<br />
6%<br />
6%<br />
6%<br />
8%
Fair Value Index<br />
Map 1<br />
Prime industrial yields in Europe (Q2 <strong>2011</strong>) and yield shift expected in <strong>2011</strong>-2015<br />
Prime yield<br />
5.75% - 6.99%<br />
7.00% - 7.99%<br />
8.00% - 8.99%<br />
9.00% - 10.50%<br />
Yield shift (<strong>2011</strong>-2015)<br />
-75 to -26 bps<br />
-25 to 25 bps<br />
26 to 50 bps<br />
Dublin<br />
Source : <strong>DTZ</strong> Research, ESRI<br />
Glasgow<br />
Bristol<br />
Madrid<br />
Manchester<br />
London (Heathrow)<br />
Amsterdam<br />
Paris (IDF)<br />
Brussels<br />
Lyon<br />
Rotterdam<br />
Antwerp<br />
Marseille<br />
Barcelona<br />
Oslo<br />
Hamburg<br />
Frankfurt<br />
Milan<br />
Gothenburg<br />
Copenhagen<br />
Berlin<br />
Rome<br />
www.dtz.com 9<br />
Prague<br />
Budapest<br />
Helsinki<br />
Warsaw<br />
Bucharest
Occupier market – <strong>European</strong> market overview<br />
Good performance in <strong>H1</strong> <strong>2011</strong> but a high<br />
degree of uncertainty about H2 <strong>2011</strong><br />
• <strong>H1</strong> <strong>2011</strong> witnessed a strong <strong>European</strong> economic<br />
recovery, until further escalation of the debt crisis<br />
during the summer. Growth in consumption and the<br />
resulting uptick in industrial production led to an<br />
increasingly positive outlook. The first half year of<br />
<strong>2011</strong> saw an increased level of take-up, with 6.9<br />
million sq m registered in five of the leading<br />
<strong>European</strong> markets, up from 5.5 million sq m during<br />
the same period a year ago (Figure 15).<br />
• German and CEE logistics markets, especially in<br />
Poland, have been boosted by a strong economic<br />
recovery. Retailers and manufacturers were quick to<br />
take advantage of improving sentiment and<br />
opportunities. Take-up in Germany and the CEE has<br />
seen an increase of 42% and 28% respectively. In<br />
France and Belgium, increased activity has been<br />
concentrated in core markets, whilst secondary<br />
markets are still struggling with flat occupier demand.<br />
Finally, the UK market is experiencing a huge decline<br />
of Grade A supply while the demand from the retail<br />
and manufacturing sectors, although subdued<br />
relative to historical averages, remains constant.<br />
• Expansion plans were beginning to return to the<br />
agenda of many retail and manufacturing companies.<br />
However, their market approach remains cautious as<br />
most are unwilling to compromise on either quality or<br />
location, given their perception of current market<br />
conditions. Built-to-suit schemes have grown in<br />
popularity as occupiers have fewer good quality<br />
buildings to choose from within the existing supply.<br />
This “flight to quality” has kept vacancy rates roughly<br />
unchanged, varying between 6 and 20% depending<br />
on the market.<br />
• The financial crisis of the summer has led to a large<br />
number of requirements being put on hold.<br />
Furthermore, the crisis will negatively impact levels of<br />
speculative development of logistics space. H2 <strong>2011</strong><br />
results will depend on the capacity of the <strong>European</strong><br />
Union to deal with the sovereign debt crisis and<br />
restore confidence. This process should take several<br />
months; we therefore expect to see more challenging<br />
market conditions leading to a decrease in take-up<br />
levels during the second half of <strong>2011</strong>.<br />
Figure 15<br />
Take-up in selected* countries in Europe<br />
in 000 of sq m<br />
www.dtz.com 10<br />
Sq m<br />
5 000<br />
4 500<br />
4 000<br />
3 500<br />
3 000<br />
2 500<br />
2 000<br />
1 500<br />
1 000<br />
500<br />
0<br />
Source: <strong>DTZ</strong> Research<br />
Germany UK CEE France Belgium<br />
2007 2008 2009 2010 <strong>H1</strong> <strong>2011</strong>
Occupier market – <strong>European</strong> overview<br />
Map 2<br />
Prime industrial rents in Europe (Q2 <strong>2011</strong>) and annual growth expected between <strong>2011</strong> and 2015<br />
Prime rent (€/sq m/year)<br />
41 - 50<br />
51 - 75<br />
76 - 100<br />
101 - 151<br />
Annual rental growth (<strong>2011</strong>-2015)<br />
2.1% - 3.5%<br />
1.1% - 2.0%<br />
0.0% - 1.0%<br />
Dublin<br />
Source : <strong>DTZ</strong> Research, ESRI<br />
Glasgow<br />
Rotterdam<br />
Bristol Antwerp<br />
Madrid<br />
Manchester<br />
London (Heathrow)<br />
Amsterdam<br />
Paris (IDF)<br />
Brussels<br />
Lyon<br />
Marseille<br />
Barcelona<br />
Milan<br />
Oslo<br />
Hamburg<br />
Frankfurt<br />
Gothenburg<br />
Copenhagen<br />
www.dtz.com 11<br />
Berlin<br />
Rome<br />
Prague<br />
Helsinki<br />
Warsaw<br />
Budapest<br />
Bucharest
Occupier market – <strong>European</strong> overview<br />
Prime rents stabilising in <strong>H1</strong> <strong>2011</strong><br />
• After strong decreases registered in 2009 and 2010,<br />
prime rents are now stabilising. Occupier demand<br />
has been growing after two years of stagnation, but<br />
many <strong>European</strong> markets are still suffering from a<br />
high level of vacant space. Therefore rents remain<br />
under pressure (Figure 16).<br />
• 41 <strong>European</strong> markets out of the 50 covered by our<br />
analysis have seen prime logistics rents remain<br />
stable during the first half of <strong>2011</strong>. Behind this<br />
apparent rental stability, landlords are still flexible<br />
over incentives, especially in the markets where<br />
supply is abundant and demand is limited.<br />
• Among the major markets, Dublin has posted the<br />
largest decrease (-7%) in rents over the period, while<br />
Greater Paris Region, Istanbul and Brussels saw<br />
their rents increase by 2%, 6% and 10% respectively.<br />
Marginal upward trend in rents expected<br />
across Europe by the end of <strong>2011</strong><br />
• <strong>2011</strong> will see prime industrial rental growth returning<br />
to positive territory, following the recovery already<br />
experienced in the office and retail sectors during<br />
2010. Prime <strong>European</strong> industrial rents are forecast<br />
to increase on average by just over 1.5% pa,<br />
compared to 1.7% for retail and 2.5% for the office<br />
sector. Despite this positive forecast for the<br />
<strong>European</strong> market, prime rents will stay below their<br />
historical peaks.<br />
• The rental recovery seen in some markets in <strong>H1</strong><br />
<strong>2011</strong> should gradually spread across Europe, as<br />
most markets are expecting to see rental growth by<br />
the end of <strong>2011</strong>.<br />
• Berlin, Bucharest, Rome and Copenhagen are the<br />
only markets on the periphery of the recovery. At the<br />
other end of the scale, the biggest increases are<br />
expected in Barcelona (3.6%), partially reversing the<br />
8% decrease registered between 2006 and 2010.<br />
Prime rents in the Greater Paris Region are forecast<br />
to increase by 2.2% to return to 2009 levels. CEE<br />
markets will benefit from the upward trend with a 2%<br />
rise anticipated in Warsaw and Prague (Figure 17).<br />
Figure 16<br />
<strong>European</strong> prime rents, 2000- Q2 <strong>2011</strong><br />
Base 100 = Q4 2000<br />
www.dtz.com 12<br />
110<br />
100<br />
90<br />
80<br />
70<br />
60<br />
Source: <strong>DTZ</strong> Research<br />
Figure 17<br />
Barcelona Birmingham<br />
Frankfurt Greater Paris Region<br />
Rotterdam Warsaw<br />
<strong>European</strong> prime rents, <strong>2011</strong> and 2015, biggest<br />
increases<br />
Marseille<br />
Greater Paris<br />
Region<br />
Brussels<br />
Prague<br />
Birmingham<br />
Manchester<br />
Warsaw<br />
Barcelona<br />
€ per sq m per<br />
year<br />
Source: <strong>DTZ</strong> Research<br />
30 40 50 60 70 80<br />
Q2 <strong>2011</strong> 2015F
Occupiers market – Country overview<br />
United Kingdom<br />
Manufacturing and retail sectors boost occupier<br />
demand<br />
• Take-up during the first half of <strong>2011</strong> came in at<br />
approximately 1.1m sq m, showing a slowdown<br />
compared to the 2.6m sq m achieved in 2010. The<br />
slowdown has been more visible in Q2 <strong>2011</strong> with<br />
492,000 sq m let (Figure 18). Occupiers seem<br />
inclined to place decisions on hold as uncertainty<br />
over the economic climate, including the revision to<br />
the UK outlook, dictate caution.<br />
• The drop in activity was mainly due to a fall in<br />
average deal size, since the number of transactions<br />
in Q2 was fairly similar to the number in Q1. This<br />
reduction in the average deal size was a result of a<br />
change in the profile of occupiers. Large distribution<br />
deals were rare during the quarter as manufacturing<br />
occupiers, which take smaller units than logistics<br />
users, demonstrated increased activity. Although<br />
manufacturing gains have dominated headlines, retail<br />
and internet retail requirements continue to provide a<br />
significant proportion of market demand for big sheds.<br />
• Supply side conditions continue to tighten as<br />
speculative construction is yet to return in any<br />
meaningful volume, despite a notable shortage of the<br />
best quality space (Figure 19). Many tenants are<br />
resorting to built to suit as the only option for new<br />
space. Additionally diminishing supply of large,<br />
Grade A buildings is likely to encourage a number of<br />
deals as occupiers bring forward requirements to<br />
secure space in the few remaining buildings.<br />
• There was no appreciable rental movement during<br />
<strong>H1</strong> <strong>2011</strong>, but it is clear that the market is returning to<br />
a more balanced position. However, before any<br />
rental movement takes place, incentives will have to<br />
undergo some significant tightening. Although the<br />
overall rental growth forecast remains consistent with<br />
the previous forecast, spikes of undersupply in some<br />
markets have, in turn, prompted uplifts in rental<br />
growth. Despite the rental growth acceleration<br />
throughout the forecast period, the overall average,<br />
as well as the growth peaks, remains below historical<br />
values.<br />
Figure 18<br />
Aggregate regional take-up in UK<br />
Sq m<br />
1 200 000<br />
1 000 000<br />
www.dtz.com 13<br />
800 000<br />
600 000<br />
400 000<br />
200 000<br />
Source: <strong>DTZ</strong> Research<br />
Figure 19<br />
-<br />
A B C<br />
National availability by grade<br />
Sq m<br />
25 000 000<br />
20 000 000<br />
15 000 000<br />
10 000 000<br />
5 000 000<br />
Source: <strong>DTZ</strong> Research<br />
Figure 20<br />
-<br />
Q4<br />
2009<br />
Q1<br />
2010<br />
Q2<br />
2010<br />
Q3<br />
2010<br />
Q4<br />
2010<br />
Prime Secondary<br />
Q1<br />
<strong>2011</strong><br />
<strong>DTZ</strong> prime industrial annual rental growth<br />
5%<br />
4%<br />
3%<br />
2%<br />
1%<br />
0%<br />
-1%<br />
-2%<br />
-3%<br />
-4%<br />
Source: <strong>DTZ</strong> Research<br />
Q2<br />
<strong>2011</strong>
Occupiers market – Country overview<br />
Ireland<br />
A positive sign of recovery but the market is still<br />
under pressure<br />
• In line with the signs of recovery noticed at the end of<br />
2010, the Dublin industrial market registered a strong<br />
performance both in terms of total transacted space<br />
and individual deals completed in <strong>H1</strong> <strong>2011</strong> with<br />
80,900 sq m (Figure 21), posting a modest increase<br />
compared to the same period in 2010. Levels,<br />
however, remain significantly lower relative to the<br />
long run annual average level of transactions.<br />
• The opening six months of the year witnessed further<br />
improvements in both sentiment and activity<br />
indicators such as enquiry levels and requirements,<br />
albeit off a low base.<br />
• Since the onset of the downturn, the appetite for<br />
freehold purchases has been limited. Occupiers have<br />
instead been opting for more flexible leasehold<br />
transactions as an occupational preference. However,<br />
<strong>2011</strong> has seen renewed interest in purchase options,<br />
with approximately 39% of floorspace transacted<br />
during the first six months of the year.<br />
• Supply levels in the Dublin industrial market declined<br />
to 971,600 sq m at the end of June <strong>2011</strong>. This<br />
represents the first reduction in availability in three<br />
years and follows a leveling off in the upward trend<br />
noted in the previous quarter. While this marks a<br />
positive development for the industrial market, given<br />
the current economic climate, supply levels are<br />
expected to fluctuate over the coming quarters. In<br />
line with a modest decrease in supply levels, the<br />
vacancy rate declined to 23.9% at the end of June,<br />
down from 24% recorded at the end of 2010.<br />
• Rents have continued on their downward spiral as<br />
landlords continue to compete for the few active<br />
requirements in the market at present. Prime<br />
headline rents are now in the region of €60 per sq m.<br />
However incentives are only playing a minimal part<br />
during negotiations as landlords have reduced the<br />
rent from lease commencement and have not kept<br />
the rents artificially high while including incentives.<br />
• The construction of logistics/industrial<br />
accommodation has completely ceased; however,<br />
there is a limited amount of good quality<br />
accommodation available with the potential that new<br />
requirements will have to opt for expensive design<br />
and build solutions in the short to medium term.<br />
Figure 21<br />
Take-up & availability ratio in Ireland<br />
www.dtz.com 14<br />
Sq m<br />
400 000<br />
350 000<br />
300 000<br />
250 000<br />
200 000<br />
150 000<br />
100 000<br />
50 000<br />
0<br />
Source: <strong>DTZ</strong> Research<br />
Figure 22<br />
Prime rents in Dublin<br />
€/ sq m /y<br />
130<br />
120<br />
110<br />
100<br />
90<br />
80<br />
70<br />
60<br />
Source: <strong>DTZ</strong> Research<br />
Take-up Availability ratio<br />
25%<br />
20%<br />
15%<br />
10%<br />
5%<br />
0%
Occupiers market – Country overview<br />
Belgium<br />
High level of take-up in <strong>H1</strong> <strong>2011</strong> but modest<br />
growth of prime rents anticipated until 2015<br />
• The first half of <strong>2011</strong> has seen the Belgian logistics<br />
market reaching a record level of 520,000 sq m<br />
taken-up, compared to an annual average of 490,000<br />
sq m (Figure 23). These better than average results<br />
are mainly linked to strong activity in the Flanders<br />
region, which accounted for approximately 465,000<br />
sq m of take-up. Over the first half, this region has<br />
attracted major deals, such as Maxeda Brico on<br />
34,000 sq m of logistics space in Willebroek and<br />
more recently Spar Retail and Nike Europe on<br />
premises above 40,000 sq m.<br />
• The top five deals of the first half of the year included<br />
four purchases for owner occupation. All these deals<br />
were for facilities between 20,000 sq m and 50,000<br />
sq m.<br />
• The high level of activity seen in <strong>H1</strong> <strong>2011</strong> has dried<br />
up the supply and a large portion of the vacant stock<br />
has been let during the last 12 -18 months. Grade A<br />
supply has shrunk as speculative construction has<br />
remained subdued. The quality of the remaining<br />
supply is becoming an issue, leading many occupiers<br />
to a built-to-suit solution.<br />
• The rental value decline registered since the end of<br />
2007 has halted in <strong>H1</strong> <strong>2011</strong> and prime rents are<br />
stabilising at €48 per sq m in Antwerp. Brussels has<br />
seen its rents coming back to a level of €55 per sq m<br />
while the rental adjustment is still ongoing in Liege<br />
(Figure 24). Going forward, we don’t expect any<br />
major changes to prime rents with a forecast 2.2% pa<br />
in Brussels and 1.6% pa in Antwerp from <strong>2011</strong> to<br />
2015.<br />
Figure 23<br />
Aggregate regional take-up in Belgium<br />
600 000<br />
500 000<br />
400 000<br />
300 000<br />
200 000<br />
100 000<br />
www.dtz.com 15<br />
Sq m<br />
-<br />
Source: <strong>DTZ</strong> Research<br />
Figure 24<br />
Flanders Brussels (incl. Brabant) Wallonia<br />
Prime rents in Belgium<br />
€/ sq m /<br />
year<br />
60<br />
50<br />
40<br />
30<br />
Source: <strong>DTZ</strong> Research<br />
Antwerp Brussels Liege
Occupiers market – Country overview<br />
France<br />
Falling supply as a result of strong levels of<br />
activity in core markets<br />
• The French logistics market recorded strong levels of<br />
activity in the first half of <strong>2011</strong>, with take-up reaching<br />
1.1 m sq m, representing a 31% increase compared<br />
to <strong>H1</strong> 2010. The four core markets (Greater Paris<br />
Region, Lille, Lyon and Marseilles) witnessed higher<br />
levels of activity than previous quarters. The biggest<br />
increase in take up was registered in Lyon where,<br />
after a difficult 2010 (with take-up only reaching<br />
236,000 sq m), was recorded 198,000 sq m of takeup<br />
in <strong>H1</strong> <strong>2011</strong> alone. The level of activity in the<br />
Greater Paris Region market remained unchanged at<br />
414,000 sq m.<br />
• Meanwhile, the continuous increase of immediately<br />
available supply seen since the end of 2007 has<br />
stopped. The first signs of decline (-10% during the<br />
last 6 months) has seen supply fall to 2.7 m of sq m,<br />
compared to 3 m sq m at the end of 2010. This<br />
decline is a common trend in the 4 core markets but<br />
in variable proportions: from -7% in the Greater Paris<br />
Region (903,000 sq m) to -29% in Marseilles<br />
(133,000 sq m). Despite stronger take up, the Lyon<br />
market is still suffering from a high level of vacancy,<br />
with 500,000 sq m immediately available, at a<br />
vacancy ratio of 12% (Figure 26).<br />
• Prime logistics rents remained stable at €41-43 per<br />
sq m in Marseille and Lyon and close to €50 per sq m<br />
in the Greater Paris Region at the end of <strong>H1</strong> <strong>2011</strong>.<br />
The trend of increased take-up noticed in the first half<br />
of the year and strong prospects for the second half,<br />
allow some optimism regarding further rental growth,<br />
firstly in the Greater Paris Region and Marseille for<br />
the end of the year, and in Lyon in 2012. However,<br />
rents will not return to their pre-crisis level before<br />
2013/2014. Meanwhile, landlords will continue to<br />
offer incentives in the markets where immediate<br />
supply is large, especially on medium-sized buildings<br />
Figure 25<br />
Take-up in France<br />
Sq m<br />
2 500 000<br />
2 000 000<br />
1 500 000<br />
1 000 000<br />
www.dtz.com 16<br />
500 000<br />
0<br />
Source: <strong>DTZ</strong> Research<br />
Figure 26<br />
2004 2005 2006 2007 2008 2009 2010 <strong>H1</strong><br />
<strong>2011</strong><br />
Greater Paris Region Outside GPR<br />
Vacancy rates in France<br />
18%<br />
16%<br />
14%<br />
12%<br />
10%<br />
8%<br />
6%<br />
4%<br />
2%<br />
0%<br />
Source: <strong>DTZ</strong> Research<br />
Figure 27<br />
Greater Paris Region Lyon Marseille<br />
Prime rents in France<br />
€/ sqm<br />
/year<br />
60<br />
55<br />
50<br />
45<br />
40<br />
35<br />
Source: <strong>DTZ</strong> Research<br />
Q4 Q4 Q4 Q4 Q4 Q4 Q4 Q4 Q4 Q4 Q2<br />
2001 2002 20032004<br />
2005 2006 2007 2008 2009 2010 <strong>2011</strong><br />
Greater Paris Region Lyon Marseille Lille
Occupiers market – Country overview<br />
Germany<br />
Record level of take-up, boosted by major<br />
transactions on built-to-suit developments<br />
• On the back of a positive economic outlook, the<br />
German market has continued to see growth in takeup<br />
to 2.7 m sq m in <strong>H1</strong> <strong>2011</strong> from 1.9 m sq m in <strong>H1</strong><br />
2010. The market posted a 41% increase on an<br />
annual basis, thus ranking one of the most active<br />
markets throughout Europe. Food retailers are keen<br />
to move from old warehouses to new developments,<br />
especially on built-to-suit premises; whereas demand<br />
from the manufacturing sector is more focused on<br />
existing and second-hand buildings.<br />
• The economic troubles dominating Europe since the<br />
summer could impact negatively on the level of<br />
demand for logistics space in Germany as<br />
uncertainty increases. Therefore we anticipate a<br />
lower level of take-up for the rest of the year, but<br />
despite this, <strong>2011</strong> should remain one of the best<br />
years in terms of take-up levels (Figure 28).<br />
• Construction activity is slowly returning in Germany,<br />
even if pre-letting of these new developments is still<br />
required. Thus, Goodman has signed with e-retailer<br />
Amazon for a built-to-suit development of 110,000 sq<br />
m in Rheinberg and another one of 110,000 sq m in<br />
Bavaria. These buildings will be delivered within 5<br />
months.<br />
• During the first half of <strong>2011</strong>, headline rents in the five<br />
major markets of Germany remained unchanged<br />
compared to their levels at the end of 2010. Prime<br />
rents of modern logistics space stand at €74 per sq<br />
m in Munich and at €68 per sq m in Frankfurt, making<br />
these two regions the most expensive in Germany.<br />
(Figure 29). Strong performance in the Frankfurt<br />
logistics market will have a positive impact on prime<br />
rents with a 3.8% increase anticipated in <strong>2011</strong> - to<br />
reach €71 per sq m, while Hamburg will see prime<br />
rents rising at a slower pace, at around 1.8% per<br />
annum from <strong>2011</strong> to 2013.<br />
Figure 28<br />
Take-up in Germany<br />
Sq m<br />
3 000 000<br />
2 500 000<br />
2 000 000<br />
1 500 000<br />
1 000 000<br />
500 000<br />
www.dtz.com 17<br />
0<br />
Source: <strong>DTZ</strong> Research<br />
Figure 29<br />
2004 2005 2006 2007 2008 2009 2010 <strong>H1</strong><br />
<strong>2011</strong><br />
Top 5 markets Outside top 5 markets<br />
Prime rents in Germany<br />
€/ sq m<br />
/year<br />
80<br />
75<br />
70<br />
65<br />
60<br />
55<br />
50<br />
Source: <strong>DTZ</strong> Research<br />
Berlin Dusseldorf Frankfurt<br />
Hamburg Munich
Occupiers market – Country overview<br />
The Netherlands<br />
Strong activity outside the three main markets<br />
• After a strong rebound in H2 2010 with take-up<br />
reaching 200,000 sq m in the three major markets<br />
(Amsterdam, Rotterdam and Utrecht), the Dutch<br />
logistics market returned to lower levels of activity in<br />
<strong>H1</strong> <strong>2011</strong>, with take-up reaching 100,000 sq m only.<br />
(Figure 30). Market activity has been particularly<br />
subdued in Amsterdam and Rotterdam since the<br />
beginning of the year, whilst Utrecht recorded 50% of<br />
total transactions. At a national level, the market is<br />
more dynamic with take-up close to 453,000 sq m; a<br />
similar level to that reached for the whole of 2010<br />
(512,000 sq m). Most of the main transactions over<br />
the period took place outside the three main markets,<br />
with important deals including that of TNT Fashion<br />
Group B.V. and Plus 100 B.V.in the Brabant region.<br />
• <strong>Logistics</strong> providers such as Kuehne & Nagel, as well<br />
as retailers, have supported the market with<br />
requirements of above 10,000 sq m. Clearly identified<br />
as a hub for the <strong>European</strong> market, the Dutch logistics<br />
market benefits from its strategic position with the<br />
ports of Rotterdam and Amsterdam. A revival of the<br />
logistics market is expected in the surrounding area<br />
of the Schipol airport thanks to a new urban<br />
development project.<br />
• Rents have remained stable, with values in<br />
Amsterdam close to €65 per sq m (Figure 31). No<br />
rental growth is expected for the rest of the year, with<br />
a slight increase of 1.5% expected in 2012 at the<br />
earliest.<br />
Figure 30<br />
Take-up in main city regions in the Netherlands<br />
000 sq m<br />
www.dtz.com 18<br />
350<br />
300<br />
250<br />
200<br />
150<br />
100<br />
50<br />
0<br />
Source: <strong>DTZ</strong> Research<br />
Figure 31<br />
2007 2008 2009 2010 <strong>H1</strong> <strong>2011</strong><br />
Amsterdam Rotterdam Utrecht<br />
Prime rents in the Netherlands<br />
€/ sq m<br />
/year<br />
80<br />
75<br />
70<br />
65<br />
60<br />
55<br />
50<br />
Source: <strong>DTZ</strong> Research<br />
Amsterdam Rotterdam Utrecht
Occupiers market – Country overview<br />
Italy<br />
Economic turmoil postpones the rental recovery<br />
• No major changes have been noticed in the Italian<br />
logistics market where the level of take-up is still well<br />
below the long term average. Most of the lettings<br />
registered in <strong>H1</strong> <strong>2011</strong> were built-to-suit deals,<br />
keeping the vacancy ratio at around 7%.<br />
Approximately 450,000 sq m is currently available on<br />
the Milanese logistics market.<br />
• Prime rents remained stable during <strong>H1</strong> <strong>2011</strong> (Figure<br />
32). The austerity measures put in place by the<br />
Italian government to reduce its public debt will<br />
impact negatively on consumption and therefore a<br />
decline in industrial production and foreign trade is<br />
expected. In this context, the rental recovery<br />
expected in 2012 will be delayed until 2013, with a<br />
modest 1.8% annual increase.<br />
Spain<br />
Take-up slows but new developments stops<br />
• The beginning of <strong>2011</strong> did not confirm the rebound<br />
noticed at the end of 2010 and the Spanish market<br />
has maintained a low level of activity with only 92,000<br />
of take-up in Madrid and 65,000 sq m in Barcelona.<br />
The absence of construction starts during this period<br />
adds further evidence of a tightening market, on the<br />
back of an increasingly negative economic outlook.<br />
• Vacancy rates have risen in the two main markets of<br />
Spain, reaching 9% in Madrid and 12% in Barcelona.<br />
• In this context, rents have stabilized in <strong>H1</strong> <strong>2011</strong> at<br />
€70 per sq m in Madrid and €63 per sq m in<br />
Barcelona (Figure 33). Based on our forecasts, prime<br />
rents will increase to €72 per sq m in Madrid, and<br />
€68 per sq m in Barcelona in 2012 at the earliest.<br />
Despite this recovery, rental values will not return to<br />
previous peaks within the next five years.<br />
Figure 32<br />
Prime rents in Italy<br />
€/ sq m<br />
/year<br />
65<br />
www.dtz.com 19<br />
60<br />
55<br />
50<br />
45<br />
Source: <strong>DTZ</strong> Research<br />
Figure 33<br />
Prime rents in Spain<br />
€/ sq m<br />
/year<br />
110<br />
100<br />
90<br />
80<br />
70<br />
60<br />
Source: <strong>DTZ</strong> Research<br />
Milan Rome<br />
Barcelona Madrid
Occupiers market – Country overview<br />
Nordics<br />
Positive economic prospects but market<br />
structure discouraging speculative construction<br />
• On the back of strong economic prospects with GDP<br />
growth forecast at 2.5% per annum between <strong>2011</strong><br />
and 2015 and consumer spending growth of 2.3%<br />
per annum over the same period, the Nordic region<br />
should see demand for logistics spaces growing in<br />
the short term. However, the market remains<br />
characterised by a high ratio of owner occupation<br />
and the attempts of developers to enter these<br />
markets have not been successful.<br />
• Occupiers are reluctant to move away from the<br />
suburbs of the main cities across the region where<br />
large land banks are available for new developments.<br />
In the Danish market, occupier demand is mainly<br />
focused on the triangle area on the German border<br />
which allows the distribution of products in the whole<br />
country. The 18 kilometers bridge between Denmark<br />
and Germany planned for opening in 2018 should<br />
impact positively on the market; however some<br />
relocation from Sweden is expected.<br />
Sweden<br />
• In many ways, Sweden is the geographical centre of<br />
the Nordic region, with a relatively sparse population<br />
and widely spread industry. This has dictated the<br />
structure of Sweden’s domestic logistics operations,<br />
and spurred infrastructure investments to meet the<br />
needs of home-grown multinationals such as Atlas<br />
Copco, Electrolux, Ericsson, IKEA, Saab, Scania,<br />
SKF and Volvo.<br />
• The vacancy situation in logistics property is very<br />
heterogeneous with a divider between prime and<br />
more secondary buildings. In general, very few<br />
projects are built on speculative basis in Sweden,<br />
and consequently, the vacancy of newly built prime<br />
logistics premises in good locations is virtually nonexisting<br />
at the moment.<br />
• Rents on new logistics properties are mainly<br />
determined by the cost of land and construction.<br />
Since there is an adequate supply of available land in<br />
many locations in Sweden, there is never a great<br />
imbalance between the supply and demand, which is<br />
a prerequisite for strong increases in the logistics<br />
rents (Figure 34).<br />
Figure 34<br />
Prime rents in Nordic countries<br />
€ / sq m /<br />
year<br />
150<br />
www.dtz.com 20<br />
125<br />
100<br />
75<br />
50<br />
Source: <strong>DTZ</strong> Research<br />
Copenhagen Helsinki Oslo Stockholm
Occupiers market – Country overview<br />
Central and Eastern Europe<br />
• The CEE markets – namely the Czech Republic,<br />
Hungary, Poland and Romania – are expected to<br />
lead the economic recovery in <strong>2011</strong> and in 2012.<br />
Poland continues to outperform Europe with GDP<br />
growth above 4% per year from <strong>2011</strong> to 2013,<br />
compared to a modest 1.7% pa in the Eurozone.<br />
Although forecasts for <strong>2011</strong> in Romania remain<br />
negative, medium-term forecasts indicate a strong<br />
recovery (Figure 35).<br />
• Once again, the Polish economy outperforms the<br />
Eurozone and the other CEE markets in terms of<br />
consumer spending with a 4% per annum. increase<br />
over the next three years. Still in trouble, Hungary is<br />
expected to post a decline in industrial production<br />
whilst in Romania, acceleration is expected in 2012<br />
and 2013 with a 6% pa growth.<br />
• Positive signals from the industrial production sector<br />
should also be mentioned. In this area, the CEE<br />
appears as the most attractive region, with a 6.2%<br />
increase on average anticipated from <strong>2011</strong> to 2013,<br />
following a 10% rise in 2010.<br />
• A favorable economic context had a positive impact<br />
on prime rents which have now been stable for 6<br />
months (Figure 36). Prime rental values stand<br />
between €42 per sq m in Budapest, €48 per sq m in<br />
Bucharest, €52 per sq m in Prague and €66 per sq m<br />
in Warsaw (Figure 36). These rents are expected to<br />
increase by 2% in Prague in <strong>2011</strong> and then the<br />
growth will spread in 2012 to Poland and Hungary.<br />
Figure 35<br />
GDP growth (%) in selected countries in CEE<br />
www.dtz.com 21<br />
%<br />
10<br />
8<br />
6<br />
4<br />
2<br />
0<br />
-2<br />
-4<br />
-6<br />
-8<br />
2007 2008 2009 2010 <strong>2011</strong>F 2012F 2013F<br />
Czech Rep. Hungary Poland<br />
Romania Eurozone<br />
Source: Oxford Economics<br />
Figure 36<br />
Prime rents in CEE<br />
€/ sq m /<br />
year<br />
80<br />
75<br />
70<br />
65<br />
60<br />
55<br />
50<br />
45<br />
40<br />
Source: <strong>DTZ</strong> Research<br />
Budapest Prague Warsaw Bucharest
Occupiers market – Country overview<br />
Poland<br />
Strong occupier demand for built-to-suit<br />
schemes<br />
• Poland has been one of the most resilient economies<br />
in Europe during the financial crisis of 2009 and 2010.<br />
Its large domestic base as well as its strong position<br />
in foreign trade has sustained the recovery (4% p.a.<br />
increase in GDP until 2013).<br />
• After its strong performance in 2010 with 1.5 m sq m<br />
let, take-up has kept the same pace with 800,000 sq<br />
m of transactions registered in <strong>H1</strong> <strong>2011</strong>, mostly<br />
during the 2 nd quarter (Figure 37). Market activity is<br />
still dominated by built-to-suit schemes taken by<br />
industrial and logistics companies.<br />
• Greater Warsaw has seen its market share growing<br />
over <strong>H1</strong> <strong>2011</strong> to reach 40% of take-up from 30% in<br />
2010, whilst the Silesia region accounted for another<br />
30%.<br />
• Relatively strong demand translated into a gradual<br />
decline of vacancy rates to 13.5% in <strong>H1</strong> <strong>2011</strong> from<br />
15.3% at the end of 2010. The available modern<br />
logistics stock amounted to approximately 900,000<br />
sq m, which represents a decrease of over 100,000<br />
sq m in comparison with Q4 2010. The fall in vacancy<br />
rates should continue as speculative construction<br />
remains limited with only 100,000 of completions in<br />
<strong>H1</strong> <strong>2011</strong> and only 400,000 sq m anticipated for <strong>2011</strong><br />
in total.<br />
• In <strong>H1</strong> <strong>2011</strong>, prime rents have remained unchanged in<br />
the Warsaw market and stand at €66 per sq m. In the<br />
regional markets, rental values grew slightly to €40-<br />
42 per sq m. Going forward, the positive economic<br />
outlook combined with an ongoing low level of new<br />
supply should support prime rental growth in Warsaw<br />
from 2012 (3% p.a. increase on average until 2014).<br />
Figure 37<br />
Take-up & new supply in Poland<br />
1 800 000<br />
1 600 000<br />
1 400 000<br />
1 200 000<br />
1 000 000<br />
800 000<br />
600 000<br />
400 000<br />
200 000<br />
0<br />
2005 2006 2007 2008 2009 2010 <strong>H1</strong><br />
<strong>2011</strong><br />
www.dtz.com 22<br />
Sq m<br />
Source: <strong>DTZ</strong> Research<br />
Take-up New supply
Occupiers market – Country overview<br />
Czech Republic<br />
Net take-up declines but rental prospects<br />
remains positive<br />
• The Czech Republic performed well in <strong>H1</strong> <strong>2011</strong>, with<br />
gross take-up close to 400,000 sq m, a level in line<br />
with the 800,000 sq m registered in 2010. However a<br />
large part of market activity has been concentrated<br />
on renegotiations and renewals, thus net take-up<br />
reached a modest level of 200,000 sq m (Figure 38).<br />
In light of weaker occupier demand, landlords grant<br />
lower rents in order to retain the occupation of their<br />
buildings on a longer term.<br />
• Apart from this phenomenon, occupiers have<br />
continued to be selective over the quality of their new<br />
buildings showing a limited appeal for the existing<br />
stock. As in other countries across Europe, built-tosuit<br />
schemes are preferred by industrial and logistics<br />
companies for their relocation and expansion.<br />
• The low level of immediately available supply and<br />
longer periods of lease renegotiations on built-to-suit<br />
projects will slow down the level of take up for the<br />
rest of <strong>2011</strong>.<br />
• The vacancy rate has declined significantly, falling to<br />
8.6% at the end of <strong>H1</strong> <strong>2011</strong> from 10.4% at the end of<br />
2010. Vacancy decreased mainly in West Bohemia<br />
and in Moravia-Silesia although only marginally, in<br />
most other submarkets it remained stable. Until the<br />
end of <strong>2011</strong> we expect to see a continuous decline of<br />
the vacancy rate as there is currently only 242,000 sq<br />
m of modern class-A warehouse space under<br />
construction, of which only 31 000 sq m is not preleased.<br />
• Headline rents for modern logistics space have<br />
remained stable at €43-52 per sq m. It is forecast that<br />
prime headline rents will increase towards the yearend<br />
to around €53 per sq m.<br />
Figure 38<br />
Take-up & supply in the Czech Republic<br />
1 200 000<br />
1 000 000<br />
800 000<br />
600 000<br />
400 000<br />
200 000<br />
www.dtz.com 23<br />
Sq m<br />
0<br />
Source: <strong>DTZ</strong> Research<br />
2005 2006 2007 2008 2009 2010 <strong>H1</strong><br />
<strong>2011</strong><br />
Gross take up Supply
Occupiers market – Country overview<br />
Hungary<br />
Renewals the main driver of the market<br />
recovery<br />
• The Hungarian logistics market has registered a<br />
strong performance in <strong>H1</strong> <strong>2011</strong>, as gross take-up<br />
reached a record level of 180,000 sq m. Behind this<br />
figure, the reality of the market shows a high level of<br />
renewals (around 50%) whilst new lettings accounted<br />
for only 30% of this volume (Figure 39).<br />
Requirements for small or medium-sized buildings<br />
are numerous, although some larger deals have also<br />
been registered.<br />
• 2010 has seen companies in the light<br />
industry/assembly sector accounting for 34% of<br />
annual take-up. In <strong>H1</strong> <strong>2011</strong> the logistics sector has<br />
been dominant, accounting for 56% of total<br />
transactions.<br />
• Despite the fact that there were no completions of<br />
vacant buildings in <strong>H1</strong> <strong>2011</strong>, the vacancy rate has<br />
continued to increase to reach 21.8%. Several larger<br />
industrial units and the former Spar distribution<br />
centre (43,000 sq m) have become vacant.<br />
• We don’t expect any major changes to the market in<br />
H2 <strong>2011</strong>, as the consolidation trend of occupiers,<br />
seen since the beginning of the year, will continue.<br />
However the vacancy rate should start to decrease,<br />
as construction activity of speculative schemes is<br />
mainly frozen.<br />
Romania<br />
Still challenging but a little bit better…<br />
• Mainly characterised by medium-sized requirements<br />
(from 3,000 to 5,000 sq m), the Romanian logistics<br />
market has been strong during the first half of the<br />
year with an estimated 150,000 sq m taken up (for<br />
both class A and B facilities), of which 100,000 sq m<br />
was transacted in Bucharest. The largest deals done<br />
over the period were by a local IT distribution<br />
company ASE SOFT in Bucharest on approx. 9,000<br />
sq m of storage logistics space and a 13,000 sq m<br />
built to suit deal signed in Ploiesti, by the American<br />
irrigation company Toro.<br />
Figure 39<br />
Take-up & new supply in Hungary<br />
www.dtz.com 24<br />
Sq m<br />
350 000<br />
300 000<br />
250 000<br />
200 000<br />
150 000<br />
100 000<br />
50 000<br />
0<br />
Source: <strong>DTZ</strong> Research<br />
Take-up New supply<br />
• However, the second part of the year should follow a<br />
similar trend with industrial companies searching for<br />
premises between 5,000 and 10,000 sq m in<br />
Bucharest and other secondary cities.<br />
• Amongst developers and investors active in Romania,<br />
cautiousness is still required and a return of<br />
speculative projects is not expected until 2012/2013.
Occupiers market – Country overview<br />
Ukraine<br />
New building development is still frozen<br />
• While GDP growth could still be close to 5% this year,<br />
downside risks are growing as the main export<br />
markets slow and gas import prices continue to rise.<br />
The mixed picture of the Ukrainian economy explains<br />
the wait-and-see attitude of investors and developers.<br />
• Construction activity is still frozen but the return to a<br />
stronger market will require a firmer recovery in<br />
demand. Meanwhile occupiers seeking space<br />
remain cautious, therefore current levels of<br />
occupancy, despite lack of new development, will<br />
remain generally stable throughout <strong>2011</strong>.<br />
• Prime warehouse rents vary between €47 per sq m<br />
and €57 per sq m, depending on quality. Although<br />
there has been a change in the demand/supply<br />
balance, current forecasts are for rents to remain<br />
generally unchanged in the short term.<br />
Russia<br />
Strong demand in Moscow<br />
• The logistics market in Russia is structured around<br />
the international corridors and roads (M10 /<br />
Leningradskoe in the North West, M3 / Kievskoe, in<br />
South West, MA and M2 in the South). Moscow and<br />
its suburbs are the main market in Russia. Land<br />
around the city of Moscow is currently the most<br />
attractive region in the country for the logistics sector<br />
due to the availability of land and the proximity of the<br />
national and international corridors to Southern<br />
Russia, Ukraine and the Black Sea ports.<br />
• The logistics stock in Moscow is estimated at 6.3<br />
million of sq m, including 3.5 million of Grade A<br />
space. After its peak in 2009, the vacancy rate has<br />
declined rapidly to 10% in 2010 and only 3% of<br />
vacancy is expected at the end of <strong>2011</strong>. New supply<br />
is still limited while the demand of retailers and<br />
manufacturing companies has remained dynamic.<br />
• In this context, prime rents have increased since<br />
2010 to reach $120-135 per sq m per annum in<br />
Moscow and $150-160 inside the city.<br />
Figure 40<br />
<strong>Logistics</strong> rents in Moscow<br />
US $<br />
per sq m<br />
www.dtz.com 25<br />
150<br />
140<br />
130<br />
120<br />
110<br />
100<br />
90<br />
80<br />
Source: <strong>DTZ</strong> IMS Research<br />
2006 2007 2008 2009 2010 <strong>2011</strong>F<br />
Grade A Grade B
Occupiers market – Country overview<br />
Middle East - Dubai<br />
Limited market activity in <strong>H1</strong> <strong>2011</strong><br />
• In terms of scale, Dubai dominates the logistics<br />
sector in the UAE and is likely to do so for the<br />
foreseeable future. This is primarily because the<br />
major infrastructure is already in place and Dubai is<br />
seen as a regional hub over and above servicing the<br />
domestic market. This situation is illustrated by the<br />
fact that the majority of the logistics operators (parcel<br />
couriers and 3PLs) use Dubai as their regional hub.<br />
• There is approximately 2 m sq m of “good quality”<br />
logistics warehouse stock in Dubai. There is a<br />
significant amount of lesser quality stock on the<br />
market located throughout the established industrial<br />
areas; however it is difficult to confirm the total stock<br />
figure for this type of product. The majority of good<br />
quality stock is within Jebel Ali Free Zone (JAFZA)<br />
with a substantial proportion in the Dubai Airport Free<br />
Zone (DAFZA) and Dubai Investment Park. This<br />
trend is expected to continue as JAFZA and the<br />
newer industrial areas within southern Dubai are<br />
likely to become the dominant warehouse locations in<br />
the medium term with the opening of the new Al<br />
Maktoum airport and the existing interface with the<br />
Jebel Ali port.<br />
• Rents in Dubai have been subject to downward<br />
pressure since late 2008 with this trend set to<br />
continue for poorer quality accommodation in<br />
secondary locations. However, signs of stability have<br />
been witnessed in recent months with logistical<br />
fundamentals prevalent in the Emirate providing<br />
stability for better quality and well located stock.<br />
• Limited rental activity for larger industrial complexes<br />
within the Ras Al Khor area has been noticed in <strong>H1</strong><br />
<strong>2011</strong>. We are aware of the letting of a brand new<br />
industrial facility of 14,000 sq m including 929 sq m of<br />
office accommodation situated in Ras Al Khor 1 for<br />
AED 3,250,000 pa net plus 15% tax. The rental<br />
transaction reflects a rent of AED 237 per sq m over<br />
total building area and a good indication of high<br />
quality, larger complex industrial rental rates within<br />
the surrounding area (Figure 41).<br />
Figure 41<br />
Prime rents in Dubai<br />
AED<br />
per sq m<br />
Umm Ramool<br />
DAFZA<br />
Al Qusais<br />
Al Quoz<br />
DIP<br />
Jebel Ali<br />
Ras Al Khor<br />
DIC<br />
Dubai Silicon Oasis<br />
JAFZA<br />
DLC<br />
Source: <strong>DTZ</strong> Research<br />
0 200 400 600 800 1000 1200<br />
www.dtz.com 26
www.dtz.com 27
Definitions<br />
Availability: Marketed space (usually available to move into within 6 months) that may or may<br />
not be vacant.<br />
Availability ratio: Industrial space currently available as a percentage of stock.<br />
Newly available: Floor space placed on the open market including both developments within six<br />
months of completion and units of second-hand space.<br />
Stock: The latest commercial industrial floor space statistics (warehouses).<br />
Building grade: Grade A: newly developed or comprehensively refurbished to new standard,<br />
including sublet space in new/refurbished buildings not previously occupied<br />
Grade B: buildings of good specification, floor plate efficiency and image usually<br />
but not exclusively ten years old or less<br />
Grade C: remaining poorer quality stock<br />
Speculative development: A newly developed or comprehensively refurbished building undertaken without<br />
the benefit of a secured tenant.<br />
Development start: A development in which work has started on the main contract. This usually<br />
excludes demolition and site clearance contracts.<br />
Development completion: A development in which the main contract has been completed, whether this be<br />
to shell and core or developer's finish.<br />
Take-up: Occupational transactions, including the following:<br />
(i) industrial buildings let/sold to an eventual occupier that had not been<br />
previously recorded as under offer to that occupier<br />
(ii) developments pre-let/sold to an occupier<br />
(iii) owner occupier purchase of a freehold or long leasehold<br />
Prime rent: The rent reported being paid, which may not take account of concessions such<br />
as rent-free periods, in which case it is known as the effective rent.<br />
www.dtz.com 28
Contacts<br />
Eurologistics Group<br />
Robert Hall +44(0)20 3296 2076 robert.a.hall@dtz.com<br />
Belgium<br />
Dirk Van Bulck +32 3303 1020 dirk.vanbulck@dtz.com<br />
Czech Republic<br />
Martin Sumera +42 0234 262 222 martin.sumera@dtz.com<br />
Denmark<br />
Tom Nedergaard +45 3314 5070 tom.nedergaard@dtz.com<br />
France<br />
Lionel Garde +33 472 74 08 89 lionel.garde@dtz.com<br />
Germany<br />
Willi Weis +49 69 92 100 253 willi.weis@dtz.com<br />
Hungary<br />
Éva Tamás +36 1 472 7276 eva.tamas@dtz.com<br />
Italy<br />
Manuela Miller +39 02 77 22 99 22 manuela.miller@dtz.it<br />
Ireland<br />
Brendan Smyth +35 3163 99380 brendan.smyth@dtz.ie<br />
Netherlands<br />
Gerwin Vos +31 10 4 333 555 gvos@dtz.nl<br />
Middle East<br />
Nick Witty 974 4 483 7395 nick.witty@dtz.com<br />
Poland<br />
Erik Drukker +48 22 222 3000 erik.drukker@dtz.com<br />
Russia<br />
Andrey Zhernokleev +7 (495) 748 1111 andrey.zhernokleev@dtzims.ru<br />
Spain<br />
Manuel Hurtado de Amézaga +34 91 770 9601 manuel.hurtado@dtz.com<br />
Sweden<br />
Maria Krumlinde +46 8671 3493 maria.krumlinde@dtz.com<br />
United Kingdom<br />
Simon F Lloyd +44 (0)12 1697 7392 simon.f.lloyd@dtz.com<br />
Ukraine<br />
Irene Zalizenko +38 044 220 3072 irene.zalizenko@dtz.kiev.ua<br />
www.dtz.com 29
www.dtz.com<br />
Disclaimer<br />
This report should not be relied upon as a basis for entering into transactions without<br />
seeking specific, qualified, professional advice. Whilst facts have been rigorously<br />
checked, <strong>DTZ</strong> can take no responsibility for any damage or loss suffered as a result of<br />
any inadvertent inaccuracy within this report. Information contained herein should not,<br />
in whole or part, be published, reproduced or referred to without prior approval. Any<br />
such reproduction should be credited to <strong>DTZ</strong>.<br />
© <strong>DTZ</strong> September <strong>2011</strong>