


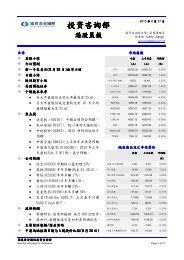
Company Report: Sinotrans Shipping (00368 HK) - 国泰君安
Company Report: Sinotrans Shipping (00368 HK) - 国泰君安
Company Report: Sinotrans Shipping (00368 HK) - 国泰君安

You also want an ePaper? Increase the reach of your titles
YUMPU automatically turns print PDFs into web optimized ePapers that Google loves.
<strong>Company</strong> <strong>Report</strong>: Xinxin Mining (03833 <strong>HK</strong>) Kevin Guo 郭勇<br />
公司报告:新鑫矿业 (03833 <strong>HK</strong>)<br />
+86 755 23976671<br />
kevin.guo@gtjas.com<br />
Profitability eroded by the slump of Nickel Prices, Downgrade to “Reduce”<br />
镍价下跌侵蚀盈利能力,下调至“减持”<br />
� The 2012 interim results of Xinxin Mining are expected to slide<br />
significantly mainly due to the slump of nickel prices. The sales prices of<br />
nickel dropped by 29% yoy to RMB 113,392/t and the sales prices of copper<br />
dropped by 18.0% yoy to RMB 49,647/t.<br />
� We expect the output of mined nickel and copper of the <strong>Company</strong> to<br />
increase steadily in 2012-2014 with the growth of mining capacities. Both<br />
Kalatongke Mine and Yakes & Hami have expansion projects under<br />
construction, and the output of mined nickel and copper are expected to<br />
increase in accordance with mining capacities.<br />
� Nickel prices are under great pressure of long-term over supply and<br />
short-term global economy slowdown, and remain the largest risk of the<br />
<strong>Company</strong>. We expect the 2012 average nickel prices to drop by 22% to RMB<br />
125,000/t.<br />
� Revise down the target price of Xinxin Mining to <strong>HK</strong>$ 1.35 due to lower<br />
EPS estimation, and downgrade the investment rating to “Reduce”.<br />
� 由于镍价大幅下挫,预计新鑫矿业 2012 年上半年业绩将显著下跌。上半年公司镍销售均<br />
价同比下跌 29%至 113,392 元/吨,铜销售均价同比下跌 18.0%至 49,647 元/吨。<br />
� 我们预计公司 2012-14 年矿产镍和矿产铜的产量将会随着采矿能力的上升而稳步增长。公<br />
司喀拉通客矿和亚克斯&哈密矿都在进行扩产,因此矿产镍和矿产铜的产量将会随着采矿<br />
能力的增长而增长。<br />
� 镍价受制于长期供应过剩以及短期内全球经济增速放缓的压力,是公司经营最大的风险。<br />
我们预计 2012 年镍均价将下跌 22%至 125,000 元/吨。<br />
� 基于较低的盈利预测我们将新鑫矿业的目标价下调至 1.35 港币,并将投资评级下调至“减<br />
持”。<br />
Year End<br />
年结<br />
Turnover<br />
收入<br />
Net Profit<br />
股东净利<br />
EPS<br />
每股净利<br />
EPS<br />
每股净利变动<br />
Rating:<br />
23 July 2012<br />
Reduce<br />
Downgraded<br />
评级: 减持 (下调)<br />
6-18m TP 目标价: <strong>HK</strong>$1.35<br />
Revised from 原目标价: <strong>HK</strong>$2.17<br />
Share price 股价: <strong>HK</strong>$1.510<br />
Stock performance<br />
股价表现<br />
Change in Share Price<br />
股价变动<br />
Abs. %<br />
绝对变动 %<br />
Rel. % to HS index<br />
相对恒指变动 %<br />
Avg. share price(<strong>HK</strong>$)<br />
平均股价(港元)<br />
See the last page for disclaimer Page 1 of 6<br />
PER<br />
市盈率<br />
BPS<br />
每股净资产<br />
1 M<br />
1 个月<br />
3 M<br />
3 个月<br />
1 Y<br />
1 年<br />
(11.4) (28.5) (65.7)<br />
(11.6) (21.6) (54.7)<br />
1.6 1.8 2.4<br />
Source: Bloomberg, Guotai Junan International.<br />
PBR<br />
市净率<br />
DPS<br />
每股股息<br />
Yield<br />
股息率<br />
ROE<br />
净资产收益率<br />
12/31 (RMB m) (RMB m) (RMB) (△%) (x) (RMB) (x) (RMB) (%) (%)<br />
FY10A 1,125 350 0.158 54.6 7.9 2.577 0.5 0.150 12.0 6.1<br />
FY11A 1,455 190 0.086 -45.8 14.5 2.577 0.5 0.030 2.4 3.3<br />
FY12F 1,506 162 0.073 -14.3 17.0 2.460 0.5 0.026 2.1 3.0<br />
FY13F 1,795 175 0.079 7.7 15.8 2.462 0.5 0.028 2.2 3.2<br />
FY14F<br />
2,194 245 0.111 39.9 11.3 2.472 0.5 0.039 3.1 4.5<br />
Shares in issue (m) 总股数 (m) 2,210.0 Major shareholder 大股东 Xinjiang Nonferrous Group 42.2%<br />
Market cap. (<strong>HK</strong>$ m) 市值 (<strong>HK</strong>$ m) 3,359.2 Free float (%) 自由流通比率 (%) 34.34<br />
3 month average vol. 3 个月平均成交股数 (‘000) 1,194.72 FY12 Net gearing (%) FY12 净负债/股东资金 (%) 10.2%<br />
52 Weeks high/low (<strong>HK</strong>$) 52 周高/低 4.480 / 1.450 FY12 Est. NAV (<strong>HK</strong>$) FY12 每股估值(港元) 3.4<br />
Source‥The <strong>Company</strong>, Guotai Junan International.<br />
GTJA Research <strong>国泰君安</strong>研究<br />
Xinxin Mining 新鑫矿业 (03833<strong>HK</strong>)<br />
<strong>Company</strong> <strong>Report</strong>
The 2012 interim results of Xinxin Mining are expected to slide significantly mainly due to the slump of nickel prices.<br />
The <strong>Company</strong> has just released profit warning that the 2012 interim results are expected to slide significantly. Although the<br />
output of refined nickel and copper increased by more than 60% yoy, the profitability of the <strong>Company</strong> was seriously eroded by<br />
the slump of metal prices. The average 1H2012 LME nickel prices dropped by 27.7% yoy to 18,499 US$/t, while the average<br />
1H2012 LME copper prices dropped by 14.0% yoy to 8,087 US$/t. Domestic metal prices fell more than the LME metal prices,<br />
hence the sales prices of nickel dropped by 29% yoy and the sales prices of copper dropped by 18.0% yoy. We estimate that<br />
total 1H2011 revenue of the company is expected to increase by more than 50%, while net profit is expected to fall down.<br />
Table 1 Output of Xinxin Mining<br />
1H2011 1H2012 YoY 1H2011 1H2012 YoY<br />
Nickel cathode Copper cathode<br />
Output ton 2,720 4,584 68.5% 1,414 3,207 126.8%<br />
Sale ton 2,268 4,353 91.9% 1,120 3,273 192.2%<br />
Average selling prices RMB/t 159,708 113,392 -29.0% 59,104 49,647 -16.0%<br />
Source: The <strong>Company</strong>, Guotai Junan International.<br />
We expect the output of mined nickel and copper of the <strong>Company</strong> to increase steadily in 2012-2014 with the growth of<br />
mining capacities. Kalatongke Mine and Yakes & Hami contribute almost all of the mining output of the company, and they all<br />
have expansion projects under construction. The mining capacities of Kalatongke Mine are about 2,000 ton/d right now, and<br />
are expected to reach 3,400 ton/d in 2013. Xinjiang Yakes & Hami are expected to add 4000 ton/d of new capacity and the<br />
total production capacity will reach 5,500 ton/d in 2014. Besides, the upgrading of the smelting and refinery systems had been<br />
completed in 2011 and is able to process the additional ores. As a result, the output of mined nickel and copper are expected<br />
to increase in accordance with the ore output. According to the latest information from the <strong>Company</strong>, the output of mined nickel<br />
is expected to reach 5,200 t, 7,400t and 10,500 t in 2012-2014, which are remain the same with our previous estimation. More<br />
importantly, output uncertainties have been removed with the completion of expansion project of Kalatongke Mine.<br />
Figure 1 Output of nickel and copper cathode (ton) Figure 2 Nickel prices<br />
14,000<br />
12,000<br />
10,000<br />
8,000<br />
6,000<br />
4,000<br />
2,000<br />
0<br />
Nickel Copper<br />
2010 2011 2012E 2013E 2014E<br />
250,000<br />
225,000<br />
200,000<br />
175,000<br />
150,000<br />
125,000<br />
100,000<br />
See the last page for disclaimer Page 2 of 6<br />
75,000<br />
50,000<br />
25,000<br />
Source: The <strong>Company</strong>, Guotai Junan International. Source: Bloomberg, Guotai Junan International.<br />
Nickel prices are under great pressure of long-term over supply and short-term global economy slowdown, and<br />
remain to be the largest risk of the <strong>Company</strong>. The fundamentals of nickel are the weakest among base metals. The<br />
massive use of nickel pig ore (NPI) in the past few years significantly increased the supply of nickel and changed<br />
supply-demand balance of global nickel market. As a result, nickel prices dropped more than other base metals in the past few<br />
years. We believe nickel is expected to continue to under great pressure of long-term over supply in the next few years.<br />
Besides, global economy slowdown in the near-term adds more pressure over nickel market. We expect 2012 average nickel<br />
prices to drop by 22% to RMB 125,000/t. However, we believe current nickel prices are close to the average industry<br />
production costs and further fall down of nickel prices will drive high costs producers cease production, which helps to support<br />
nickel prices. The operating results of the <strong>Company</strong> are very sensitive to the fluctuation of nickel prices, we estimate that net<br />
profit of the <strong>Company</strong> will change by more than 20% when nickel prices fluctuate by 10%.<br />
0<br />
Jan-<br />
09<br />
Jul-<br />
09<br />
Jan-<br />
10<br />
Jul-<br />
10<br />
Jan-<br />
11<br />
Jul-<br />
11<br />
Jan-<br />
12<br />
Jul-<br />
12<br />
23 July 2012<br />
Xinxin Mining 新鑫矿业 (03833)<br />
<strong>Company</strong> <strong>Report</strong>
Table2 Sensitivity of nickel prices<br />
Nickel Price Assumptions Net Profit(million)<br />
FY12 FY13 FY14 FY12 FY13 FY14<br />
Base Case 125,000 130,000 130,000 162 175 245<br />
Case1 112,500 117,000 117,000 120 120 166<br />
Change v.s. Base Case -10% -10% -10% -26.3% -31.2% -32.2%<br />
Case2 100,000 104,000 104,000 77 66 87<br />
Change v.s. Base Case -20% -20% -20% -52.5% -62.4% -64.5%<br />
Case3 137,500 143,000 143,000 205 229 323<br />
Change v.s. Base Case 10% 10% 10% 26.3% 31.2% 32.2%<br />
Source: The <strong>Company</strong>, Guotai Junan International.<br />
Revise down the target price of Xinxin Mining to <strong>HK</strong>$ 1.35 due to lower EPS estimation, and downgrade the<br />
investment rating to “Reduce”. Although the output of mined nickel and copper is expected to grow steadily in 2012-2014,<br />
nickel prices still confront great pressure and remain the largest risk of the <strong>Company</strong>. We maintain the 2012-2014 mined<br />
nickel output assumptions, but revised down nickel prices assumptions by 20%. As a result, we revise down EPS for FY12-14<br />
to RMB 0.073, 0.079 and 0.111, down by 45%, 47% and 49%, respectively. We believe nickel prices are close to the average<br />
industrial production costs and the downside extent is limited, so we maintain the valuation level of the <strong>Company</strong>. Hence we<br />
revise down TP to <strong>HK</strong>$ 1.35, which is equivalent to 15.0x FY12 PE and 0.6x FY12 PB and downgrade the company’s rating to<br />
“Reduce”.<br />
Table3 Key assumptions of Xinxin Mining<br />
FY12<br />
(Old)<br />
FY12<br />
(New)<br />
Change<br />
(%)<br />
See the last page for disclaimer Page 3 of 6<br />
FY13<br />
(Old)<br />
FY13<br />
(New)<br />
Change<br />
(%)<br />
FY14<br />
(Old)<br />
FY14<br />
(New)<br />
Change<br />
(%)<br />
Sales Volume (tons)<br />
Mined Nikel 5,281 5,281 0% 7,412 7,412 0% 10,523 10,523 0%<br />
Smelted Nickel 3,919 3,919 0% 4,088 4,088 0% 3,077 3,077 0%<br />
Mined Copper 5,365 5,365 0% 7,428 7,428 0% 10,399 10,399 0%<br />
Price (Rmb/ton)<br />
Nickel 156,000 125,000 -20% 160,000 130,000 -19% 160,000 130,000 -19%<br />
Copper 56,000 56,000 0% 58,000 58,000 0% 60,000 60,000 0%<br />
Unit cost (Rmb/ton)<br />
Mined Nickel 70,275 77,956 11% 71,680 79,515 11% 73,114 81,105 11%<br />
Smelted Nickel 128,000 102,564 -20% 131,282 106,667 -19% 131,282 106,667 -19%<br />
Mined Copper 26,586 29,683 12% 27,383 30,574 12% 28,205 31,491 12%<br />
Selling exp./Revenue 0.6% 0.6% 0Pts 0.6% 0.6% 0Pts 0.6% 0.6% 0Pts<br />
G&A/Revenue 7.0% 7.0% 0Pts 6.0% 6.0% 0Pts 6.0% 6.0% 0Pts<br />
Interest rate 6.0% 6.0% 0Pts 6.0% 6.0% 0Pts 6.0% 6.0% 0Pts<br />
Effective income tax 25.0% 25.0% 0Pts 25.0% 25.0% 0Pts 25.0% 25.0% 0Pts<br />
Dividend rate 35.0% 35.0% 0Pts 35.0% 35.0% 0Pts 35.0% 35.0% 0Pts<br />
EPS 0.135 0.073 -45% 0.150 0.079 -47% 0.218 0.111 -49%<br />
Source: The <strong>Company</strong>, Guotai Junan International.<br />
23 July 2012<br />
Xinxin Mining 新鑫矿业 (03833)<br />
<strong>Company</strong> <strong>Report</strong>
Table 3 Xinxin Mining’s Peers Comparison<br />
<strong>Company</strong> Stock Code Currency Last price<br />
PE PB ROE(%)<br />
11A 12F 13F 14F 11A 12F 13F 14F 12F<br />
Vale Indonesia Tbk INCO IJ IDR 2,675.00 10.3 10.1 8.6 8.6 2.0 1.5 1.4 1.3 15.6<br />
Aneka Tambang Persero Tbk Pt ANTM IJ IDR 1,360.00 8.0 8.2 8.1 9.6 1.4 1.1 1.0 1.0 13.9<br />
Mmc Norilsk Nickel Jsc-Adr MNOD LI USD 16.04 n.a. 7.1 7.0 6.7 n.a. 1.8 1.5 1.2 27.2<br />
Mincor Resources Nl MCR AU AUD 0.62 n.a. 27.0 124.0 38.8 1.1 0.7 0.8 0.8 2.0<br />
Western Areas Nl WSA AU AUD 4.04 7.9 13.1 13.6 8.3 3.7 2.5 2.3 1.9 19.6<br />
Simple Average 811.14 8.7 13.1 32.3 14.4 2.0 1.5 1.4 1.3 15.7<br />
Weighted Average 276.76 1.3 7.6 7.7 7.1 0.3 1.7 1.5 1.3 25.5<br />
Western Mining Co -A 601168 CH CNY 8.24 26.0 12.9 12.9 n.a. 1.9 n.a. n.a. n.a. n.a.<br />
Tongling Nonferrous Metals-A 000630 CH CNY 19.23 16.5 17.7 14.1 12.3 2.4 2.4 2.1 1.9 30.9<br />
Yunnan Copper Industry Co-A 000878 CH CNY 17.45 36.6 25.7 23.7 19.4 3.3 3.2 2.9 2.5 12.6<br />
Shenzhen Zhongjin Lingnan-A 000060 CH CNY 8.70 17.9 16.4 15.8 13.1 3.2 2.7 2.4 2.1 13.8<br />
Simple Average 13.41 24.2 18.1 16.6 14.9 2.7 2.8 2.5 2.1 19.1<br />
Weighted Average 14.22 24.4 18.6 16.8 11.7 2.7 2.2 1.9 1.7 15.7<br />
Aluminum Corp Of China Ltd-H 2600 <strong>HK</strong> <strong>HK</strong>D 3.13 137.1 n.a. 214.3 35.2 0.7 0.7 0.7 0.7 (2.8)<br />
Jiangxi Copper Co Ltd-H 358 <strong>HK</strong> <strong>HK</strong>D 17.44 7.2 8.0 7.7 8.6 1.2 1.1 1.0 1.0 15.2<br />
Xinjiang Xinxin Mining Ind-H 3833 <strong>HK</strong> <strong>HK</strong>D 1.52 19.6 12.9 8.7 5.9 0.7 0.5 0.5 0.5 3.8<br />
China Molybdenum Co Ltd-H 3993 <strong>HK</strong> <strong>HK</strong>D 2.75 11.7 11.0 8.9 8.8 1.2 0.9 0.8 0.7 8.9<br />
Hunan Nonferrous Metals-H 2626 <strong>HK</strong> <strong>HK</strong>D 2.40 23.4 21.9 18.8 19.7 1.6 1.6 1.5 1.4 n.a.<br />
Simple Average 5.45 39.8 13.4 51.7 15.6 1.1 1.0 0.9 0.9 6.3<br />
Weighted Average 9.14 65.6 5.4 99.1 20.8 1.0 0.9 0.9 0.8 6.0<br />
Source: Bloomberg, Guotai Junan International.<br />
See the last page for disclaimer Page 4 of 6<br />
23 July 2012<br />
Xinxin Mining 新鑫矿业 (03833)<br />
<strong>Company</strong> <strong>Report</strong>
Figure 1 Financial Statements and Ratios<br />
Year end Dec (RMB m)<br />
Income Statement Balance Sheet<br />
2010A 2011A 2012F 2013F 2014F<br />
Year end Dec (RMB<br />
m)<br />
2010A 2011A 2012F 2013F 2014F<br />
Turnover 1,125 1,455 1,506 1,795 2,194 PPE 2,906 4,143 4,520 4,888 5,210<br />
Cost of sales (685) (1,060) (1,136) (1,380) (1,633) Intangible assets 644 624 603 582 563<br />
Gross Profit 440 395 370 415 560 Investment 121 127 133 128 125<br />
SG&A (120) (136) (105) (108) (132) Others 260 286 300 315 331<br />
Profits of Operations 318 245 253 298 416 Non-current assets 3,932 5,180 5,556 5,915 6,229<br />
Finance Cost 38 18 (32) (60) (84)<br />
Others (3) (3) (3) (4) (4) Cash 1,546 611 602 628 658<br />
Profits before taxation 352 251 218 234 328 Trade receivables 292 436 452 539 658<br />
Income Tax (3) (61) (54) (59) (82) Inventory 448 684 602 628 768<br />
Profits after taxation 350 190 163 176 246 Others 48 75 45 56 59<br />
Minority interest 0 1 1 1 1 Current assets 2,333 1,807 1,701 1,851 2,142<br />
Profits attributable to shareholders 350 190 162 175 245<br />
EPS 0.158 0.086 0.073 0.079 0.111<br />
Total Assets 6,265 6,987 7,258 7,766 8,371<br />
DPS 0.150 0.030 0.026 0.028 0.039 Long-term Loans 30 569 753 898 1,097<br />
Others 149 197 216 238 262<br />
Cash Flow Statement Non-current liabilities 179 766 1,039 1,244 1,505<br />
Short-term Loans 44 65 419 674 919<br />
Year end Dec (RMB m) 2010A 2011A 2012F 2013F 2014F Trade payables 346 460 431 514 628<br />
Others 1 1 1 1 1<br />
Net Income 350 190 162 175 245 Current liabilities 390 526 851 1,189 1,549<br />
Operating Capital Change (239) (266) 37 (30) (145)<br />
Dep.&Amortization 70 139 167 183 198 Total Liabilities 570 1,291 1,821 2,325 2,907<br />
Others (141) 87 (307) (69) (81)<br />
CFO 39 149 60 259 217 Minority 216 356 356 355 354<br />
CAPEX (1,049) (1,355) (523) (531) (501)<br />
Others 120 65 36 37 39<br />
Total Equity 5,695 5,695 5,437 5,441 5,464<br />
CFI (929) (1,290) (487) (494) (462) Financial Ratio<br />
Net Bank Loans 74 560 538 400 444<br />
2010A 2011A 2012F 2013F 2014F<br />
Dividend Paid (111) (332) (66) (57) (61) Gross Margin 39.1% 27.1% 24.6% 23.1% 25.5%<br />
Others 170 (21) (54) (82) (108) Net Margin 31.1% 13.0% 10.8% 9.7% 11.2%<br />
CFF 133 207 418 261 275 ROE 6.1% 3.3% 3.0% 3.2% 4.5%<br />
ROA 5.9% 2.9% 2.3% 2.3% 3.0%<br />
Net change in cash (756) (934) (9) 26 30 ROCE 3.3% 5.4% 3.6% 3.9% 4.5%<br />
Cash at beginning of year 2,301 1,545 611 602 628 Free CF(mn Rmb) (1,009) (1,206) (463) (272) (284)<br />
Cash at end of year 1,545 611 602 628 658 Net Gearing -27% 0% 10% 17% 25%<br />
Source: The <strong>Company</strong>, Guotai Junan International.<br />
See the last page for disclaimer Page 5 of 6<br />
23 July 2012<br />
Xinxin Mining 新鑫矿业 (03833)<br />
<strong>Company</strong> <strong>Report</strong>
<strong>Company</strong> Rating Definition<br />
The Benchmark: Hong Kong Hang Seng Index<br />
Time Horizon: 6 to 18 months<br />
Rating Definition<br />
Buy Relative Performance >15%;<br />
or the fundamental outlook of the company or sector is favorable.<br />
Accumulate Relative Performance is 5% to 15%;<br />
or the fundamental outlook of the company or sector is favorable.<br />
Neutral Relative Performance is -5% to 5%;<br />
or the fundamental outlook of the company or sector is neutral.<br />
Reduce Relative Performance is -5% to -15%;<br />
or the fundamental outlook of the company or sector is unfavorable.<br />
Sell Relative Performance 5%;<br />
or the fundamental outlook of the sector is favorable.<br />
Neutral Relative Performance is -5% to 5%;<br />
or the fundamental outlook of the sector is neutral.<br />
Underperform Relative Performance


![有關: 敏華控股有限公司[01999] - gtja](https://img.yumpu.com/41399174/1/184x260/-01999-gtja.jpg?quality=85)


