2020-11 -- Real Estate of Northern Virginia Market Report - November 2020 Real Estate Trends - Michele Hudnall
2021 - More of the Same This is a monthly report of the Northern Virginia Real Estate market. Weekly I post a video of current market conditions and will post the monthly report between the 10th and 15th of each month as the numbers finalize in the MLS (Bright). The numbers come from the MLS (Bright), opinions are my own. This represents the market up to 5 Bedrooms keeping the numbers sub $1.5M and out of the luxury, custom market.
2021 - More of the Same
This is a monthly report of the Northern Virginia Real Estate market. Weekly I post a video of current market conditions and will post the monthly report between the 10th and 15th of each month as the numbers finalize in the MLS (Bright).
The numbers come from the MLS (Bright), opinions are my own. This represents the market up to 5 Bedrooms keeping the numbers sub $1.5M and out of the luxury, custom market.
- TAGS
- realestateofnva
- michele-hudnall
- manassas-city
- manassas-park-city
- falls-church-city
- fairfax-city
- alexandria-city
- arlington-city
- fairfax-county
- loudoun-county
- prince-william-county
- fauquier-county
- northern-virginia-real-estate
- northern-virginia-home-prices
- northern-virginia-home-trends
- nova-real-estate-trends
- nva-real-estate-trends
- real-estate-of-nva

Create successful ePaper yourself
Turn your PDF publications into a flip-book with our unique Google optimized e-Paper software.
NOVEMBER <strong>2020</strong> NORTHERN VIRGINIA OVERVIEW ||<br />
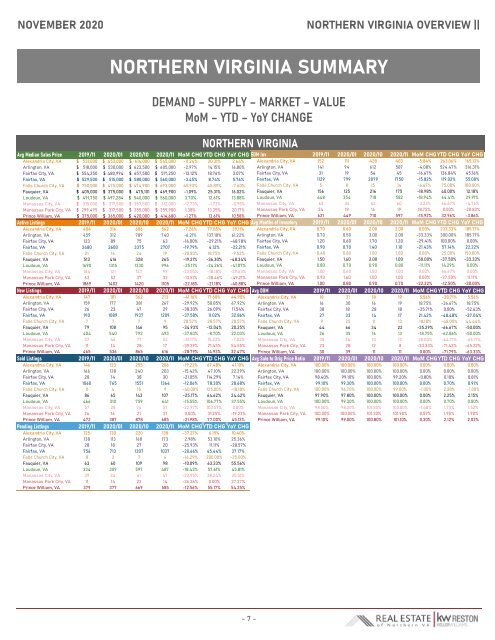
NORTHERN VIRGINIA SUMMARY<br />
DEMAND – SUPPLY – MARKET – VALUE<br />
MoM – YTD – YoY CHANGE<br />
NORTHERN VIRGINIA<br />
Avg Median Sales Price 2019/<strong>11</strong> <strong>2020</strong>/01 <strong>2020</strong>/10 <strong>2020</strong>/<strong>11</strong> MoM CHGYTD CHG YoY CHG EOM Inv 2019/<strong>11</strong> <strong>2020</strong>/01 <strong>2020</strong>/10 <strong>2020</strong>/<strong>11</strong> MoM CHGYTD CHG YoY CHG<br />
Alexandria City, VA $ 531,000 $ 453,000 $ 614,000 $ 545,000 -<strong>11</strong>.24% 20.31% 2.64% Alexandria City, VA 152 <strong>11</strong>1 428 403 -5.84% 263.06% 165.13%<br />
Arlington, VA $ 518,000 $ 530,000 $ 623,500 $ 605,000 -2.97% 14.15% 16.80% Arlington, VA 141 94 612 587 -4.08% 524.47% 316.31%<br />
Fairfax City, VA $ 554,250 $ 480,994 $ 657,500 $ 571,250 -13.12% 18.76% 3.07% Fairfax City, VA 31 19 54 45 -16.67% 136.84% 45.16%<br />
Fairfax, VA $ 529,500 $ 515,000 $ 580,000 $ 560,000 -3.45% 8.74% 5.76% Fairfax, VA <strong>11</strong>29 799 2079 1750 -15.82% <strong>11</strong>9.02% 55.00%<br />
Falls Church City, VA $ 750,000 $ 475,000 $ 474,900 $ 693,000 45.93% 45.89% -7.60% Falls Church City, VA 5 8 15 14 -6.67% 75.00% 180.00%<br />
Fauquier, VA $ 405,000 $ 375,000 $ 475,101 $ 469,900 -1.09% 25.31% 16.02% Fauquier, VA 156 125 216 175 -18.98% 40.00% 12.18%<br />
Loudoun, VA $ 491,750 $ 497,284 $ 540,000 $ 560,000 3.70% 12.61% 13.88% Loudoun, VA 448 354 718 582 -18.94% 64.41% 29.91%<br />
Manassas City, VA $ 315,000 $ 317,500 $ 357,500 $ 312,000 -12.73% -1.73% -0.95% Manassas City, VA 63 36 62 60 -3.23% 66.67% -4.76%<br />
Manassas Park City, VA $ 299,495 $ 317,500 $ 355,000 $ 359,900 1.38% 13.35% 20.17% Manassas Park City, VA 24 19 16 19 18.75% 0.00% -20.83%<br />
Prince William, VA $ 375,000 $ 365,000 $ 420,000 $ 414,680 -1.27% 13.61% 10.58% Prince William, VA 621 449 710 597 -15.92% 32.96% -3.86%<br />
Active Listings 2019/<strong>11</strong> <strong>2020</strong>/01 <strong>2020</strong>/10 <strong>2020</strong>/<strong>11</strong> MoM CHGYTD CHG YoY CHG Avg Months <strong>of</strong> Inventory 2019/<strong>11</strong> <strong>2020</strong>/01 <strong>2020</strong>/10 <strong>2020</strong>/<strong>11</strong> MoM CHGYTD CHG YoY CHG<br />
Alexandria City, VA 404 316 606 562 -7.26% 77.85% 39.<strong>11</strong>% Alexandria City, VA 0.70 0.60 2.00 2.00 0.00% 233.33% 185.71%<br />
Arlington, VA 459 312 789 740 -6.21% 137.18% 61.22% Arlington, VA 0.70 0.50 3.00 2.00 -33.33% 300.00% 185.71%<br />
Fairfax City, VA 123 89 75 63 -16.00% -29.21% -48.78% Fairfax City, VA 1.20 0.60 1.70 1.20 -29.41% 100.00% 0.00%<br />
Fairfax, VA 3480 2600 3375 2707 -19.79% 4.12% -22.21% Fairfax, VA 0.90 0.70 1.40 1.10 -21.43% 57.14% 22.22%<br />
Falls Church City, VA 21 16 24 19 -20.83% 18.75% -9.52% Falls Church City, VA 0.40 0.80 1.00 1.00 0.00% 25.00% 150.00%<br />
Fauquier, VA 513 416 328 265 -19.21% -36.30% -48.34% Fauquier, VA 1.50 1.60 2.00 1.00 -50.00% -37.50% -33.33%<br />
Loudoun, VA 1690 1315 1330 996 -25.<strong>11</strong>% -24.26% -41.07% Loudoun, VA 0.80 0.70 0.90 0.80 -<strong>11</strong>.<strong>11</strong>% 14.29% 0.00%<br />
Manassas City, VA 164 121 127 99 -22.05% -18.18% -39.63% Manassas City, VA 1.00 0.60 1.00 1.00 0.00% 66.67% 0.00%<br />
Manassas Park City, VA 63 52 37 32 -13.51% -38.46% -49.21% Manassas Park City, VA 0.90 1.60 1.00 1.00 0.00% -37.50% <strong>11</strong>.<strong>11</strong>%<br />
Prince William, VA 1869 1402 1420 <strong>11</strong>05 -22.18% -21.18% -40.88% Prince William, VA 1.00 0.80 0.90 0.70 -22.22% -12.50% -30.00%<br />
New Listings 2019/<strong>11</strong> <strong>2020</strong>/01 <strong>2020</strong>/10 <strong>2020</strong>/<strong>11</strong> MoM CHGYTD CHG YoY CHG Avg DOM 2019/<strong>11</strong> <strong>2020</strong>/01 <strong>2020</strong>/10 <strong>2020</strong>/<strong>11</strong> MoM CHGYTD CHG YoY CHG<br />
Alexandria City, VA 147 181 362 213 -41.16% 17.68% 44.90% Alexandria City, VA 18 31 18 19 5.56% -38.71% 5.56%<br />
Arlington, VA 159 177 381 267 -29.92% 50.85% 67.92% Arlington, VA 16 30 16 19 18.75% -36.67% 18.75%<br />
Fairfax City, VA 26 23 47 29 -38.30% 26.09% <strong>11</strong>.54% Fairfax City, VA 38 18 28 18 -35.71% 0.00% -52.63%<br />
Fairfax, VA 910 1089 1937 1209 -37.58% <strong>11</strong>.02% 32.86% Fairfax, VA 27 33 14 17 21.43% -48.48% -37.04%<br />
Falls Church City, VA 7 7 7 9 28.57% 28.57% 28.57% Falls Church City, VA 9 25 <strong>11</strong> 13 18.18% -48.00% 44.44%<br />
Fauquier, VA 79 108 146 95 -34.93% -12.04% 20.25% Fauquier, VA 44 66 34 22 -35.29% -66.67% -50.00%<br />
Loudoun, VA 404 540 793 493 -37.83% -8.70% 22.03% Loudoun, VA 26 35 16 13 -18.75% -62.86% -50.00%<br />
Manassas City, VA 57 46 77 53 -31.17% 15.22% -7.02% Manassas City, VA 35 34 10 12 20.00% -64.71% -65.71%<br />
Manassas Park City, VA <strong>11</strong> 14 28 17 -39.29% 21.43% 54.55% Manassas Park City, VA 23 28 12 8 -33.33% -71.43% -65.22%<br />
Prince William, VA 465 536 865 616 -28.79% 14.93% 32.47% Prince William, VA 30 39 <strong>11</strong> <strong>11</strong> 0.00% -71.79% -63.33%<br />
Sold Listings 2019/<strong>11</strong> <strong>2020</strong>/01 <strong>2020</strong>/10 <strong>2020</strong>/<strong>11</strong> MoM CHGYTD CHG YoY CHG Avg Sale to Orig Price Ratio 2019/<strong>11</strong> <strong>2020</strong>/01 <strong>2020</strong>/10 <strong>2020</strong>/<strong>11</strong> MoM CHGYTD CHG YoY CHG<br />
Alexandria City, VA 146 123 255 206 -19.22% 67.48% 41.10% Alexandria City, VA 100.00% 100.00% 100.00% 100.00% 0.00% 0.00% 0.00%<br />
Arlington, VA 166 138 240 203 -15.42% 47.10% 22.29% Arlington, VA 100.00% 100.00% 100.00% 100.00% 0.00% 0.00% 0.00%<br />
Fairfax City, VA 28 14 38 30 -21.05% <strong>11</strong>4.29% 7.14% Fairfax City, VA 98.40% 99.10% 100.00% 99.20% -0.80% 0.10% 0.81%<br />
Fairfax, VA 1060 765 1551 1364 -12.06% 78.30% 28.68% Fairfax, VA 99.10% 99.30% 100.00% 100.00% 0.00% 0.70% 0.91%<br />
Falls Church City, VA <strong>11</strong> 4 15 9 -40.00% 125.00% -18.18% Falls Church City, VA 100.00% 96.70% 100.00% 99.00% -1.00% 2.38% -1.00%<br />
Fauquier, VA 86 65 143 107 -25.17% 64.62% 24.42% Fauquier, VA 97.90% 97.80% 100.00% 100.00% 0.00% 2.25% 2.15%<br />
Loudoun, VA 466 310 759 641 -15.55% 106.77% 37.55% Loudoun, VA 100.00% 99.30% 100.00% 100.00% 0.00% 0.70% 0.00%<br />
Manassas City, VA 57 28 74 57 -22.97% 103.57% 0.00% Manassas City, VA 98.50% 98.30% 101.50% 100.00% -1.48% 1.73% 1.52%<br />
Manassas Park City, VA 26 16 21 21 0.00% 31.25% -19.23% Manassas Park City, VA 100.00% 100.00% 101.30% 101.90% 0.59% 1.90% 1.90%<br />
Prince William, VA 472 387 878 685 -21.98% 77.00% 45.13% Prince William, VA 99.10% 99.00% 100.80% 101.10% 0.30% 2.12% 2.02%<br />
Pending Listings 2019/<strong>11</strong> <strong>2020</strong>/01 <strong>2020</strong>/10 <strong>2020</strong>/<strong>11</strong> MoM CHGYTD CHG YoY CHG<br />
Alexandria City, VA 125 130 220 138 -37.27% 6.15% 10.40%<br />
Arlington, VA 138 <strong>11</strong>3 168 173 2.98% 53.10% 25.36%<br />
Fairfax City, VA 28 18 27 20 -25.93% <strong>11</strong>.<strong>11</strong>% -28.57%<br />
Fairfax, VA 756 713 1307 1037 -20.66% 45.44% 37.17%<br />
Falls Church City, VA 8 2 7 6 -14.29% 200.00% -25.00%<br />
Fauquier, VA 63 60 109 98 -10.09% 63.33% 55.56%<br />
Loudoun, VA 334 309 597 487 -18.43% 57.61% 45.81%<br />
Manassas City, VA 39 34 61 47 -22.95% 38.24% 20.51%<br />
Manassas Park City, VA <strong>11</strong> 14 22 14 -36.36% 0.00% 27.27%<br />
Prince William, VA 379 377 669 585 -12.56% 55.17% 54.35%<br />
- 7 -