2020-11 -- Real Estate of Northern Virginia Market Report - November 2020 Real Estate Trends - Michele Hudnall
2021 - More of the Same This is a monthly report of the Northern Virginia Real Estate market. Weekly I post a video of current market conditions and will post the monthly report between the 10th and 15th of each month as the numbers finalize in the MLS (Bright). The numbers come from the MLS (Bright), opinions are my own. This represents the market up to 5 Bedrooms keeping the numbers sub $1.5M and out of the luxury, custom market.
2021 - More of the Same
This is a monthly report of the Northern Virginia Real Estate market. Weekly I post a video of current market conditions and will post the monthly report between the 10th and 15th of each month as the numbers finalize in the MLS (Bright).
The numbers come from the MLS (Bright), opinions are my own. This represents the market up to 5 Bedrooms keeping the numbers sub $1.5M and out of the luxury, custom market.
- TAGS
- realestateofnva
- michele-hudnall
- manassas-city
- manassas-park-city
- falls-church-city
- fairfax-city
- alexandria-city
- arlington-city
- fairfax-county
- loudoun-county
- prince-william-county
- fauquier-county
- northern-virginia-real-estate
- northern-virginia-home-prices
- northern-virginia-home-trends
- nova-real-estate-trends
- nva-real-estate-trends
- real-estate-of-nva

Create successful ePaper yourself
Turn your PDF publications into a flip-book with our unique Google optimized e-Paper software.
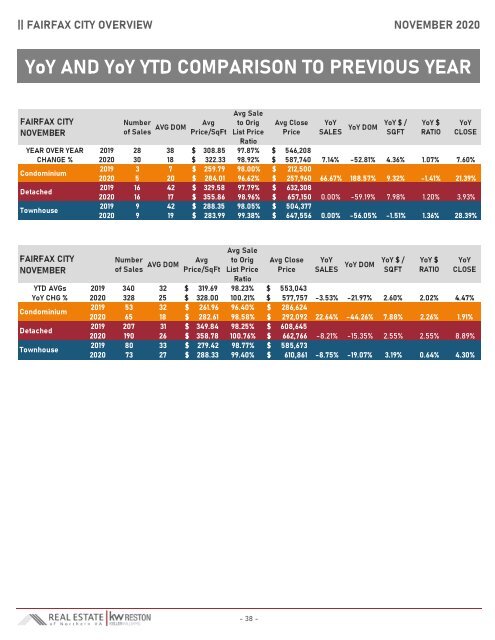
|| FAIRFAX CITY OVERVIEW NOVEMBER <strong>2020</strong><br />
YoY AND YoY YTD COMPARISON TO PREVIOUS YEAR<br />
FAIRFAX CITY<br />
NOVEMBER<br />
YEAR OVER YEAR<br />
CHANGE %<br />
Condominium<br />
Detached<br />
Townhouse<br />
Number<br />
<strong>of</strong> Sales<br />
AVG DOM<br />
Avg<br />
Price/SqFt<br />
Avg Sale<br />
to Orig<br />
List Price<br />
Ratio<br />
Avg Close<br />
Price<br />
YoY<br />
SALES<br />
YoY DOM<br />
YoY $ /<br />
SQFT<br />
YoY $<br />
RATIO<br />
YoY<br />
CLOSE<br />
2019 28 38 $ 308.85 97.87% $ 546,208<br />
<strong>2020</strong> 30 18 $ 322.33 98.92% $ 587,740 7.14% -52.81% 4.36% 1.07% 7.60%<br />
2019 3 7 $ 259.79 98.00% $ 212,500<br />
<strong>2020</strong> 5 20 $ 284.01 96.62% $ 257,960 66.67% 188.57% 9.32% -1.41% 21.39%<br />
2019 16 42 $ 329.58 97.79% $ 632,308<br />
<strong>2020</strong> 16 17 $ 355.86 98.96% $ 657,150 0.00% -59.19% 7.98% 1.20% 3.93%<br />
2019 9 42 $ 288.35 98.05% $ 504,377<br />
<strong>2020</strong> 9 19 $ 283.99 99.38% $ 647,556 0.00% -56.05% -1.51% 1.36% 28.39%<br />
FAIRFAX CITY<br />
NOVEMBER<br />
YTD AVGs<br />
YoY CHG %<br />
Condominium<br />
Detached<br />
Townhouse<br />
Number<br />
<strong>of</strong> Sales<br />
AVG DOM<br />
Avg<br />
Price/SqFt<br />
Avg Sale<br />
to Orig<br />
List Price<br />
Ratio<br />
Avg Close<br />
Price<br />
YoY<br />
SALES<br />
YoY DOM<br />
YoY $ /<br />
SQFT<br />
YoY $<br />
RATIO<br />
YoY<br />
CLOSE<br />
2019 340 32 $ 319.69 98.23% $ 553,043<br />
<strong>2020</strong> 328 25 $ 328.00 100.21% $ 577,757 -3.53% -21.97% 2.60% 2.02% 4.47%<br />
2019 53 32 $ 261.96 96.40% $ 286,624<br />
<strong>2020</strong> 65 18 $ 282.61 98.58% $ 292,092 22.64% -44.26% 7.88% 2.26% 1.91%<br />
2019 207 31 $ 349.84 98.25% $ 608,645<br />
<strong>2020</strong> 190 26 $ 358.78 100.76% $ 662,766 -8.21% -15.35% 2.55% 2.55% 8.89%<br />
2019 80 33 $ 279.42 98.77% $ 585,673<br />
<strong>2020</strong> 73 27 $ 288.33 99.40% $ 610,861 -8.75% -19.07% 3.19% 0.64% 4.30%<br />
- 38 -