2021-01 -- Real Estate of Northern Virginia Market Report - January 2021 Real Estate Trends - Michele Hudnall
2021 - The Year is Just Warming Up! The Real Estate of Northern Virginia Report is a comprehensive residential real estate update for the Northern Virginia (NVA) region. The report is a unique report for the region that is both wide and deep, focused locally with actionable advice. The data is drawn from the local listing service, Bright MLS, compiled and presented with my opinion and advice as the author, knowledge as a Realtor and lifetime resident of this region.
2021 - The Year is Just Warming Up!
The Real Estate of Northern Virginia Report is a comprehensive residential real estate update for the Northern Virginia (NVA) region. The report is a unique report for the region that is both wide and deep, focused locally with actionable advice.
The data is drawn from the local listing service, Bright MLS, compiled and presented with my opinion and advice as the author, knowledge as a Realtor and lifetime resident of this region.
- TAGS
- realestateofnva
- michele-hudnall
- northern-virginia-real-estate
- nova-real-estate-trends
- nva-real-estate-trends
- real-estate-of-nva
- northern-virginia-home-prices
- northern-virginia-home-trends
- your-northern-virginia-realtor
- best-northern-virginia-realtor
- manassas-real-estate
- falls-church-real-estate
- fairfax-real-estate
- alexandrai-real-estate
- arlington-real-estate
- fairfax-county-real-estate
- loudoun-county-real-estate
- prince-william-real-estate
- fauquier-county-real-estate

Create successful ePaper yourself
Turn your PDF publications into a flip-book with our unique Google optimized e-Paper software.
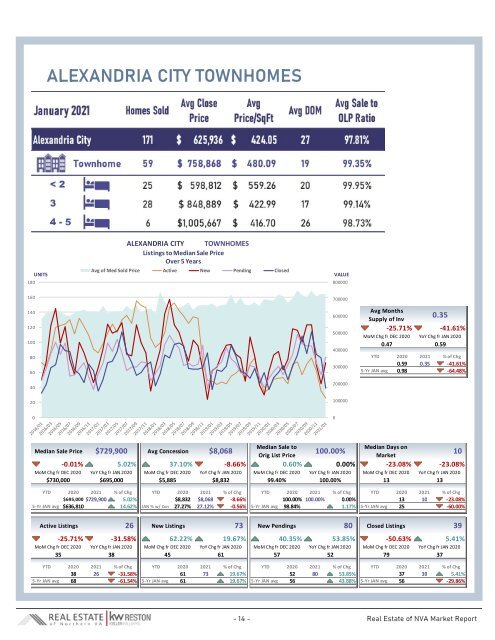
ALEXANDRIA CITY TOWNHOMES<br />
180<br />
UNITS<br />
ALEXANDRIA CITY TOWNHOMES<br />
Listings to Median Sale Price<br />
Over 5 Years<br />
Avg <strong>of</strong> Med Sold Price Active New Pending Closed<br />
VALUE<br />
800000<br />
160<br />
700000<br />
140<br />
120<br />
100<br />
80<br />
60<br />
40<br />
600000<br />
500000<br />
400000<br />
300000<br />
200000<br />
Avg Months<br />
Supply <strong>of</strong> Inv<br />
0.35<br />
-25.71% -41.61%<br />
MoM Chg fr DEC 2020 YoY Chg fr JAN 2020<br />
0.47 0.59<br />
YTD 2020 <strong>2021</strong> % <strong>of</strong> Chg<br />
0.59 0.35 -41.61%<br />
5-Yr JAN avg 0.98 -64.48%<br />
20<br />
100000<br />
0<br />
0<br />
Median Sale to<br />
Median Days on<br />
Median Sale Price $729,900 Avg Concession $8,068<br />
100.00%<br />
Orig List Price<br />
<strong>Market</strong><br />
10<br />
-0.<strong>01</strong>% 5.02% 37.10% -8.66%<br />
0.60% 0.00% -23.08% -23.08%<br />
MoM Chg fr DEC 2020 YoY Chg fr JAN 2020 MoM Chg fr DEC 2020 YoY Chg fr JAN 2020 MoM Chg fr DEC 2020 YoY Chg fr JAN 2020 MoM Chg fr DEC 2020 YoY Chg fr JAN 2020<br />
$730,000 $695,000 $5,885 $8,832 99.40% 100.00%<br />
13 13<br />
YTD 2020 <strong>2021</strong> % <strong>of</strong> Chg YTD 2020 <strong>2021</strong> % <strong>of</strong> Chg YTD 2020 <strong>2021</strong> % <strong>of</strong> Chg YTD 2020 <strong>2021</strong> % <strong>of</strong> Chg<br />
$695,000 $729,900 5.02% $8,832 $8,068 -8.66% 100.00% 100.00% 0.00% 13 10 -23.08%<br />
5-Yr JAN avg $636,810 14.62% JAN % w/ Con 27.27% 27.12% -0.56% 5-Yr JAN avg 98.84% 1.17% 5-Yr JAN avg 25 -60.00%<br />
Active Listings 26<br />
New Listings 73 New Pendings 80 Closed Listings<br />
-25.71% -31.58% 62.22% 19.67% 40.35% 53.85% -50.63%<br />
5.41%<br />
MoM Chg fr DEC 2020 YoY Chg fr JAN 2020 MoM Chg fr DEC 2020 YoY Chg fr JAN 2020 MoM Chg fr DEC 2020 YoY Chg fr JAN 2020 MoM Chg fr DEC 2020 YoY Chg fr JAN 2020<br />
35 38 45 61 57 52 79 37<br />
YTD 2020 <strong>2021</strong> % <strong>of</strong> Chg YTD 2020 <strong>2021</strong> % <strong>of</strong> Chg YTD 2020 <strong>2021</strong> % <strong>of</strong> Chg YTD 2020 <strong>2021</strong> % <strong>of</strong> Chg<br />
38 26 -31.58% 61 73 19.67% 52 80 53.85% 37 39 5.41%<br />
5-Yr JAN avg 68 -61.54% 5-Yr JAN avg 61 19.67% 5-Yr JAN avg 56 43.88% 5-Yr JAN avg 56 -29.86%<br />
39<br />
- 14 - <strong>Real</strong> <strong>Estate</strong> <strong>of</strong> NVA <strong>Market</strong> <strong>Report</strong>