2021-01 -- Real Estate of Northern Virginia Market Report - January 2021 Real Estate Trends - Michele Hudnall
2021 - The Year is Just Warming Up! The Real Estate of Northern Virginia Report is a comprehensive residential real estate update for the Northern Virginia (NVA) region. The report is a unique report for the region that is both wide and deep, focused locally with actionable advice. The data is drawn from the local listing service, Bright MLS, compiled and presented with my opinion and advice as the author, knowledge as a Realtor and lifetime resident of this region.
2021 - The Year is Just Warming Up!
The Real Estate of Northern Virginia Report is a comprehensive residential real estate update for the Northern Virginia (NVA) region. The report is a unique report for the region that is both wide and deep, focused locally with actionable advice.
The data is drawn from the local listing service, Bright MLS, compiled and presented with my opinion and advice as the author, knowledge as a Realtor and lifetime resident of this region.
- TAGS
- realestateofnva
- michele-hudnall
- northern-virginia-real-estate
- nova-real-estate-trends
- nva-real-estate-trends
- real-estate-of-nva
- northern-virginia-home-prices
- northern-virginia-home-trends
- your-northern-virginia-realtor
- best-northern-virginia-realtor
- manassas-real-estate
- falls-church-real-estate
- fairfax-real-estate
- alexandrai-real-estate
- arlington-real-estate
- fairfax-county-real-estate
- loudoun-county-real-estate
- prince-william-real-estate
- fauquier-county-real-estate

You also want an ePaper? Increase the reach of your titles
YUMPU automatically turns print PDFs into web optimized ePapers that Google loves.
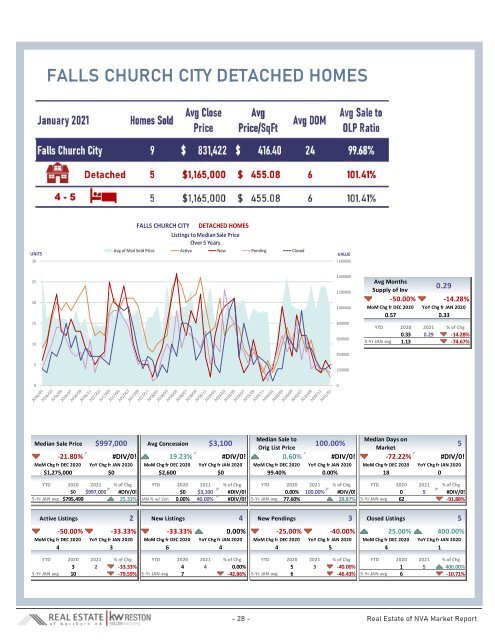
FALLS CHURCH CITY DETACHED HOMES<br />
UNITS<br />
30<br />
FALLS CHURCH CITY DETACHED HOMES<br />
Listings to Median Sale Price<br />
Over 5 Years<br />
Avg <strong>of</strong> Med Sold Price Active New Pending Closed<br />
VALUE<br />
1600000<br />
25<br />
20<br />
15<br />
10<br />
5<br />
1400000<br />
1200000<br />
1000000<br />
800000<br />
600000<br />
400000<br />
200000<br />
Avg Months<br />
Supply <strong>of</strong> Inv<br />
0.29<br />
-50.00% -14.28%<br />
MoM Chg fr DEC 2020 YoY Chg fr JAN 2020<br />
0.57 0.33<br />
YTD 2020 <strong>2021</strong> % <strong>of</strong> Chg<br />
0.33 0.29 -14.28%<br />
5-Yr JAN avg 1.13 -74.67%<br />
0<br />
0<br />
Median Sale to<br />
Median Days on<br />
Median Sale Price $997,000 Avg Concession $3,100<br />
100.00%<br />
Orig List Price<br />
<strong>Market</strong><br />
5<br />
-21.80% #DIV/0! 19.23% #DIV/0!<br />
0.60% #DIV/0! -72.22% #DIV/0!<br />
MoM Chg fr DEC 2020 YoY Chg fr JAN 2020 MoM Chg fr DEC 2020 YoY Chg fr JAN 2020 MoM Chg fr DEC 2020 YoY Chg fr JAN 2020 MoM Chg fr DEC 2020 YoY Chg fr JAN 2020<br />
$1,275,000 $0 $2,600 $0 99.40% 0.00%<br />
18 0<br />
YTD 2020 <strong>2021</strong> % <strong>of</strong> Chg YTD 2020 <strong>2021</strong> % <strong>of</strong> Chg YTD 2020 <strong>2021</strong> % <strong>of</strong> Chg YTD 2020 <strong>2021</strong> % <strong>of</strong> Chg<br />
$0 $997,000 #DIV/0! $0 $3,100 #DIV/0! 0.00% 100.00% #DIV/0! 0 5 #DIV/0!<br />
5-Yr JAN avg $795,499 25.33% JAN % w/ Con 0.00% 40.00% #DIV/0! 5-Yr JAN avg 77.60% 28.87% 5-Yr JAN avg 62 -91.88%<br />
Active Listings 2<br />
New Listings 4 New Pendings 3 Closed Listings<br />
-50.00% -33.33% -33.33% 0.00% -25.00% -40.00% 25.00% 400.00%<br />
MoM Chg fr DEC 2020 YoY Chg fr JAN 2020 MoM Chg fr DEC 2020 YoY Chg fr JAN 2020 MoM Chg fr DEC 2020 YoY Chg fr JAN 2020 MoM Chg fr DEC 2020 YoY Chg fr JAN 2020<br />
4 3 6 4 4 5 4 1<br />
YTD 2020 <strong>2021</strong> % <strong>of</strong> Chg YTD 2020 <strong>2021</strong> % <strong>of</strong> Chg YTD 2020 <strong>2021</strong> % <strong>of</strong> Chg YTD 2020 <strong>2021</strong> % <strong>of</strong> Chg<br />
3 2 -33.33% 4 4 0.00% 5 3 -40.00% 1 5 400.00%<br />
5-Yr JAN avg 10 -79.59% 5-Yr JAN avg 7 -42.86% 5-Yr JAN avg 6 -46.43% 5-Yr JAN avg 6 -10.71%<br />
5<br />
- 28 - <strong>Real</strong> <strong>Estate</strong> <strong>of</strong> NVA <strong>Market</strong> <strong>Report</strong>