charts - 03
charts - 03
charts - 03

You also want an ePaper? Increase the reach of your titles
YUMPU automatically turns print PDFs into web optimized ePapers that Google loves.
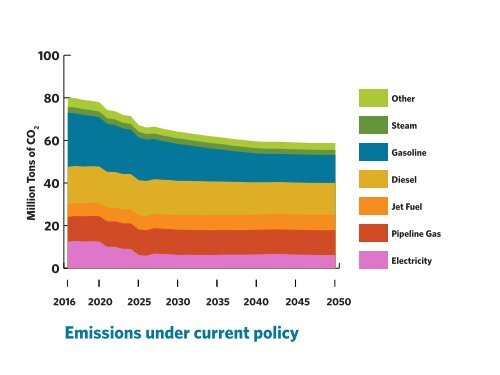
100<br />
Million Tons of CO 2<br />
80<br />
60<br />
40<br />
20<br />
0<br />
Other<br />
Steam<br />
Gasoline<br />
Diesel<br />
Jet Fuel<br />
Pipeline Gas<br />
Electricity<br />
2016 2020 2025 2<strong>03</strong>0 2<strong>03</strong>5 2040 2045 2050<br />
Emissions under current policy
100<br />
Millions Tons of CO 2<br />
80<br />
60<br />
40<br />
20<br />
0<br />
Other<br />
Steam<br />
Gasoline<br />
Diesel<br />
Jet Fuel<br />
Pipeline Gas<br />
Electricity<br />
2016 2020 2025 2<strong>03</strong>0 2<strong>03</strong>5 2040 2045 2050<br />
A low-carbon pathway
Trillion British Thermal Units (BTUs)<br />
1500<br />
1200<br />
900<br />
600<br />
300<br />
0<br />
Other<br />
Steam<br />
Gasoline<br />
Diesel<br />
Jet Fuel<br />
Pipeline Gas<br />
Electricity<br />
2016 2020 2025 2<strong>03</strong>0 2<strong>03</strong>5 2040 2045 2050<br />
Energy sources in a low-carbon pathway
100%<br />
80%<br />
60%<br />
40%<br />
20%<br />
0%<br />
Wind - All Types<br />
Solar - All Types<br />
Hydroelectric<br />
Nuclear<br />
Other Renewable<br />
Gas<br />
Other Fossil<br />
Coal<br />
2016 2020 2025 2<strong>03</strong>0 2<strong>03</strong>5 2040 2045 2050<br />
Electricity sources in a low-carbon pathway