within reach - 04
within reach - 04
within reach - 04

Create successful ePaper yourself
Turn your PDF publications into a flip-book with our unique Google optimized e-Paper software.
Within Reach<br />
The Path to 100% Fossil-Free<br />
Electricity in the Pacific Northwest<br />
September 2018<br />
climate solutions<br />
accelerating the transition to our clean energy future
Climate Solutions<br />
For more than 20 years, Climate Solutions has<br />
advocated for a thriving, equitable Northwest,<br />
powered by clean energy, inspiring the transition<br />
to sustainable prosperity across the nation and<br />
beyond.<br />
As a Northwest-based clean energy economy<br />
nonprofit, we accelerate solutions to the climate<br />
crisis by:<br />
• championing transformational policies and<br />
market-based innovations to address the<br />
climate crisis;<br />
• catalyzing powerful partnerships and helping<br />
grow a diverse movement for action and<br />
accountability; and<br />
• communicating a bold vision for solutions at<br />
the scale required by climate science.<br />
Primary authors<br />
Kelly Hall, Washington Policy Manager,<br />
Climate Solutions<br />
Vlad Gutman-Britten, Washington<br />
Director, Climate Solutions<br />
Design<br />
Shew Design<br />
Editing<br />
Kimberly Larson, Communications<br />
Director, Climate Solutions<br />
Jonathan Lawson, Digital<br />
Communications Manager, Climate Solutions<br />
Photo credits<br />
Tony Webster; Moontown Foundation;<br />
Climate Solutions<br />
climate solutions<br />
Within Reach: The Path to 100% Fossil-Free Electricity<br />
accelerating in the the Pacific transition to Northwest our clean energy future | Climate Solutions<br />
page 2
Table of Contents<br />
Acknowledgements ............................................4<br />
Executive Summary ............................................5<br />
PART I: The Role of Electricity in a Low-Carbon Future .............7<br />
Decarbonization Pathways Across the United States<br />
A Pathway for the State of Washington<br />
PART II: Modeling the Pathways to a 100% Fossil-Free Grid ........11<br />
Research Background<br />
100% Fossil-Free Electricity Scenarios<br />
Scenario 1: 100% reduction with hydro, wind, geothermal, solar (HWGS) .... 13<br />
Scenario 2: 100% reduction with HWGS + biogas ......................... 15<br />
Scenario 2B: 100% reduction with HWGS, biogas + updated renewable costs.17<br />
Scenario 3: 100% reduction + policy flexibility............................. 19<br />
Summary and Conclusion<br />
climate solutions<br />
Within Reach: The Path to 100% Fossil-Free Electricity<br />
accelerating in the the Pacific transition to Northwest our clean energy future | Climate Solutions<br />
page 3
Acknowledgements<br />
We would like to thank Arne Olson, Oluwafemi Sawyer, Kiran Chawla, and Nick Schlag<br />
of Energy and Environmental Economics for the in-depth analysis on the 100% scenarios<br />
discussed in this paper; and Nicole Hughes, Michael O’Brien, and Amanda Jahshan of<br />
Renewable Northwest for their thoughtful review and comments.<br />
climate solutions<br />
Within Reach: The Path to 100% Fossil-Free Electricity<br />
accelerating in the the Pacific transition to Northwest our clean energy future | Climate Solutions<br />
page 4
Executive Summary<br />
For over a century, the economy and energy<br />
systems in the United States have largely been<br />
reliant on polluting fossil fuels. Now, the public<br />
has shown a strong desire to shift towards<br />
cleaner sources of energy, the economy is<br />
leveling the playing field for renewable energy,<br />
and jurisdictions all across the United States are<br />
making climate commitments to transition away<br />
from fossil fuels. With a large renewable power<br />
base, abundant resource potential, and a tradition<br />
of clean energy and technology leadership,<br />
the Pacific Northwest is well-positioned to be at<br />
the forefront of this transition. This study takes a<br />
deeper look at Washington State as a jurisdiction<br />
poised to consider policy options to make that<br />
transition <strong>within</strong> <strong>reach</strong>.<br />
The University of Washington’s Climate Impacts<br />
Group recommends that Washington revise its<br />
greenhouse gas limits in statute to 80% reductions<br />
below 1990 levels by 2050, 1 reflecting the<br />
global emissions reductions necessary to prevent<br />
catastrophic climate change. Without policy<br />
interventions, current business-as-usual trajectories<br />
suggest that Washington is on track to<br />
exceed these greenhouse gas emissions targets<br />
by nearly 50 million metric tons in 2050.<br />
Deep pollution reduction across the economy<br />
will rely on replacing a wide range of fossil fuel<br />
uses with fossil-free electricity. Because electricity<br />
plays such a critical role in a low-carbon future,<br />
even if all other sectors significantly reduce<br />
greenhouse gas emissions, Washington’s busi-<br />
ness-as-usual utility planning could result in the<br />
state exceeding its energy emissions target by<br />
approximately 50% without continued efforts to<br />
decarbonize the electricity sector. With its abundant<br />
base of hydroelectric power, the Northwest<br />
can move to 100% fossil-free electricity rapidly,<br />
creating a clean grid to expedite zero-emissions<br />
electrification.<br />
Climate Solutions commissioned new research<br />
identifying pathways to phase out fossil fuels<br />
from the power sector in the Pacific Northwest.<br />
The analysis, conducted by Energy and Environmental<br />
Economics (E3), modeled several<br />
scenarios that each provide a different strategy<br />
for achieving 100% fossil-free electricity in the<br />
Pacific Northwest by 2050. The analysis finds<br />
that building on the Northwest’s foundation<br />
of hydropower, transitioning away from fossil<br />
fuels, and investing in renewable energy, energy<br />
storage, and energy efficiency can be affordable<br />
and reliable. Of the scenarios modeled, renewable<br />
electricity generation using wind, solar, and<br />
renewable natural gas appears to provide the<br />
most cost-effective pathway to a fossil-free grid.<br />
This scenario results in an incremental cost of<br />
approximately a half cent per kilowatt-hour levelized<br />
across the region, prior to accounting for<br />
any other costs and risks of fossil fuels.<br />
The new research confirms that phasing out<br />
fossil fuels while phasing in non-fossil sources<br />
of energy can provide clean, reliable, affordable<br />
power. Washington utilities are planning to<br />
1 Washington Department of Ecology. “Washington Greenhouse Gas Emission Reduction Limits.” https://fortress.wa.gov/<br />
ecy/publications/documents/1601010.pdf<br />
climate solutions<br />
Within Reach: The Path to 100% Fossil-Free Electricity<br />
accelerating in the the Pacific transition to Northwest our clean energy future | Climate Solutions<br />
page 5
invest in over 2300 megawatts 1 in new gas plant<br />
capacity over the next two decades, which could<br />
put their customers at risk if these investments<br />
foreclose the opportunity for increased investment<br />
in fossil-free sources of energy. Significant<br />
new investments in infrastructure expected<br />
to rely on fossil fuels could result in stranded<br />
assets and leave customers on the hook for the<br />
costs of early retirements. A transition to 100%<br />
fossil-free electricity will take this into consideration<br />
up front and avoid risky investments in<br />
infrastructure that will cause us to exceed our<br />
carbon goals.<br />
The analysis described here maps one path for<br />
deep pollution reduction in the Pacific Northwest’s<br />
electricity sector. Follow-on research<br />
should evaluate additional strategies and market<br />
dynamics, such as higher levels of energy efficiency<br />
and demand response, improved accounting<br />
for out-of-region renewable resources,<br />
improved evaluation of storage use across days,<br />
additional zero-carbon resources like power-togas,<br />
and other factors that would likely reduce<br />
any challenges or costs associated with achieving<br />
a fossil-free grid.<br />
1 Puget Sound Energy. “2017 PSE Integrated Resource Plan.” https://pse.com/aboutpse/EnergySupply/Documents/02_<br />
IRP17_Ch2_102017b.pdf see also: Avista. “2017 Integrated Resource Plan.” www.myavista.com/-/media/myavista/content-documents/about-us/our-company/irp-documents/2017-electric-irp-final.pdf?la=en<br />
climate solutions<br />
Within Reach: The Path to 100% Fossil-Free Electricity<br />
accelerating in the the Pacific transition to Northwest our clean energy future | Climate Solutions<br />
page 6
P A R T I<br />
The Role of Electricity in a<br />
Low-Carbon Future<br />
Decarbonization Pathways Across<br />
the United States<br />
The United States has shifted aggressively<br />
towards cleaner sources of energy for economic,<br />
public health, and environmental reasons.<br />
Several states have begun to deploy strategies to<br />
cut emissions by millions of tons per year. As we<br />
move away from coal, we see more reliance on<br />
renewable energy and energy efficiency, but we<br />
also see large increases in the use of natural gas,<br />
which, like coal and oil, is a fossil fuel.<br />
Though gas plants fueled by fossil fuels emit<br />
between 40% and 60% fewer greenhouse gases<br />
than coal per megawatt-hour produced at the<br />
smokestack, this reduction still falls short to<br />
achieve the greenhouse emissions reductions<br />
necessary. Furthermore, leakage of gas from extraction<br />
and delivery causes methane emissions<br />
that may offset the lower emission rate at the<br />
smokestack. Over a twenty year period, a leakage<br />
rate of just 3.9% would render fossil natural<br />
gas as damaging as coal. 1 Even before accounting<br />
for this leakage, fossil gas plants account for 506<br />
million metric tons of carbon emission annually<br />
in the United States, and a comprehensive<br />
number is likely significantly higher. 2 Though<br />
emissions gradually decline, the United States is<br />
not yet pursuing the level of emission reductions<br />
needed to prevent further climate instability and<br />
irreversible impacts from climate change.<br />
Numerous studies covering different geographies<br />
have all <strong>reach</strong>ed a similar conclusion: in order<br />
to achieve meaningful economy-wide greenhouse<br />
gas emissions reductions, the electricity<br />
sector must approach zero emissions. While<br />
some studies consider employing a variety of<br />
strategies to achieve decarbonization in the<br />
electricity sector, including carbon capture and<br />
storage, conclusions remain consistent that the<br />
use fossil fuels must largely cease. An electrical<br />
system that continues to rely on uncontrolled<br />
fossil natural gas will not result in the necessary<br />
greenhouse gas reductions, and new research<br />
demonstrates that a transition to a fossil-free<br />
grid can be affordable and feasible with existing<br />
technologies.<br />
The United States Mid-Century Strategy for Deep<br />
Decarbonization, a federal effort to chart a path<br />
to meeting national climate goals released in<br />
November 2016, 3 found that achieving national<br />
carbon reduction goals would require electricity<br />
to be generated almost entirely from low-carbon<br />
1 Nicolas Sanchez, David C. Mays. “Effect of methane leakage on the greenhouse gas footprint of electricity generation.”<br />
Climatic Change. 2015.<br />
2 U.S. Energy Information Administration. “Frequently Asked Questions: How much of U.S. carbon dioxide emissions are<br />
associated with electricity generation?” 8 June 2018. www.eia.gov/tools/faqs/faq.php?id=77&t=11<br />
3 The White House. United States Mid-Century Strategy For Deep Decarbonization. November 2016. https://unfccc.int/files/<br />
focus/long-term_strategies/application/pdf/us_mid_century_strategy.pdf<br />
climate solutions<br />
Within Reach: The Path to 100% Fossil-Free Electricity<br />
accelerating in the the Pacific transition to Northwest our clean energy future | Climate Solutions<br />
page 7
sources by 2050. The report evaluated a mix<br />
of renewables, fossil fuels paired with carbon<br />
capture, utilization, and storage (CCUS), and<br />
nuclear power to achieve deep reductions in<br />
the electricity sector. Their prescription, which<br />
sought to optimize economy-wide pollution<br />
reduction, left little room for fossil fuels not<br />
employing CCUS, and called for the electricity<br />
sector to achieve much deeper reductions than<br />
the economy-wide target of 80% compared to<br />
1990 levels. Their blend of low-carbon generation<br />
sources exceeds 90% of the resource mix<br />
in their 80% reduction benchmark scenario. The<br />
study concludes that electricity must lead the<br />
transition into a low-carbon economy, in part<br />
due to the cost-competitiveness of available<br />
technologies, centralized decision-making and<br />
generation assets, and the ability of customers to<br />
choose low-carbon distributed energy.<br />
Another study, Northeast 80x50 Pathway, 1 was<br />
published by National Grid, a major gas and electric<br />
utility serving parts of New York, Massachusetts,<br />
and Rhode Island whose electricity generation<br />
is made up of over 50% fossil fuels. 2 The<br />
report analyzes how New York and New England<br />
can achieve economy-wide 40% reductions<br />
below 1990 levels by 2030 and 80% reductions<br />
below 1990 levels by 2050, concluding that the<br />
electricity sector will need to be a zero-carbon<br />
system by 2050. The study acknowledges that<br />
the exact sources of energy supply and storage<br />
are not yet known, but that the role of energy<br />
storage and renewables will grow as we decarbonize<br />
the sector.<br />
On the other hand, National Renewable Energy<br />
Laboratory’s (NREL) report, Electrification &<br />
Decarbonization: Exploring U.S. Energy Use and<br />
Greenhouse Gas Emissions in Scenarios with Widespread<br />
Electrification and Power Sector Decarbonization,<br />
3 demonstrates the risks of failing to <strong>reach</strong><br />
zero-carbon or near-zero-carbon electricity by<br />
2050. NREL studied the impacts of deep elec-<br />
trification of residential, industrial, commercial,<br />
and transportation uses of energy. They modeled<br />
a scenario with no electric sector carbon<br />
reduction policy that allowed U.S. utilities to<br />
make business-as-usual decisions about future<br />
resource procurements, and a second scenario<br />
that required 80% greenhouse gas reductions<br />
in electric sector emissions. While the second<br />
scenario requiring some electric sector reductions<br />
resulted in deeper overall reductions,<br />
both scenarios failed to achieve economy-wide<br />
decarbonization consistent with 80% reductions<br />
by 2050. In the absence of power sector<br />
decarbonization, electrification will lead to 41%<br />
economy-wide reductions below 2005 levels,<br />
which falls sig nificantly short of the reductions<br />
necessary. 4<br />
Even with deep electrification and decarbonization<br />
in other sectors, these studies demonstrate<br />
that it is critical the electricity sector go further<br />
in order to achieve economy-wide emissions reductions<br />
targets. These findings and others align<br />
with Washington’s decarbonization analysis,<br />
discussed below.<br />
A Pathway for the State of<br />
Washington<br />
In 2017, Washington published the first economy-wide<br />
pathway analysis for the state, the<br />
Deep Decarbonization Pathways Study. 5 The<br />
results showed that a transition to clean energy<br />
that reduces greenhouse gas emissions by 80%<br />
below 1990 levels is possible and affordable, but<br />
requires ambitious and aggressive action at a<br />
scale not yet undertaken.<br />
The study’s emissions reduction target tracks<br />
current requirements in peer West Coast jurisdictions<br />
such as California and Oregon. The<br />
Western Climate Initiative jurisdictions, which<br />
include western U.S. states and Canadian provinces,<br />
previously agreed to an 80% reduction<br />
target as a region, and many states in the U.S.<br />
1 National Grid. Northeast 80X50 Pathway. 2018. http://news.nationalgridus.com/wp-content/uploads/2018/06/80x50-White-Paper-FINAL.pdf<br />
2 National Grid. “RI Disclosure Label.” November 2017. www.nationalgridus.com/media/pdfs/billing-payments/bill-inserts/<br />
ri/cm4391_ri-edisclosure.pdf<br />
3 National Renewable Energy Laboratory. Electrification & Decarbonization: Exploring U.S. Energy Use and Greenhouse Gas<br />
Emissions in Scenarios with Widespread Electrification and Power Sector Decarbonization. July 2017. www.nrel.gov/docs/<br />
fy17osti/68214.pdf<br />
4 Ibid.<br />
5 Evolved Energy Research. Deep Decarbonization Pathways Analysis for Washington State. December 2016. www.governor.<br />
wa.gov/sites/default/files/Deep_Decarbonization_Pathways_Analysis_for_Washington_State.pdf<br />
climate solutions<br />
Within Reach: The Path to 100% Fossil-Free Electricity<br />
accelerating in the the Pacific transition to Northwest our clean energy future | Climate Solutions<br />
page 8
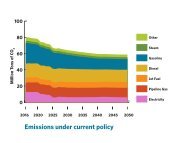
Million Metric Tons of CO 2<br />
100<br />
80<br />
60<br />
40<br />
20<br />
0<br />
Energy Emissions Target<br />
(9.9 Million Metric Tons)<br />
2016 2020 2025 2030 2035 2<strong>04</strong>0 2<strong>04</strong>5 2050<br />
Energy emissions under current policy<br />
Other<br />
Steam<br />
Gasoline<br />
Diesel<br />
Jet Fuel<br />
Pipeline Gas<br />
Electricity<br />
Figure 1: Washington’s business-as-usual energy emissions trajectory<br />
falls nearly 50 million metric tons short of target.<br />
Energy vs. Non-Energy Global Warming Emissions<br />
Energy emissions include greenhouse gas emissions from the electric sector,<br />
the transportation sector, buildings, and other sources that generally result<br />
from the combustion of fuels. Non-energy emissions are those that originate<br />
from industrial processes, the agriculture sector and waste management, and<br />
generally do not rely on the combustion of a fuel.<br />
100<br />
have enacted or are considering aggressive<br />
carbon reduction policies to achieve greenhouse<br />
gas reduction goals, shown in figure 2. For example,<br />
California recently passed a 100% clean<br />
bill (SB100) which requires a mix of renewable<br />
and zero carbon electricity to match the state’s<br />
retail electricity sales by 2<strong>04</strong>5, and the state has<br />
already exceeded its 50% clean energy goals<br />
with gross state product up over 80%. 1<br />
As can be seen in figure 1, Washington is not on<br />
track to achieve emission reductions consistent<br />
with 80% reduction targets. Under existing policies,<br />
Washington’s energy emissions will gradually<br />
decline over the next two decades before<br />
leveling off. Electricity sector emissions are projected<br />
to decline as coal facilities are replaced<br />
with a mix of new fossil natural gas generation<br />
and renewable sources of energy. Gasoline<br />
and diesel emissions are also projected to fall<br />
as combustion engines become more efficient<br />
and an increasing share of electric vehicles are<br />
sold. Greenhouse gas emissions associated with<br />
fossil natural gas used in industrial settings and<br />
for space and water heating are the only major<br />
emissions sources projected to increase.<br />
The business-as-usual path leads to reductions<br />
of about a quarter of Washington’s 2016 energy<br />
emissions, but falls short of the 2050 target by<br />
nearly 50 million tons. Without further action<br />
to reduce emissions, Washington is projected<br />
to exceed emissions targets in 2050 by nearly<br />
500%.<br />
Million Metric Tons of CO 2<br />
80<br />
60<br />
40<br />
20<br />
0<br />
Energy Emissions Target<br />
(9.9 Million Metric Tons)<br />
2016 2020 2025 2030 2035 2<strong>04</strong>0 2<strong>04</strong>5 2050<br />
A low-carbon pathway<br />
Figure 2: Deep emissions reductions in the electricity sector and<br />
widespread electrification create a pathway for Washington to<br />
achieve greenhouse gas emissions targets.<br />
climate solutions<br />
Other<br />
Steam<br />
Gasoline<br />
Diesel<br />
Jet Fuel<br />
Pipeline Gas<br />
Electricity<br />
Within Reach: The Path to 100% Fossil-Free Electricity<br />
accelerating in the the Pacific transition to Northwest our clean energy future | Climate Solutions<br />
A low-carbon economy that prioritizes decarbonization<br />
of the electricity sector and electrification<br />
of end uses leads to a significant reduction<br />
of total energy usage and deep emissions<br />
reductions. Total energy usage would decline<br />
significantly over the 34 years covered by the<br />
study, due to electrification and a more efficient<br />
use of energy. While this scenario projects an<br />
overall reduction in energy usage of 40% by<br />
2050, Washington would be expected to see a<br />
27% increase in energy use from the electricity<br />
sector due to the electrification of other sources<br />
of energy, making up 52% of Washington’s total<br />
energy use in 2050, compared to just 24% in<br />
2016.<br />
In this scenario, diesel and jet fuels would be de-<br />
1 California Energy Commission. “Greenhouse Gas Emissions<br />
Reductions.” December 2017. www.energy.ca.gov/<br />
renewables/tracking_progress/documents/Greenhouse_<br />
Gas_Emissions_Reductions.pdf<br />
page 9
ived from renewable sources, and industrial uses<br />
would continue to use a combination of fossil<br />
natural gas and renewable natural gas. Much of<br />
the rest of the economy would be electrified by<br />
2050, including all single occupancy vehicles and<br />
significant increases in electric heat pumps.<br />
Trillion British Thermal Units (BTUs)<br />
1500<br />
1200<br />
900<br />
600<br />
300<br />
0<br />
100%<br />
80%<br />
60%<br />
2016 2020 2025 2030 2035 2<strong>04</strong>0 2<strong>04</strong>5 2050<br />
Energy sources in a low-carbon pathway<br />
Figure 3. As Washington electrifies the economy, the share of<br />
energy coming from electricity more than doubles.<br />
Other<br />
Steam<br />
Gasoline<br />
Diesel<br />
Jet Fuel<br />
Pipeline Gas<br />
Electricity<br />
Wind - All Types<br />
Solar - All Types<br />
Hydroelectric<br />
Nuclear<br />
This projected increased share of electricity use<br />
in Washington, shown in figure 3, underscores<br />
the central role a clean power policy has in<br />
achieving deep carbon reduction goals. Research<br />
consistently shows the importance of decarbonizing<br />
electricity to achieve long-term carbon<br />
reduction goals. Without electricity sector decarbonization,<br />
Washington’s business-as-usual<br />
utility planning will result in the state exceeding<br />
its energy sector greenhouse gas emissions target<br />
by approximately 50%.<br />
As can be seen in figure 4, the electricity sector<br />
must gradually phase out fossil fuels by 2050,<br />
leaving less than 2% of electricity coming from<br />
fossil fuels. In a low-carbon 2050, Washington<br />
would continue to rely on a robust hydropower<br />
base, with new energy sources principally from<br />
wind and solar. By 2050, Washington would generate<br />
over 98% of its electricity from non-fossil<br />
fuel sources.<br />
It is worth noting that the Deep Decarbonization<br />
Pathways Study made a number of assumptions<br />
that may impact Washington’s path to decarbonization.<br />
First, the study assumed that all<br />
bioenergy is carbon neutral; and second, the<br />
study did not attribute emissions from natural<br />
gas leakage to Washington, which may not be<br />
accounted for where the leakage occurs. These<br />
two assumptions indicate that the state may<br />
need to pursue deeper penetrations of fossil-free<br />
electricity to achieve emissions reductions goals,<br />
likely between 98-100%, after accounting for<br />
leakage emissions and emissions from more<br />
carbon-intensive forms of bioenergy.<br />
40%<br />
20%<br />
0%<br />
Other Renewable<br />
Gas<br />
Other Fossil<br />
Coal<br />
2016 2020 2025 2030 2035 2<strong>04</strong>0 2<strong>04</strong>5 2050<br />
Electricity sources in a low-carbon pathway<br />
Figure 4: Electricity generation in a low-carbon future is over 98%<br />
fossil-free.<br />
climate solutions<br />
Within Reach: The Path to 100% Fossil-Free Electricity<br />
accelerating in the the Pacific transition to Northwest our clean energy future | Climate Solutions<br />
page 10
P A R T I I<br />
Modeling the Pathways<br />
to a 100% Fossil-Free Grid<br />
Research Background<br />
In 2017, the Public Generating Pool (“PGP”), a<br />
group of ten publicly owned utilities in the Pacific<br />
Northwest, sponsored a study conducted by E3,<br />
called the Pacific Northwest Low-Carbon Scenario<br />
Analysis, that examined policies and potential<br />
pathways for achieving 80% carbon reductions<br />
in the electricity sector. 1 Based on the findings<br />
that the electricity sector must exceed 80% reductions<br />
in order to achieve 80% economy-wide<br />
emissions reductions, Climate Solutions sponsored<br />
a follow-up study, also conducted by E3,<br />
that examined pathways to full decarbonization<br />
of the grid in the Pacific Northwest. This follow-up<br />
study held constant the assumptions in<br />
the original PGP study to achieve a true comparative<br />
analysis of the impact of additional scenarios.<br />
Both studies used the RESOLVE model, an<br />
optimal capacity expansion model that allows<br />
for user-selected constraints and optimizes the<br />
most cost-effective portfolio of resources <strong>within</strong><br />
those constraints.<br />
100% Fossil-Free Electricity<br />
Scenarios<br />
Climate Solutions modeled three main scenarios<br />
examining different pathways to 100% fossil-free<br />
electricity in the Pacific Northwest. 2 Each<br />
scenario permits varying levels of flexibility and<br />
resource options for procurement:<br />
• The first scenario limits fossil-free generating<br />
resource options to the same options as the<br />
original 2017 study, which includes hydroelectric,<br />
wind, solar, and geothermal resources.<br />
• The second scenario adds to the first scenario<br />
the availability of renewable natural gas. With<br />
the same resource availability assumptions,<br />
we then modify the scenario by reducing the<br />
renewable energy cost assumptions to better<br />
reflect recent market projections.<br />
• The third scenario most closely resembles<br />
policies that the Washington State Legislature<br />
considered in the 2018 legislative session.<br />
This scenario provides a cost containment<br />
mechanism that allowed for the use of fossil<br />
fuels if the marginal abatement cost exceeds<br />
$200 per metric ton of carbon.<br />
1 Energy + Environmental Economics. Pacific Northwest Low Carbon Scenario Analysis: Achieving Least-Cost Carbon Emissions<br />
Reductions in the Electricity Sector. 8 November 2017. www.publicgeneratingpool.com/wp-content/uploads/2017/11/<br />
E3_NW_LowCarbonStudy_Full-Slide-Deck_2017-11-08.pdf<br />
2 Energy + Environmental Economics. Pacific Northwest Low Carbon Scenario Analysis: 2018 Scenarios and Sensitivities. June<br />
2018. www.ethree.com/wp-content/uploads/2018/06/Climate-Solutions_2018-Pacific-NW-Scenarios-and-Sensitivities_Final-Report.pdf<br />
climate solutions<br />
Within Reach: The Path to 100% Fossil-Free Electricity<br />
accelerating in the the Pacific transition to Northwest our clean energy future | Climate Solutions<br />
page 11
Research Assumptions<br />
This model makes a number of assumptions which are detailed in the technical support documents from<br />
the Pacific Northwest Low Carbon Scenario Analysis (see note 1 above). Here are the key assumptions that<br />
impact our present analysis:<br />
• This study focuses on a suite of 100% clean energy scenarios in the electricity sector in Washington<br />
and Oregon, referred to in this study as the “Core Northwest” region.<br />
• The “reference case” reflects current policies and industry trends, intended to serve as a point of<br />
comparison for alternative scenarios.<br />
• Load growth is partially offset by the acquisition of cost-effective energy efficiency, identified by the<br />
Northwest Power and Conservation Council, which reduces regional load growth from 1.3% per year to<br />
0.7% per year.<br />
• Total load growth from transportation electrification in this scenario is based on Northwest Power and<br />
Conservation Council’s medium electric vehicle trajectory, of which 60% is managed smart charging.<br />
• Existing coal plants, including plants that are geographically located outside of the region but serve<br />
utility loads <strong>within</strong> the region, remain in service through 2030 with the exception of announced<br />
retirements: Boardman, Centralia 1 & 2, and Colstrip 1 & 2. The Columbia Generating Station and the<br />
Lower Snake River Dams are assumed to be in operation beyond 2050.<br />
• Existing gas plants <strong>within</strong> the region remain in service through 2050, except gas plants that are<br />
expected to <strong>reach</strong> the end of their economic lives or have known retirement dates, and in the first<br />
scenario which does not allow for fossil or renewable natural gas generation.<br />
• Unless otherwise indicated, resource cost assumptions are consistent with PGP’s original study and<br />
based on E3’s 2016 analysis and recommended resource cost assumptions to Western Electricity<br />
Coordinating Council, which are higher than the cost of some current projects.*<br />
*Energy + Environmental Economics. Review of Capital Costs for Generation Technologies. January 2017. www.wecc.biz/<br />
Administrative/2017-01-31%20E3%20WECC%20Capital%20Costs%20v1.pdf<br />
Research Model Limitations<br />
The model has a number of limiting assumptions, listed below. As with many models, these limitations<br />
likely provide for more conservative results than expected when actually implemented, meaning that costs<br />
are likely conservative. We highlight key limitations that impact the scenarios, making the result more<br />
conservative:<br />
• The energy efficiency supply curve is limited to the Northwest Power and Conservation Council’s<br />
supply curve, which has consistently underestimated energy efficiency acquisition by more than 10%.<br />
• Demand response is limited to approximately 1,600 MW, restricted to an agricultural/industrial<br />
interruptible rate and space/water heating in residential settings based on available data.<br />
• The model balances over individual days, precluding the option for multi-day storage and not fully<br />
capturing the value of the hydro system.<br />
• The model does not model deeper market coordination across the West and does not allow for any<br />
non-claimed imports into the Core Northwest in 2050 due to how carbon is attributed to unspecified<br />
resources.<br />
• The model does not capture new technologies not yet on the market that may arise between now and<br />
2050.<br />
climate solutions<br />
Within Reach: The Path to 100% Fossil-Free Electricity<br />
accelerating in the the Pacific transition to Northwest our clean energy future | Climate Solutions<br />
page 12
20K MW<br />
59.4K MW<br />
24.2K MW<br />
212.4<br />
Millions of MWh<br />
(REFERENCE)<br />
10K MW<br />
0 MW<br />
REFERENCE<br />
GAS<br />
HYDRO<br />
UPGRADES<br />
WIND<br />
SOLAR<br />
OTHER<br />
RENEWABLES<br />
STORAGE<br />
INCREMENTAL<br />
ENERGY<br />
EFFICIENCY<br />
DEMAND<br />
RESPONSE<br />
395.3<br />
CURTAILMENT<br />
SOLAR<br />
WIND<br />
HYDRO<br />
incremental cost<br />
reference<br />
FOSSIL GAS<br />
$18.38B + $18.41B<br />
COAL<br />
new resource<br />
builds by 2050<br />
system<br />
$ costs<br />
$36.79B<br />
total system cost<br />
electricity<br />
generated<br />
Millions<br />
of MWh<br />
INCREMENTAL<br />
ENERGY EFFICIENCY<br />
NUCLEAR<br />
OTHER<br />
RENEWABLES<br />
SCENARIO 1<br />
100% reduction<br />
with hydro, wind,<br />
geothermal,<br />
solar (HWGS)<br />
Limiting new fossilfree<br />
generating<br />
resources to hydro,<br />
wind, solar, and<br />
geothermal to achieve<br />
100% fossil-free<br />
electricity results in<br />
high levels of costs<br />
and curtailment.<br />
The first scenario assumes a path to 100% clean electricity utilizing<br />
only hydro, wind, solar, and geothermal as the available new<br />
fossil-free generating resource options. The model places limits<br />
on demand response and self-curtailment capabilities, and restricts<br />
new dispatchable sources of generation that can be turned<br />
on and off to meet demand. Without dispatchable generation,<br />
this scenario significantly overbuilds resources to ensure there is<br />
sufficient capacity to meet peak demand. As shown in the figure,<br />
this scenario would add 84 GW of renewable energy and 10 GW<br />
of storage to the grid, compared to a business-as-usual reference<br />
case that adds 15 GW of new resources. The primary source of<br />
new energy would be wind, along with solar, battery storage,<br />
pumped hydro, and other resources.<br />
In this scenario, over one-third of the energy would be wasted<br />
(approximately 131 million MWhs) referred to in the chart as<br />
“curtailment.” 1 The total system costs of this scenario are estimated<br />
to be $36.8 billion, compared to a reference case total<br />
system cost of $18.4 billion. While the costs are likely a high<br />
estimate due to the model limitations, this scenario as modeled<br />
would nearly double the total system cost in 2050. Limiting the<br />
resources to hydro, wind, solar, and geothermal does not currently<br />
represent the most cost-effective pathway for achieving a<br />
100% fossil-free grid.<br />
1 Note that this scenario does not assume high electrification, power-to-gas,<br />
or other technologies that may make use of the excess energy available in<br />
this scenario.<br />
climate solutions<br />
Within Reach: The Path to 100% Fossil-Free Electricity<br />
accelerating in the the Pacific transition to Northwest our clean energy future | Climate Solutions<br />
Fossil Natural Gas vs.<br />
Renewable Natural Gas<br />
Natural gas consists mainly of<br />
methane, primarily used in the<br />
United States for electricity<br />
generation, heating, and industrial<br />
uses. While the majority of<br />
natural gas is derived from<br />
fossil fuels often fracked from<br />
deep underground, natural gas<br />
can also come from renewable<br />
sources. Renewable natural<br />
gas is methane sourced from<br />
organic raw materials instead of<br />
fossil fuels, and often involves<br />
capturing methane that would<br />
otherwise have been released<br />
into the atmosphere. Common<br />
sources of renewable natural gas<br />
include wastewater treatment<br />
facilities, local landfills, manure,<br />
and decomposing plant material.<br />
Renewable natural gas can be used<br />
in existing gas plants to provide a<br />
source of fossil-free generation<br />
that can be turned on and off as<br />
needed.<br />
page 13
20K MW<br />
212.4<br />
Millions of MWh<br />
(REFERENCE)<br />
10K MW<br />
0 MW<br />
REFERENCE<br />
GAS<br />
235.5<br />
CURTAILMENT<br />
SOLAR<br />
WIND<br />
incremental cost<br />
reference<br />
HYDRO<br />
FOSSIL GAS<br />
$3.26B + $18.41B<br />
HYDRO<br />
UPGRADES<br />
new resource<br />
builds by 2050<br />
system<br />
$ costs<br />
WIND<br />
SOLAR<br />
OTHER<br />
RENEWABLES<br />
STORAGE<br />
INCREMENTAL<br />
ENERGY<br />
EFFICIENCY<br />
DEMAND<br />
RESPONSE<br />
$21.67B<br />
total system cost<br />
electricity<br />
generated<br />
Millions<br />
of MWh<br />
INCREMENTAL<br />
ENERGY EFFICIENCY<br />
COAL<br />
NUCLEAR<br />
OTHER<br />
RENEWABLES<br />
SCENARIO 2<br />
100% reduction<br />
with HWGS +<br />
biogas<br />
The addition of<br />
renewable natural gas<br />
as a resource option<br />
for achieving 100%<br />
fossil-free electricity<br />
significantly reduces<br />
curtailment and cuts<br />
costs by over 80%.<br />
The second scenario makes one change from the first scenario: it adds renewable natural gas as an<br />
available fossil-free generating resource, along with hydro, wind, geothermal, and solar. Renewable<br />
natural gas is modeled at $31 per MMbtu, based on U.S. Department of Energy’s 2016 Billion-Ton<br />
Report identifying market potential supply curves under scenarios with and without purpose-grown<br />
crops. 1 This scenario results in using approximately 41.3 Tbtu of renewable natural gas, which is<br />
about one third of Washington and Oregon’s projected in-state market supply without relying on purpose-grown<br />
crops.<br />
The addition of renewable natural gas as a resource option significantly reduces the need to overbuild<br />
resources in order to meet peak demand, resulting in 21 GW of new renewable resource builds,<br />
compared to 84 GW in the first scenario. The amount of wasted energy would be reduced by 90%,<br />
and the total energy that is produced in order to balance the grid would fall from approximately 394<br />
million MWhs to approximately 236 million MWhs. While this scenario projects new investments in<br />
gas infrastructure, gas plants would burn renewable natural gas in 2050. The incremental cost of this<br />
scenario falls by 83%, to a total system cost of $21.6 billion compared to a reference of $18.4 billion.<br />
Spread across all generation in Washington and Oregon, this incremental cost correlates to approximately<br />
$0.016/kWh.<br />
climate solutions<br />
Within Reach: The Path to 100% Fossil-Free Electricity<br />
accelerating in the the Pacific transition to Northwest our clean energy future | Climate Solutions<br />
page 14
20K MW<br />
212.4<br />
Millions of MWh<br />
(REFERENCE)<br />
10K MW<br />
0 MW<br />
REFERENCE<br />
GAS<br />
HYDRO<br />
UPGRADES<br />
WIND<br />
SOLAR<br />
new resource<br />
builds by 2050<br />
OTHER<br />
RENEWABLES<br />
STORAGE<br />
INCREMENTAL<br />
ENERGY<br />
EFFICIENCY<br />
DEMAND<br />
RESPONSE<br />
241.3<br />
CURTAILMENT<br />
Millions<br />
of MWh<br />
INCREMENTAL<br />
ENERGY EFFICIENCY<br />
SOLAR<br />
WIND<br />
incremental cost<br />
system<br />
$ costs<br />
reference<br />
$1.32B + $18.41B<br />
$19.73B<br />
total system cost<br />
HYDRO<br />
FOSSIL GAS<br />
COAL<br />
NUCLEAR<br />
OTHER<br />
RENEWABLES<br />
electricity<br />
generated<br />
SCENARIO 2B<br />
100% reduction<br />
with HWGS,<br />
biogas + updated<br />
renewable costs<br />
Reductions in<br />
renewable energy<br />
costs make achieving<br />
100% fossil-free<br />
electricity even<br />
more affordable<br />
and avoids new gas<br />
infrastructure.<br />
In this modified scenario, renewable resource<br />
cost assumptions are reduced to better reflect<br />
today’s market and recent trends in renewable<br />
energy technology costs. Solar costs are updated<br />
using the NREL’s 2017 Annual Technology<br />
Baseline; 1 wind capital costs are reduced by 20%,<br />
consistent with integrated resource plans in the<br />
Pacific Northwest; 2 battery storage costs are updated<br />
using Lazard’s Levelized Cost of Storage 3.0; 3<br />
and the cost of renewable natural gas is reduced<br />
by 20% to reflect a lower cost projection.<br />
By reducing renewable energy costs, the model<br />
no longer projects new investments in gas plants<br />
in the Northwest, and instead relies on 28 GW of<br />
new investments in renewable energy resources<br />
and 7 GW of new storage resources to provide<br />
energy, capacity, and balancing services. The use<br />
of renewable natural gas would decline to 32.5<br />
Tbtu, which is just over a quarter of the projected<br />
in-state capacity without purpose-grown<br />
crops.<br />
The costs of achieving a fossil-free grid would<br />
drop even further to a system cost of $19.7<br />
billion, compared to the reference $18.4 billion.<br />
Spread across all the electricity consumed in<br />
Washington and Oregon, this translates into a<br />
cost of around a $0.006/kwh, making this scenario<br />
the most cost-effective pathway modeled<br />
in this study. 4<br />
1 National Renewable Energy Laboratory. 2017 Annual Technology Baseline. https://atb.nrel.gov/electricity/2017/<br />
2 Puget Sound Energy. “2017 PSE Integrated Resource Plan, Appendix M: Wind and Solar Costs.” https://pse.com/aboutpse/EnergySupply/Documents/IRP17_AppM.pdf<br />
3 Lazard. Lazard’s Levelized Cost of Storage Analysis - Version 3.0. 2017. https://www.lazard.com/media/450338/lazard-levelized-cost-of-storage-version-30.pdf<br />
4 With lower battery cost projections, the model relies more heavily on storage as a capacity resource and additional<br />
study may be needed to ensure reliability in this scenario.<br />
climate solutions<br />
Within Reach: The Path to 100% Fossil-Free Electricity<br />
accelerating in the the Pacific transition to Northwest our clean energy future | Climate Solutions<br />
page 15
20K MW<br />
212.4<br />
Millions of MWh<br />
(REFERENCE)<br />
10K MW<br />
0 MW<br />
REFERENCE<br />
GAS<br />
218.3<br />
CURTAILMENT<br />
SOLAR<br />
WIND<br />
HYDRO<br />
incremental cost<br />
reference<br />
FOSSIL GAS<br />
$1.15B + $18.41B<br />
COAL<br />
HYDRO<br />
UPGRADES<br />
new resource<br />
builds by 2050<br />
system<br />
$ costs<br />
WIND<br />
SOLAR<br />
OTHER<br />
RENEWABLES<br />
STORAGE<br />
INCREMENTAL<br />
ENERGY<br />
EFFICIENCY<br />
DEMAND<br />
RESPONSE<br />
$19.56B<br />
total system cost<br />
electricity<br />
generated<br />
Millions<br />
of MWh<br />
INCREMENTAL<br />
ENERGY EFFICIENCY<br />
NUCLEAR<br />
OTHER<br />
RENEWABLES<br />
SCENARIO 3<br />
100% reduction<br />
+ policy<br />
flexibility<br />
Policy flexibility<br />
preserves a pathway<br />
to 100% fossil-free<br />
electricity, while<br />
containing costs and<br />
providing flexibility<br />
for technology<br />
advancement.<br />
The final scenario in this study most closely resembles<br />
100% fossil-free policies that the Washington<br />
State Legislature considered in the 2018<br />
legislative session. This scenario puts utilities<br />
on the pathway to eliminating fossil fuels from<br />
the grid by 2050, but provides a cost-containment<br />
mechanism of $200 per ton of carbon. If<br />
the marginal abatement cost of reducing carbon<br />
exceeds $200/ton, the model dispatches fossil<br />
fuels instead of selecting a bundle of fossil-free<br />
resources with similar characteristics.<br />
This mechanism ensures a minimum level of<br />
greenhouse gas reductions, but allows the<br />
flexibility for technological advancement that<br />
would further reduce emissions. Even using<br />
higher clean energy cost assumptions, the 100%<br />
scenario with policy flexibility would result in an<br />
83% reduction below 1990 levels in the electric<br />
sector, at a cost of approximately a half cent per<br />
kWh ($0.005/kwh) if spread across the entire<br />
load of Washington and Oregon. Adding flexibility<br />
in this scenario preserves a path for achieving<br />
a full 100% reduction of carbon emissions by<br />
2050, assuming costs continue to decline at<br />
rates similar to the past decade.<br />
climate solutions<br />
Within Reach: The Path to 100% Fossil-Free Electricity<br />
accelerating in the the Pacific transition to Northwest our clean energy future | Climate Solutions<br />
page 16
Summary and Conclusion<br />
While the U.S. has made gains in transitioning<br />
away from coal, our economy is still heavily<br />
dependent on fossil fuels. Despite the public’s<br />
strong desire to transition to fossil-free energy,<br />
Washington utilities are currently planning to<br />
invest heavily in new gas plants over the next<br />
two decades. New gas plants are likely to remain<br />
in service for an average life of over 30 years. If<br />
fueled by fossil gas, this level of investment could<br />
lock Washington in to a greater reliance on fossil<br />
fuels, preventing the state from doing its part to<br />
achieve the greenhouse gas emissions reductions<br />
needed to prevent irreversible damage from<br />
climate change.<br />
Studies have consistently demonstrated that in<br />
order to achieve 80% greenhouse gas emissions<br />
reductions, the electric sector must be nearly<br />
100% fossil-free. E3’s new research demonstrates<br />
that by building on our base of hydropower,<br />
we can achieve a 100% fossil-free grid with<br />
minimal impact on electricity bills in the Pacific<br />
Northwest. Continuing to rely on fossil fuels<br />
poses risks for customers, but declining renewable<br />
energy costs, a range of options for new<br />
fossil-free generation, and policy flexibility will<br />
ensure that customers are protected from risky<br />
investments that rely on fossil fuels. We can,<br />
and should, put utilities on a pathway to 100%<br />
fossil-free electricity now, and avoid investments<br />
in resources that don’t align with emissions<br />
reductions goals. That will allow us to create<br />
new demand for technological innovation in the<br />
Northwest, to invest in our local communities,<br />
and to protect our climate and clean air.<br />
climate solutions<br />
Within Reach: The Path to 100% Fossil-Free Electricity<br />
accelerating in the the Pacific transition to Northwest our clean energy future | Climate Solutions<br />
page 17