
Create successful ePaper yourself
Turn your PDF publications into a flip-book with our unique Google optimized e-Paper software.
180<br />
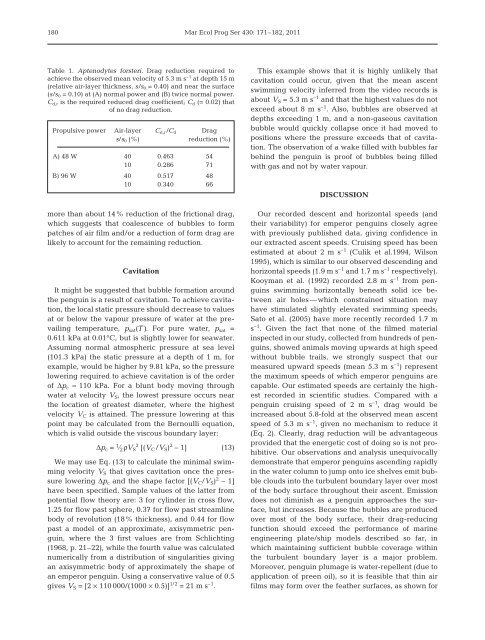
Table 1. Aptenodytes forsteri. Drag reduction required to<br />
achieve the observed mean velocity of 5.3 m s –1 at depth 15 m<br />
(relative air-layer thickness, s/s 0 = 0.40) and near the surface<br />
(s/s 0 = 0.10) at (A) normal power and (B) twice normal power.<br />
C d,r is the required reduced drag coefficient; C d (= 0.02) that<br />
of no drag reduction.<br />
Propulsive power Air-layer C d,r/C d Drag<br />
s/s 0 (%) reduction (%)<br />
A) 48 W 40 0.463 54<br />
10 0.286 71<br />
B) 96 W 40 0.517 48<br />
10 0.340 66<br />
more than about 14% reduction of the frictional drag,<br />
which suggests that coalescence of bubbles to form<br />
patches of air film and/or a reduction of form drag are<br />
likely to account for the remaining reduction.<br />
Cavitation<br />
It might be suggested that bubble formation around<br />
the penguin is a result of cavitation. To achieve cavitation,<br />
the local static pressure should decrease to values<br />
at or below the vapour pressure of water at the pre -<br />
vailing temperature, p sat(T). For pure water, p sat =<br />
0.611 kPa at 0.01°C, but is slightly lower for seawater.<br />
Assuming normal atmospheric pressure at sea level<br />
(101.3 kPa) the static pressure at a depth of 1 m, for<br />
example, would be higher by 9.81 kPa, so the pressure<br />
lowering required to achieve cavitation is of the order<br />
of Δp c ≈ 110 kPa. For a blunt body moving through<br />
water at velocity V S, the lowest pressure occurs near<br />
the location of greatest diameter, where the highest<br />
velocity V C is attained. The pressure lowering at this<br />
point may be calculated from the Bernoulli equation,<br />
which is valid outside the viscous boundary layer:<br />
Δp c = 1 ⁄ 2ρV S 2 [(VC/V S) 2 – 1] (13)<br />
We may use Eq. (13) to calculate the minimal swimming<br />
velocity V S that gives cavitation once the pressure<br />
lowering Δp c and the shape factor [(V C/V S) 2 – 1]<br />
have been specified. Sample values of the latter from<br />
potential flow theory are: 3 for cylinder in cross flow,<br />
1.25 for flow past sphere, 0.37 for flow past streamline<br />
body of revolution (18% thickness), and 0.44 for flow<br />
past a model of an approximate, axisymmetric penguin,<br />
where the 3 first values are from Schlichting<br />
(1968, p. 21–22), while the fourth value was calculated<br />
nu merically from a distribution of singularities giving<br />
an axisymmetric body of approximately the shape of<br />
an emperor penguin. Using a conservative value of 0.5<br />
gives V S = [2 × 110 000/(1000 × 0.5)] 1/2 = 21 m s –1 .<br />
Mar Ecol Prog Ser 430: 171–182, 2011<br />
This example shows that it is highly unlikely that<br />
cavitation could occur, given that the mean ascent<br />
swimming velocity inferred from the video records is<br />
about V S = 5.3 m s –1 and that the highest values do not<br />
exceed about 8 m s –1 . Also, bubbles are observed at<br />
depths exceeding 1 m, and a non-gaseous cavitation<br />
bubble would quickly collapse once it had moved to<br />
positions where the pressure exceeds that of cavitation.<br />
The observation of a wake filled with bubbles far<br />
behind the penguin is proof of bubbles being filled<br />
with gas and not by water vapour.<br />
DISCUSSION<br />
Our recorded descent and horizontal speeds (and<br />
their variability) for emperor penguins closely agree<br />
with previously published data, giving confidence in<br />
our extracted ascent speeds. Cruising speed has been<br />
estimated at about 2 m s –1 (Culik et al.1994, Wilson<br />
1995), which is similar to our observed descending and<br />
horizontal speeds (1.9 m s –1 and 1.7 m s –1 respectively).<br />
Kooyman et al. (1992) recorded 2.8 m s –1 from penguins<br />
swimming horizontally beneath solid ice be -<br />
tween air holes—which constrained situation may<br />
have stimulated slightly elevated swimming speeds;<br />
Sato et al. (2005) have more recently recorded 1.7 m<br />
s –1 . Given the fact that none of the filmed material<br />
inspected in our study, collected from hundreds of penguins,<br />
showed animals moving upwards at high speed<br />
without bubble trails, we strongly suspect that our<br />
measured upward speeds (mean 5.3 m s –1 ) represent<br />
the maximum speeds of which emperor penguins are<br />
capable. Our estimated speeds are certainly the highest<br />
recorded in scientific studies. Compared with a<br />
penguin cruising speed of 2 m s –1 , drag would be<br />
increased about 5.8-fold at the observed mean ascent<br />
speed of 5.3 m s –1 , given no mechanism to reduce it<br />
(Eq. 2). Clearly, drag reduction will be advantageous<br />
provided that the energetic cost of doing so is not prohibitive.<br />
Our observations and analysis unequivocally<br />
demonstrate that emperor penguins ascending rapidly<br />
in the water column to jump onto ice shelves emit bubble<br />
clouds into the turbulent boundary layer over most<br />
of the body surface throughout their ascent. Emission<br />
does not diminish as a penguin approaches the surface,<br />
but in creases. Because the bubbles are produced<br />
over most of the body surface, their drag-reducing<br />
function should exceed the performance of marine<br />
engineering plate/ship models described so far, in<br />
which maintaining sufficient bubble coverage within<br />
the turbulent boundary layer is a major problem.<br />
Moreover, penguin plumage is water-repellent (due to<br />
application of preen oil), so it is feasible that thin air<br />
films may form over the feather surfaces, as shown for