Extreme winter precipitation in the Iberian Peninsula in 2010 ...
Extreme winter precipitation in the Iberian Peninsula in 2010 ...
Extreme winter precipitation in the Iberian Peninsula in 2010 ...

You also want an ePaper? Increase the reach of your titles
YUMPU automatically turns print PDFs into web optimized ePapers that Google loves.
Vol. 46: 51–65, 2011<br />
doi: 10.3354/cr00977<br />
CLIMATE RESEARCH<br />
Clim Res<br />
Published onl<strong>in</strong>e February 8<br />
OPEN<br />
ACCESS<br />
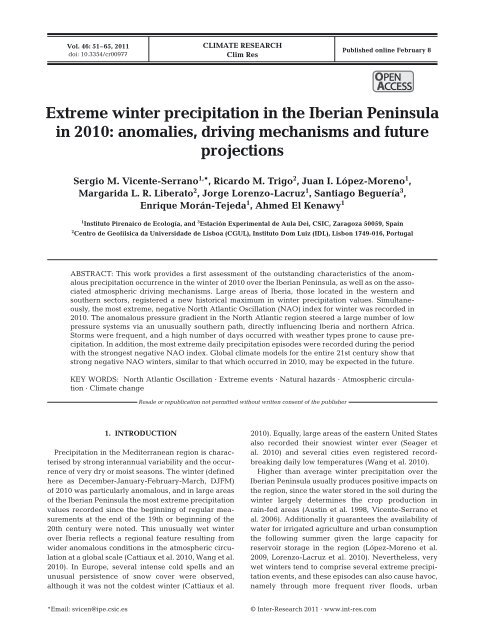
<strong>Extreme</strong> <strong>w<strong>in</strong>ter</strong> <strong>precipitation</strong> <strong>in</strong> <strong>the</strong> <strong>Iberian</strong> Pen<strong>in</strong>sula<br />
<strong>in</strong> <strong>2010</strong>: anomalies, driv<strong>in</strong>g mechanisms and future<br />
projections<br />
Sergio M. Vicente-Serrano 1, *, Ricardo M. Trigo 2 , Juan I. López-Moreno 1 ,<br />
Margarida L. R. Liberato 2 , Jorge Lorenzo-Lacruz 1 , Santiago Beguería 3 ,<br />
Enrique Morán-Tejeda 1 , Ahmed El Kenawy 1<br />
1 Instituto Pirenaico de Ecología, and 3 Estación Experimental de Aula Dei, CSIC, Zaragoza 50059, Spa<strong>in</strong><br />
2 Centro de Geofíisica da Universidade de Lisboa (CGUL), Instituto Dom Luiz (IDL), Lisbon 1749-016, Portugal<br />
ABSTRACT: This work provides a first assessment of <strong>the</strong> outstand<strong>in</strong>g characteristics of <strong>the</strong> anomalous<br />
<strong>precipitation</strong> occurrence <strong>in</strong> <strong>the</strong> <strong>w<strong>in</strong>ter</strong> of <strong>2010</strong> over <strong>the</strong> <strong>Iberian</strong> Pen<strong>in</strong>sula, as well as on <strong>the</strong> associated<br />
atmospheric driv<strong>in</strong>g mechanisms. Large areas of Iberia, those located <strong>in</strong> <strong>the</strong> western and<br />
sou<strong>the</strong>rn sectors, registered a new historical maximum <strong>in</strong> <strong>w<strong>in</strong>ter</strong> <strong>precipitation</strong> values. Simultaneously,<br />
<strong>the</strong> most extreme, negative North Atlantic Oscillation (NAO) <strong>in</strong>dex for <strong>w<strong>in</strong>ter</strong> was recorded <strong>in</strong><br />
<strong>2010</strong>. The anomalous pressure gradient <strong>in</strong> <strong>the</strong> North Atlantic region steered a large number of low<br />
pressure systems via an unusually sou<strong>the</strong>rn path, directly <strong>in</strong>fluenc<strong>in</strong>g Iberia and nor<strong>the</strong>rn Africa.<br />
Storms were frequent, and a high number of days occurred with wea<strong>the</strong>r types prone to cause <strong>precipitation</strong>.<br />
In addition, <strong>the</strong> most extreme daily <strong>precipitation</strong> episodes were recorded dur<strong>in</strong>g <strong>the</strong> period<br />
with <strong>the</strong> strongest negative NAO <strong>in</strong>dex. Global climate models for <strong>the</strong> entire 21st century show that<br />
strong negative NAO <strong>w<strong>in</strong>ter</strong>s, similar to that which occurred <strong>in</strong> <strong>2010</strong>, may be expected <strong>in</strong> <strong>the</strong> future.<br />
KEY WORDS: North Atlantic Oscillation · <strong>Extreme</strong> events · Natural hazards · Atmospheric circulation<br />
· Climate change<br />
Resale or republication not permitted without written consent of <strong>the</strong> publisher<br />
1. INTRODUCTION<br />
Precipitation <strong>in</strong> <strong>the</strong> Mediterranean region is characterised<br />
by strong <strong>in</strong>terannual variability and <strong>the</strong> occurrence<br />
of very dry or moist seasons. The <strong>w<strong>in</strong>ter</strong> (def<strong>in</strong>ed<br />
here as December-January-February-March, DJFM)<br />
of <strong>2010</strong> was particularly anomalous, and <strong>in</strong> large areas<br />
of <strong>the</strong> <strong>Iberian</strong> Pen<strong>in</strong>sula <strong>the</strong> most extreme <strong>precipitation</strong><br />
values recorded s<strong>in</strong>ce <strong>the</strong> beg<strong>in</strong>n<strong>in</strong>g of regular measurements<br />
at <strong>the</strong> end of <strong>the</strong> 19th or beg<strong>in</strong>n<strong>in</strong>g of <strong>the</strong><br />
20th century were noted. This unusually wet <strong>w<strong>in</strong>ter</strong><br />
over Iberia reflects a regional feature result<strong>in</strong>g from<br />
wider anomalous conditions <strong>in</strong> <strong>the</strong> atmospheric circulation<br />
at a global scale (Cattiaux et al. <strong>2010</strong>, Wang et al.<br />
<strong>2010</strong>). In Europe, several <strong>in</strong>tense cold spells and an<br />
unusual persistence of snow cover were observed,<br />
although it was not <strong>the</strong> coldest <strong>w<strong>in</strong>ter</strong> (Cattiaux et al.<br />
<strong>2010</strong>). Equally, large areas of <strong>the</strong> eastern United States<br />
also recorded <strong>the</strong>ir snowiest <strong>w<strong>in</strong>ter</strong> ever (Seager et<br />
al. <strong>2010</strong>) and several cities even registered recordbreak<strong>in</strong>g<br />
daily low temperatures (Wang et al. <strong>2010</strong>).<br />
Higher than average <strong>w<strong>in</strong>ter</strong> <strong>precipitation</strong> over <strong>the</strong><br />
<strong>Iberian</strong> Pen<strong>in</strong>sula usually produces positive impacts on<br />
<strong>the</strong> region, s<strong>in</strong>ce <strong>the</strong> water stored <strong>in</strong> <strong>the</strong> soil dur<strong>in</strong>g <strong>the</strong><br />
<strong>w<strong>in</strong>ter</strong> largely determ<strong>in</strong>es <strong>the</strong> crop production <strong>in</strong><br />
ra<strong>in</strong>-fed areas (Aust<strong>in</strong> et al. 1998, Vicente-Serrano et<br />
al. 2006). Additionally it guarantees <strong>the</strong> availability of<br />
water for irrigated agriculture and urban consumption<br />
<strong>the</strong> follow<strong>in</strong>g summer given <strong>the</strong> large capacity for<br />
reservoir storage <strong>in</strong> <strong>the</strong> region (López-Moreno et al.<br />
2009, Lorenzo-Lacruz et al. <strong>2010</strong>). Never<strong>the</strong>less, very<br />
wet <strong>w<strong>in</strong>ter</strong>s tend to comprise several extreme <strong>precipitation</strong><br />
events, and <strong>the</strong>se episodes can also cause havoc,<br />
namely through more frequent river floods, urban<br />
*Email: svicen@ipe.csic.es<br />
© Inter-Research 2011 · www.<strong>in</strong>t-res.com
52<br />
Clim Res 46: 51–65, 2011<br />
<strong>in</strong>undations and o<strong>the</strong>r natural hazards, such as landslides<br />
(e.g. Zezere et al. 2008). Dur<strong>in</strong>g <strong>the</strong> <strong>w<strong>in</strong>ter</strong> <strong>2010</strong>,<br />
large areas of <strong>the</strong> <strong>Iberian</strong> Pen<strong>in</strong>sula, particularly those<br />
located <strong>in</strong> <strong>the</strong> south and southwest, were affected by<br />
floods, result<strong>in</strong>g <strong>in</strong> severe socio-economic effects <strong>in</strong><br />
many agricultural areas, affect<strong>in</strong>g road traffic, build<strong>in</strong>gs<br />
and <strong>in</strong>frastructures, and caus<strong>in</strong>g <strong>the</strong> collapse of<br />
houses, as well as 9 deaths <strong>in</strong> sou<strong>the</strong>rn Spa<strong>in</strong> (an area<br />
particularly affected by extreme <strong>precipitation</strong> events).<br />
Besides <strong>the</strong>se unfortunate casualties, sou<strong>the</strong>rn Iberia<br />
also registered overflows of several rivers and road<br />
and railway blockages, as well as <strong>the</strong> need to evacuate<br />
humans from several areas and provide hous<strong>in</strong>g for<br />
ca. 1000 persons affected by flood<strong>in</strong>g (www.mma.es/<br />
secciones/acm/aguas_cont<strong>in</strong>ent_zonas_asoc/ons/mapa_<br />
<strong>in</strong>forme_ons/pdf/<strong>in</strong>f_ejecutivo_<strong>in</strong>undaciones100317_1.<br />
pdf). Moreover, several localities <strong>in</strong> <strong>the</strong> bas<strong>in</strong> of<br />
Guadalquivir were affected by closed roads and lack of<br />
transportation. Insurance companies have had to pay<br />
130 M€ to farmers as a consequence of crop damages,<br />
but agricultural associations have estimated that <strong>in</strong><br />
sou<strong>the</strong>rn Spa<strong>in</strong> alone <strong>the</strong> crop damages actually<br />
amount to 807 M€, and <strong>the</strong> damages <strong>in</strong> <strong>in</strong>frastructure<br />
(greenhouses, tracks, etc.) amount to ano<strong>the</strong>r 72 M€.<br />
Reservoir water storage <strong>in</strong> <strong>the</strong> Guadalquivir bas<strong>in</strong> is an<br />
example of positive effects of <strong>the</strong> wet <strong>w<strong>in</strong>ter</strong>. The average<br />
water stored <strong>in</strong> <strong>the</strong> previous 10 yr (2000–2009) was<br />
4.6 × 10 9 m 3 , whereas, at <strong>the</strong> end of <strong>the</strong> <strong>w<strong>in</strong>ter</strong> <strong>2010</strong>, it<br />
was 7.25 × 10 9 m 3 . Similar numbers are found for o<strong>the</strong>r<br />
relevant sou<strong>the</strong>rn <strong>Iberian</strong> bas<strong>in</strong>s, such as <strong>the</strong> Guadiana<br />
(5.95 vs. 8.0 × 10 9 m 3 ) or <strong>the</strong> Segura (0.28 vs. 0.79 ×<br />
10 9 m 3 ). This large <strong>in</strong>crement <strong>in</strong> water stored <strong>in</strong> large<br />
dams expla<strong>in</strong>s <strong>the</strong> very high hydropower production<br />
<strong>in</strong> Spa<strong>in</strong> dur<strong>in</strong>g <strong>the</strong> <strong>w<strong>in</strong>ter</strong> <strong>2010</strong> (17.1 million MW h),<br />
whereas <strong>the</strong> average over <strong>the</strong> last 10 <strong>w<strong>in</strong>ter</strong>s was<br />
11.5 million MW h.<br />
The most important mechanism responsible for <strong>the</strong><br />
strong <strong>in</strong>terannual <strong>precipitation</strong> variability observed<br />
<strong>in</strong> <strong>the</strong> western Mediterranean region is <strong>the</strong> North<br />
Atlantic Oscillation (NAO) (e.g. Rodríguez-Puebla et<br />
al. 1998, Trigo et al. 2002), particularly dur<strong>in</strong>g <strong>the</strong><br />
<strong>w<strong>in</strong>ter</strong> months, <strong>in</strong> which this pattern is more active<br />
(Hurrell et al. 2003). It is widely known that <strong>the</strong> negative<br />
phases of <strong>the</strong> NAO <strong>in</strong>duce above-normal <strong>precipitation</strong><br />
<strong>in</strong> sou<strong>the</strong>rn Europe, particularly over <strong>the</strong> west<br />
and southwest sectors of <strong>the</strong> <strong>Iberian</strong> Pen<strong>in</strong>sula (Hurrell<br />
& Van Loon 1997, Trigo et al. 2002), areas which<br />
are subject to <strong>the</strong> <strong>in</strong>fluence of Atlantic low pressure<br />
systems.<br />
The NAO shows large <strong>in</strong>terannual variabilities (Hurrell<br />
1995), and <strong>in</strong> <strong>the</strong> <strong>w<strong>in</strong>ter</strong> of <strong>2010</strong> <strong>the</strong> most extreme,<br />
negative NAO <strong>in</strong>dex was recorded s<strong>in</strong>ce <strong>the</strong> availability<br />
of data (i.e. s<strong>in</strong>ce 1823 for <strong>the</strong> NAO <strong>in</strong>dex, based<br />
on <strong>the</strong> Gibraltar–Iceland def<strong>in</strong>ition; Jones et al. 1997).<br />
It has been shown that <strong>the</strong> extremely cold <strong>w<strong>in</strong>ter</strong> <strong>in</strong><br />
many areas of <strong>the</strong> Nor<strong>the</strong>rn Hemisphere (<strong>in</strong>clud<strong>in</strong>g <strong>the</strong><br />
USA, Europe and Ch<strong>in</strong>a) (Seager et al. <strong>2010</strong>, see<br />
www.knmi.nl/cms/content/79165) was associated with<br />
record-break<strong>in</strong>g negative values of <strong>the</strong> Arctic Oscillation<br />
(AO) <strong>in</strong>dex, particularly for December 2009 (Wang<br />
et al. <strong>2010</strong>). This is relevant because some authors<br />
regard <strong>the</strong> NAO mode merely as <strong>the</strong> regional pattern<br />
of <strong>the</strong> more symmetric AO mode (Baldw<strong>in</strong> & Dunkerton<br />
1999, Wallace 2000). The physical mechanisms that<br />
caused <strong>the</strong> extreme AO/NAO <strong>in</strong>dices <strong>in</strong> <strong>2010</strong> have not<br />
yet been analysed <strong>in</strong> depth. However, recent studies<br />
have shown that <strong>the</strong> strong phase of <strong>the</strong> El Niño–<br />
Sou<strong>the</strong>rn Oscillation (ENSO) may have played a relevant<br />
role <strong>in</strong> caus<strong>in</strong>g <strong>the</strong> surface climate anomalies <strong>in</strong><br />
<strong>the</strong> Nor<strong>the</strong>rn Hemisphere, s<strong>in</strong>ce <strong>the</strong> El Niño episode<br />
was <strong>the</strong> strongest s<strong>in</strong>ce <strong>the</strong> 1997-1998 <strong>w<strong>in</strong>ter</strong> season<br />
and <strong>the</strong> fifth strongest s<strong>in</strong>ce 1950 (www.ncdc.noaa.<br />
gov/special-reports/2009-<strong>2010</strong>-cold-season.html). Propagation<br />
of <strong>the</strong> ENSO <strong>in</strong>fluences across <strong>the</strong> Nor<strong>the</strong>rn<br />
Hemisphere and <strong>the</strong> North Atlantic region is now<br />
relatively well established (e.g. Trenberth & Guillemot<br />
1996, Brönnimann 2007). Brönnimann et al. (2004)<br />
demonstrated, by means of dynamic models, that <strong>the</strong><br />
very extreme <strong>w<strong>in</strong>ter</strong>s between 1940 and 1942 <strong>in</strong> Europe<br />
were determ<strong>in</strong>ed by a propagation of ENSO effects<br />
from <strong>the</strong> troposphere to stratosphere, affect<strong>in</strong>g <strong>the</strong> AO<br />
phase. This could expla<strong>in</strong> why <strong>the</strong> AO was very negative<br />
from June 2009 onwards and <strong>the</strong> <strong>w<strong>in</strong>ter</strong> was characterised<br />
by a sou<strong>the</strong>rn displacement <strong>in</strong> <strong>the</strong> position of<br />
<strong>the</strong> mid-latitude jet stream (L’Heureux et al. <strong>2010</strong>).<br />
In <strong>the</strong> present study, we analyse <strong>the</strong> <strong>in</strong>fluence of this<br />
extreme episode of atmospheric circulation on <strong>the</strong> spatial<br />
and temporal anomalies of <strong>precipitation</strong> over <strong>the</strong><br />
<strong>Iberian</strong> Pen<strong>in</strong>sula, show<strong>in</strong>g <strong>the</strong> driv<strong>in</strong>g atmospheric<br />
mechanisms that expla<strong>in</strong> <strong>the</strong> anomalous <strong>precipitation</strong><br />
conditions and determ<strong>in</strong><strong>in</strong>g, with<strong>in</strong> <strong>the</strong> current stateof-<strong>the</strong>-art,<br />
how such anomalous conditions may be<br />
repeated <strong>in</strong> <strong>the</strong> future accord<strong>in</strong>g to global climate<br />
model (GCM) projections.<br />
2. DATA AND METHODS<br />
2.1. Data sets<br />
The study drew data from 6 different data sets.<br />
(1) The monthly <strong>precipitation</strong> records of 45 <strong>precipitation</strong><br />
observatories from January 1910 to March <strong>2010</strong><br />
were used. The series were carefully homogenized<br />
and quality controlled (Vicente-Serrano 2005). They<br />
were distributed homogenously across <strong>the</strong> <strong>Iberian</strong> Pen<strong>in</strong>sula<br />
(see Fig. 2), cover<strong>in</strong>g all <strong>precipitation</strong> regimes<br />
found <strong>in</strong> <strong>the</strong> region. The daily <strong>precipitation</strong> series for<br />
38 of <strong>the</strong> same stations for <strong>the</strong> period 1965–<strong>2010</strong> were<br />
also available.
Vicente-Serrano et al.: <strong>Extreme</strong> <strong>precipitation</strong> <strong>in</strong> Iberia<br />
53<br />
(2) A station-based monthly NAO <strong>in</strong>dex was used.<br />
The series was obta<strong>in</strong>ed from <strong>the</strong> Climate Research<br />
Unit of <strong>the</strong> University of East Anglia (www.cru.uea.<br />
ac.uk/cru/data/nao/) and was calculated from <strong>the</strong> difference<br />
between <strong>the</strong> normalized pressures <strong>in</strong> Reykjavik<br />
(Iceland) and Gibraltar (sou<strong>the</strong>rn <strong>Iberian</strong> Pen<strong>in</strong>sula)<br />
(Jones et al. 1997). The series covered <strong>the</strong> period<br />
spann<strong>in</strong>g between 1823 and March <strong>2010</strong>.<br />
(3) Monthly values of gridded Nor<strong>the</strong>rn Hemisphere<br />
sea-level pressure (SLP) were extracted from <strong>the</strong><br />
National Center for Atmospheric Research (http://dss.<br />
ucar.edu/datasets/ds010.1/) (Trenberth & Paol<strong>in</strong>o<br />
1980) for <strong>the</strong> period 1899–<strong>2010</strong>, <strong>in</strong> order to derive <strong>the</strong><br />
spatial pattern of SLP anomalies <strong>in</strong> <strong>the</strong> <strong>w<strong>in</strong>ter</strong> <strong>2010</strong>.<br />
From this dataset, we also used a daily SLP series for<br />
<strong>the</strong> grid po<strong>in</strong>t nearest to Reykiavik (65° N; 20° W) and<br />
Gibraltar (35° N; 5° W) (http://dss.ucar.edu/datasets/<br />
ds010.0/) to obta<strong>in</strong> a daily NAO <strong>in</strong>dex for <strong>the</strong> <strong>w<strong>in</strong>ter</strong><br />
<strong>2010</strong>, follow<strong>in</strong>g <strong>the</strong> same approach used by Jones et al.<br />
(1997). Moreover, <strong>the</strong> series of daily SLPs for 16 po<strong>in</strong>ts<br />
on <strong>the</strong> <strong>Iberian</strong> Pen<strong>in</strong>sula and <strong>in</strong> <strong>the</strong> neighbour<strong>in</strong>g areas<br />
(see López-Moreno & Vicente-Serrano 2007) were also<br />
based on <strong>the</strong> same dataset used to classify daily<br />
wea<strong>the</strong>r types dur<strong>in</strong>g <strong>the</strong> period 1899–<strong>2010</strong>, follow<strong>in</strong>g<br />
<strong>the</strong> approach of Jenk<strong>in</strong>son & Collison (1977).<br />
(4) The monthly averages of U and V components (m<br />
s–1) for w<strong>in</strong>ds at <strong>the</strong> surface (10 m) and at 250 hPa<br />
levels were obta<strong>in</strong>ed from <strong>the</strong> NCEP/NCAR reanalysis<br />
dataset (www.esrl.noaa.gov/psd/data/gridded/data.<br />
ncep.reanalysis.derived.html) (Kalnay et al. 1996) for<br />
<strong>the</strong> period between 1948 and <strong>2010</strong>. The purpose was to<br />
determ<strong>in</strong>e <strong>the</strong> direction and <strong>in</strong>tensity of <strong>w<strong>in</strong>ter</strong> flows at<br />
<strong>the</strong> surface and at <strong>the</strong> characteristic level of <strong>the</strong> jet<br />
stream dur<strong>in</strong>g <strong>the</strong> <strong>w<strong>in</strong>ter</strong> <strong>2010</strong>, to be compared with<br />
<strong>the</strong> observations of o<strong>the</strong>r extreme, negative NAO years<br />
and <strong>the</strong> climatology records.<br />
(5) The detection and track<strong>in</strong>g of North Atlantic<br />
cyclones is based on an algorithm first developed for<br />
<strong>the</strong> Mediterranean region by Trigo et al. (1999) and<br />
later adapted to <strong>the</strong> entire North Atlantic area (Trigo<br />
2006). Both <strong>the</strong> detection and track<strong>in</strong>g schemes were<br />
performed us<strong>in</strong>g 6 h SLP, available from NCEP/NCAR<br />
reanalysis on a 2.5° × 2.5° grid from 1958 to <strong>2010</strong>.<br />
(6) Simulations of SLP under <strong>the</strong> CMIP3 project<br />
http://www-pcmdi.llnl.gov/ipcc/about_ipcc.php were<br />
downloaded from <strong>the</strong> KNMI Climate Explorer website<br />
(http://climexp.knmi.nl/) to simulate <strong>the</strong> NAO <strong>in</strong>dex<br />
from 1875 to 2100. Selection of <strong>the</strong> models was based<br />
on <strong>the</strong> availability of simulations under <strong>the</strong> A1B1 scenario<br />
<strong>in</strong> <strong>the</strong> KNMI dataset. The models selected were:<br />
CCMA-CGCM3.1_T63 (CCMA), MRI-CGCM2.3.2<br />
(MRI), UKMO-HADCM3 (UKMO), ECHAM5/MPI OM<br />
(MPI), ECHO-G/MIUB (MIUB), MIROC 3.2 (MIROC),<br />
GFDL/CM2.0 (GFDL), CSIRO Mk3.5 (CSIRO), CNRM/<br />
CM3 (CNRM) and BCCR/BCM2.0 (BCM). The NAO<br />
<strong>in</strong>dex was derived us<strong>in</strong>g <strong>the</strong> outputs for <strong>the</strong> coord<strong>in</strong>ates<br />
65° N 20° W and 35° N 5° W and <strong>the</strong> reference<br />
period 1950–1980, so that it was comparable with <strong>the</strong><br />
Jones et al. (1997) NAO <strong>in</strong>dex. SLPs from 1875 to 2000<br />
were simulated accord<strong>in</strong>g to <strong>the</strong> ‘climate of <strong>the</strong> 20th<br />
century experiment (20C3M)’; from <strong>2010</strong> onwards, simulations<br />
assumed a moderate <strong>in</strong>crease <strong>in</strong> green house<br />
gases accord<strong>in</strong>g to <strong>the</strong> A1B scenario.<br />
2.2. Analysis<br />
The <strong>w<strong>in</strong>ter</strong> (DJFM) 4 mo standardized <strong>precipitation</strong><br />
<strong>in</strong>dex (SPI) (McKee et al. 1993) was obta<strong>in</strong>ed from <strong>the</strong><br />
45 monthly <strong>precipitation</strong> series used. The <strong>in</strong>dex was<br />
calculated follow<strong>in</strong>g a Pearson III distribution by<br />
means of <strong>the</strong> algorithm formulated by Vicente-Serrano<br />
(2006). This <strong>in</strong>dex allows determ<strong>in</strong>ation of <strong>the</strong> magnitude<br />
of <strong>the</strong> <strong>precipitation</strong> anomaly for each <strong>w<strong>in</strong>ter</strong> and<br />
permits a spatial comparison <strong>in</strong>dependent of <strong>the</strong> dist<strong>in</strong>ct<br />
<strong>precipitation</strong> regime that characterises each region.<br />
The correlation between <strong>the</strong> <strong>w<strong>in</strong>ter</strong> 4 mo SPI<br />
from 1910 to <strong>2010</strong> and <strong>the</strong> <strong>w<strong>in</strong>ter</strong> NAO <strong>in</strong>dex was computed<br />
for each of <strong>the</strong> 45 observatories.<br />
To analyse <strong>the</strong> atmospheric mechanisms that drove<br />
<strong>the</strong> <strong>in</strong>fluence of <strong>the</strong> <strong>2010</strong> NAO on <strong>the</strong> <strong>Iberian</strong> <strong>w<strong>in</strong>ter</strong><br />
<strong>precipitation</strong> (both <strong>in</strong> terms of <strong>the</strong> magnitude of <strong>the</strong><br />
anomalies and <strong>the</strong> spatial patterns), we employed 3<br />
complementary methods: (1) SLP and upper level<br />
anomalies, (2) objective storm-track<strong>in</strong>g and (3) wea<strong>the</strong>r<br />
typ<strong>in</strong>g. The first approach gave us <strong>the</strong> <strong>w<strong>in</strong>ter</strong> SLP<br />
anomalies for <strong>the</strong> North Atlantic region and allowed us<br />
to plot <strong>the</strong> magnitude and direction of <strong>the</strong> surface and<br />
250 hPa w<strong>in</strong>d flows. The 2 rema<strong>in</strong><strong>in</strong>g methodologies<br />
required additional technical details.<br />
Cyclones are objectively identified as m<strong>in</strong>ima <strong>in</strong> SLP<br />
fields, fulfill<strong>in</strong>g a set of conditions regard<strong>in</strong>g <strong>the</strong> central<br />
pressure (
54<br />
Clim Res 46: 51–65, 2011<br />
of <strong>the</strong> monthly sum of days of each wea<strong>the</strong>r type. The<br />
26 wea<strong>the</strong>r types were reduced <strong>in</strong> 10 types to facilitate<br />
<strong>in</strong>terpretation of <strong>the</strong> results by means of addition<br />
of <strong>the</strong> hybrid types to <strong>the</strong> o<strong>the</strong>r types, follow<strong>in</strong>g Trigo<br />
& DaCamara (2000).<br />
3. RESULTS<br />
3.1. Precipitation<br />
Totals of <strong>precipitation</strong> recorded dur<strong>in</strong>g <strong>the</strong> <strong>w<strong>in</strong>ter</strong><br />
<strong>2010</strong> <strong>in</strong> large areas of Iberia have been <strong>the</strong> most extreme<br />
recorded s<strong>in</strong>ce climate observations have been<br />
available. Table 1 shows <strong>the</strong> percentage of available<br />
stations (45) <strong>in</strong> which <strong>the</strong> monthly <strong>precipitation</strong> was<br />
higher than <strong>the</strong> 70th and 90th percentiles. Between December<br />
and February >70% of <strong>the</strong> stations recorded<br />
values higher than <strong>the</strong> 70th percentile of <strong>the</strong> correspond<strong>in</strong>g<br />
distribution. Fur<strong>the</strong>rmore, a high percentage<br />
of stations also showed <strong>precipitation</strong> values higher than<br />
<strong>the</strong> 90th percentile (49% <strong>in</strong> December, 20% <strong>in</strong> January<br />
Table 1. Percentage of stations with monthly <strong>precipitation</strong><br />
higher than <strong>the</strong> 70th and 90th percentiles <strong>in</strong> <strong>2010</strong> and 1996<br />
>70th percentile<br />
>90th percentile<br />
1996<br />
Dec 88.9 53.3<br />
Jan 88.9 68.9<br />
Feb 31.1 6.7<br />
Mar 8.9 2.2<br />
<strong>2010</strong><br />
Dec 77.8 48.9<br />
Jan 73.3 20.0<br />
Feb 71.1 37.8<br />
Mar 44.4 8.9<br />
and 38% <strong>in</strong> February). For comparison purposes, we<br />
have also <strong>in</strong>cluded <strong>the</strong> statistics relative to <strong>the</strong> second<br />
most extreme, negative <strong>w<strong>in</strong>ter</strong> NAO (<strong>in</strong> 1996) to illustrate<br />
how <strong>the</strong>se numbers may also be found <strong>in</strong> o<strong>the</strong>r extreme,<br />
negative NAO <strong>w<strong>in</strong>ter</strong>s, albeit with a different<br />
monthly impact. Thus, <strong>in</strong> December and January of<br />
1996 <strong>the</strong> percentage of stations with monthly <strong>precipitation</strong><br />
above <strong>the</strong> 70th and 90th percentiles was higher<br />
than that observed <strong>in</strong> <strong>2010</strong>, although <strong>the</strong> percentages<br />
were much lower <strong>in</strong> February and March.<br />
As illustrative examples, between 1 December 2009<br />
and 31 March <strong>2010</strong> <strong>the</strong> <strong>precipitation</strong> recorded <strong>in</strong><br />
Lisbon (Portugal) was 958.6 mm, i.e. <strong>the</strong> maximum<br />
observed from 1865 to <strong>2010</strong> (Fig. 1). In Seville (Spa<strong>in</strong>),<br />
<strong>the</strong> average <strong>w<strong>in</strong>ter</strong> <strong>precipitation</strong> was 712.4 mm, <strong>the</strong><br />
maximum s<strong>in</strong>ce 1910. In Almería, one of <strong>the</strong> driest<br />
areas of Europe with an annual average (1910–<strong>2010</strong>) of<br />
just 209.6 mm, <strong>the</strong> 4 <strong>w<strong>in</strong>ter</strong> months (DJFM) <strong>2010</strong> registered<br />
350.2 mm, <strong>the</strong> maximum <strong>w<strong>in</strong>ter</strong> <strong>precipitation</strong><br />
ever recorded. In Madrid, <strong>the</strong> <strong>w<strong>in</strong>ter</strong> <strong>precipitation</strong><br />
was 318.1 mm, <strong>the</strong> second highest value recorded<br />
s<strong>in</strong>ce 1910. Never<strong>the</strong>less, besides <strong>the</strong> outstand<strong>in</strong>g<br />
<strong>w<strong>in</strong>ter</strong> values described above, it is often <strong>in</strong>terest<strong>in</strong>g to<br />
analyse what happened at <strong>the</strong> monthly scale. Thus,<br />
Fig. 1 shows, as an example, <strong>the</strong> monthly <strong>precipitation</strong><br />
recorded between August 2009 and May <strong>2010</strong> at <strong>the</strong><br />
observatories <strong>in</strong> Lisbon (Portugal) and Seville (Spa<strong>in</strong>),<br />
compared with long-term climatology (1910–<strong>2010</strong>).<br />
For Lisbon, all of <strong>the</strong> <strong>w<strong>in</strong>ter</strong> months (DJFM) exceeded<br />
<strong>the</strong> long-term 70th percentile, and, with <strong>the</strong> exception<br />
of January <strong>2010</strong>, <strong>the</strong>y even exceeded <strong>the</strong> 98th percentile<br />
of <strong>the</strong> monthly <strong>precipitation</strong> distribution. The<br />
correspond<strong>in</strong>g analysis obta<strong>in</strong>ed for Seville is not as<br />
impressive; still <strong>the</strong> 4 <strong>w<strong>in</strong>ter</strong> months exceeded <strong>the</strong><br />
long-term median, and 3 mo (December–February)<br />
present <strong>precipitation</strong> values above <strong>the</strong> 70th percentile,<br />
while December equals <strong>the</strong> 98% perecentile.<br />
W<strong>in</strong>ter 2009–<strong>2010</strong> 10th percentile 30th percentile 50th percentile 70th percentile 90th percentile 98th percentile<br />
350<br />
Lisbon<br />
350<br />
Seville<br />
300<br />
300<br />
Precipitation (mm)<br />
250<br />
200<br />
150<br />
100<br />
250<br />
200<br />
150<br />
100<br />
50<br />
50<br />
0<br />
Aug<br />
2009<br />
Oct Dec Feb<br />
<strong>2010</strong><br />
Apr<br />
0<br />
Aug<br />
2009<br />
Oct Dec Feb<br />
<strong>2010</strong><br />
Fig. 1. Monthly <strong>precipitation</strong> values from August 2009 to May <strong>2010</strong> <strong>in</strong> Lisbon and Seville and long-term 10th–98th percentiles<br />
Apr
Vicente-Serrano et al.: <strong>Extreme</strong> <strong>precipitation</strong> <strong>in</strong> Iberia<br />
55<br />
Fig. 2. (A) Spatial distribution of <strong>the</strong> 4 mo standardized <strong>precipitation</strong> <strong>in</strong>dex (SPI) anomalies <strong>in</strong> <strong>the</strong> <strong>w<strong>in</strong>ter</strong> of <strong>2010</strong> <strong>in</strong> relation to <strong>the</strong><br />
1910–<strong>2010</strong> reference period. Dashed and solid l<strong>in</strong>es: SPI = –1.65 and SPI = –2.33, respectively. (B) Spatial distribution of <strong>the</strong> <strong>w<strong>in</strong>ter</strong><br />
North Atlantic Oscillation (NAO)–SPI correlations (1910–<strong>2010</strong>). Black dots: stations with monthly <strong>precipitation</strong> data 1910–<strong>2010</strong><br />
Fig. 2A shows <strong>the</strong> spatial distribution of <strong>the</strong> <strong>precipitation</strong><br />
anomalies correspond<strong>in</strong>g to <strong>the</strong> 4 mo SPI values<br />
<strong>in</strong> March <strong>2010</strong>, after remov<strong>in</strong>g <strong>the</strong> 1910–<strong>2010</strong> climatology.<br />
Large positive anomalies were found on most of<br />
<strong>the</strong> <strong>Iberian</strong> Pen<strong>in</strong>sula, with exceptions of <strong>the</strong> nor<strong>the</strong>rn<br />
and Mediterranean coastlands that show near-normal<br />
or even negative anomalies. In large areas of <strong>the</strong> south,<br />
west and southwest <strong>the</strong> recorded <strong>precipitation</strong> corresponds<br />
to anomalies >2.3, which is equivalent to a<br />
return period of 1 event every 100 yr. Moreover, <strong>in</strong><br />
some locations, <strong>the</strong> obta<strong>in</strong>ed SPI value is >3 (depicted<br />
<strong>in</strong> deep blue colour), correspond<strong>in</strong>g to a return period<br />
of 1 <strong>in</strong> 1000 yr (e.g. Almería, SPI = 3.3; Albacete, SPI =<br />
3.05). Fig. 2B shows <strong>the</strong> spatial distribution of <strong>the</strong><br />
1910–<strong>2010</strong> correlation between <strong>the</strong> <strong>w<strong>in</strong>ter</strong> NAO and<br />
<strong>the</strong> 4 mo SPI <strong>in</strong> March. The pattern shows a clear spatial<br />
gradient (SW–NE), with <strong>the</strong> highest correlations<br />
be<strong>in</strong>g observed on <strong>the</strong> southwest, west and central<br />
<strong>Iberian</strong> Pen<strong>in</strong>sula, whereas non-significant correlations<br />
were found <strong>in</strong> <strong>the</strong> nor<strong>the</strong>rn coastlands and<br />
Mediterranean areas. The pattern of <strong>w<strong>in</strong>ter</strong> <strong>2010</strong> <strong>precipitation</strong><br />
anomalies shows a high resemblance with<br />
<strong>the</strong> general pattern of <strong>w<strong>in</strong>ter</strong> NAO <strong>in</strong>fluence over <strong>the</strong><br />
<strong>Iberian</strong> Pen<strong>in</strong>sula (Trigo et al. 2002). Thus, <strong>the</strong> correlation<br />
between both spatial configurations is strong and<br />
statistically significant (R = –0.56, p < 0.01). It must be<br />
emphasised that it is ra<strong>the</strong>r difficult to f<strong>in</strong>d a pattern of<br />
SPI anomalies as similar to <strong>the</strong> spatial <strong>in</strong>fluence of <strong>the</strong><br />
NAO obta<strong>in</strong>ed <strong>in</strong> <strong>2010</strong>. Fig. 3 shows <strong>the</strong> SPI values for<br />
<strong>the</strong> 2 <strong>w<strong>in</strong>ter</strong>s with <strong>the</strong> most negative NAO values prior<br />
Fig. 3. (A) Standardized <strong>precipitation</strong> <strong>in</strong>dex (SPI) for <strong>the</strong> <strong>w<strong>in</strong>ter</strong> 1969, (B) SPI for <strong>the</strong> <strong>w<strong>in</strong>ter</strong> 1996, (C) average SPI for negative<br />
NAO <strong>w<strong>in</strong>ter</strong>s (values between 0 and –1) and (D) average SPI for negative NAO <strong>w<strong>in</strong>ter</strong>s (values between –1 and –2). Black dots<br />
as <strong>in</strong> Fig. 2
56<br />
Clim Res 46: 51–65, 2011<br />
to <strong>2010</strong>, i.e 1969 and 1996. While both years reveal<br />
large areas of <strong>the</strong> <strong>Iberian</strong> Pen<strong>in</strong>sula dom<strong>in</strong>ated with<br />
positive SPI values, nei<strong>the</strong>r reach <strong>the</strong> magnitude and<br />
wider spatial coverage observed <strong>in</strong> <strong>2010</strong>. Thus, <strong>the</strong><br />
patterns show some resemblance with <strong>2010</strong>, with <strong>the</strong><br />
most positive values <strong>in</strong> <strong>the</strong> south or southwest, but several<br />
differences can also be detected. We have also<br />
<strong>in</strong>cluded an analysis of <strong>the</strong> average SPI values for <strong>the</strong><br />
<strong>w<strong>in</strong>ter</strong>s that recorded NAO values between 0 and –1<br />
and <strong>the</strong> years that recorded low negative values<br />
(between –2 and –1). These years show low SPI anomalies<br />
<strong>in</strong> comparison to <strong>the</strong> <strong>w<strong>in</strong>ter</strong> <strong>2010</strong>, although <strong>the</strong><br />
spatial pattern is quite similar. In summary, <strong>the</strong>se<br />
results affirm that <strong>the</strong> <strong>w<strong>in</strong>ter</strong> <strong>2010</strong> was exceptional <strong>in</strong><br />
relation to <strong>the</strong> rest of <strong>the</strong> negative NAO <strong>w<strong>in</strong>ter</strong>s, both<br />
<strong>in</strong> <strong>the</strong> magnitude of SPI anomalies and also <strong>in</strong> <strong>the</strong><br />
resemblance to <strong>the</strong> pattern of NAO <strong>in</strong>fluence.<br />
A daily analysis of <strong>the</strong> NAO value confirms <strong>the</strong><br />
important role of <strong>the</strong> strong negative NAO <strong>w<strong>in</strong>ter</strong> to<br />
expla<strong>in</strong> <strong>the</strong> extreme <strong>precipitation</strong> events recorded over<br />
large areas of <strong>the</strong> <strong>Iberian</strong> Pen<strong>in</strong>sula. Fig. 4 shows <strong>the</strong><br />
daily NAO <strong>in</strong>dex for <strong>the</strong> <strong>w<strong>in</strong>ter</strong> <strong>2010</strong> and <strong>the</strong> daily <strong>precipitation</strong><br />
recorded at 2 locations of southwest Iberia,<br />
Seville (Spa<strong>in</strong>) and Sao Brás (Portugal). The daily<br />
NAO <strong>in</strong>dex shows dom<strong>in</strong>ant negative values dur<strong>in</strong>g<br />
<strong>the</strong> entire <strong>w<strong>in</strong>ter</strong> season. Thus, only 17 d (out of 120)<br />
showed mild positive values of <strong>the</strong> <strong>in</strong>dex dur<strong>in</strong>g <strong>the</strong><br />
<strong>w<strong>in</strong>ter</strong>. A spell of a very strong negative NAO <strong>in</strong>dex<br />
was recorded from 10 December 2009 to 14 January<br />
<strong>2010</strong>. This period matches up with <strong>the</strong> strongest daily<br />
ra<strong>in</strong>fall recorded at both observatories. The second<br />
negative period extends from 24 January to 31 March,<br />
with <strong>the</strong> most <strong>in</strong>tense negative NAO values be<strong>in</strong>g<br />
recorded between 13 and 18 February, a period that<br />
is co<strong>in</strong>cident with a new <strong>precipitation</strong> peak at both<br />
observatories. Moreover, dur<strong>in</strong>g <strong>the</strong> 2 short periods<br />
characterised with positive NAO values, virtually no<br />
<strong>precipitation</strong> was recorded. The extreme <strong>w<strong>in</strong>ter</strong> <strong>2010</strong><br />
showed a clear anomaly <strong>in</strong> <strong>the</strong> frequency of ra<strong>in</strong>y days<br />
across <strong>the</strong> <strong>Iberian</strong> Pen<strong>in</strong>sula. Fig. 5A shows <strong>the</strong> absolute<br />
frequency of ra<strong>in</strong>y days dur<strong>in</strong>g <strong>the</strong> <strong>w<strong>in</strong>ter</strong> <strong>2010</strong>.<br />
In large areas of <strong>the</strong> west and <strong>the</strong> southwest a high<br />
number of ra<strong>in</strong>y days (>50) was recorded, with a clear<br />
west–east gradient, record<strong>in</strong>g lower frequencies <strong>in</strong> <strong>the</strong><br />
Mediterranean coastlands (1.65). These areas<br />
showed a number of days with <strong>precipitation</strong> above <strong>the</strong><br />
historical 95th percentile (Fig. 5D). As a representative<br />
example, <strong>in</strong> Lisbon, <strong>precipitation</strong> above <strong>the</strong> 95th per-<br />
Daily<br />
NAO <strong>in</strong>dex<br />
Daily <strong>precipitation</strong> (mm)<br />
3<br />
2<br />
1<br />
0<br />
–1<br />
–2<br />
–3<br />
80<br />
60<br />
40<br />
20<br />
0<br />
80<br />
60<br />
40<br />
20<br />
0<br />
1 Dec<br />
Seville<br />
Sao Brás<br />
15 Dec<br />
1 Jan<br />
15 Jan<br />
1 Feb<br />
Records <strong>in</strong> (middle panel) Seville and (lower panel) Sao Brás<br />
Fig. 4. Daily NAO <strong>in</strong>dex for <strong>w<strong>in</strong>ter</strong> <strong>2010</strong> (top) and daily <strong>precipitation</strong> records for Seville (middle) and Sao Brás (bottom)<br />
15 Feb<br />
1 Mar<br />
15 Mar<br />
31 Mar
Vicente-Serrano et al.: <strong>Extreme</strong> <strong>precipitation</strong> <strong>in</strong> Iberia<br />
57<br />
Fig. 5. (A) Spatial distribution of <strong>the</strong> number of ra<strong>in</strong>y days dur<strong>in</strong>g <strong>the</strong> <strong>w<strong>in</strong>ter</strong> <strong>2010</strong>. (B) Average ra<strong>in</strong>y days dur<strong>in</strong>g <strong>the</strong> <strong>w<strong>in</strong>ter</strong><br />
(1965–<strong>2010</strong>). (C) Percentage of ra<strong>in</strong>y days <strong>in</strong> <strong>the</strong> <strong>w<strong>in</strong>ter</strong> <strong>2010</strong> compared to <strong>the</strong> average. (D) Number of days record<strong>in</strong>g <strong>precipitation</strong><br />
>95th percentile dur<strong>in</strong>g <strong>the</strong> <strong>w<strong>in</strong>ter</strong> <strong>2010</strong>. (E) Ratio of number of days with <strong>precipitation</strong> >95th percentile compared to <strong>the</strong><br />
average. Black squares: stations with daily <strong>precipitation</strong> data 1965–<strong>2010</strong><br />
centile was recorded on 8 d dur<strong>in</strong>g <strong>the</strong> <strong>w<strong>in</strong>ter</strong> <strong>2010</strong>.<br />
Thus, <strong>the</strong> number of <strong>precipitation</strong> days above this<br />
threshold also shows a north–south gradient, with<br />
maximum values recorded <strong>in</strong> <strong>the</strong> sou<strong>the</strong>ast and southwest<br />
(Fig. 5E).<br />
3.2. Large-scale atmospheric circulation patterns<br />
We have made an effort to syn<strong>the</strong>size <strong>the</strong> most relevant<br />
large-scale features that characterise <strong>the</strong> anomalous<br />
atmospheric circulation over <strong>the</strong> North Atlantic<br />
and Europe (Figs. 6–9). The spatial distributions of <strong>the</strong><br />
SLP anomalies for <strong>the</strong> North Atlantic region dur<strong>in</strong>g <strong>the</strong><br />
<strong>w<strong>in</strong>ter</strong> <strong>2010</strong> is shown <strong>in</strong> Fig. 6A, as well as for <strong>the</strong> o<strong>the</strong>r 2<br />
extreme seasonal NAO years: 1969 (Fig. 6B) and 1996<br />
(Fig. 6C). Additionally, we have represented <strong>the</strong> average<br />
anomalous SLP field for weak (–1 < NAO < 0; Fig. 6D)<br />
and moderately negative <strong>w<strong>in</strong>ter</strong>s (–2 < NAO < –1;<br />
Fig. 6E). In <strong>2010</strong>, <strong>the</strong> SLP anomalies show a clear<br />
north–south-oriented dipole, with strong positive (negative)<br />
anomalies located over <strong>the</strong> Iceland/Greenland
58<br />
Clim Res 46: 51–65, 2011<br />
Fig. 6. Spatial distribution of <strong>the</strong> sea-level pressure (SLP)<br />
anomalies after remov<strong>in</strong>g climatology (1899–<strong>2010</strong>): (A) <strong>w<strong>in</strong>ter</strong><br />
<strong>2010</strong>, (B) <strong>w<strong>in</strong>ter</strong> 1969, (C) <strong>w<strong>in</strong>ter</strong> 1996, (D) average <strong>w<strong>in</strong>ter</strong>s<br />
with NAO values between 0 and –1 and (E) average <strong>w<strong>in</strong>ter</strong>s<br />
with NAO values between –1 and –2<br />
(Azores) region. This pattern clearly corresponds to a<br />
strong negative <strong>w<strong>in</strong>ter</strong> NAO, with <strong>the</strong> sou<strong>the</strong>rn dipole<br />
extend<strong>in</strong>g throughout most of <strong>the</strong> Mediterranean region.<br />
Anomalies have caused dom<strong>in</strong>ant upward (vertical)<br />
flows affect<strong>in</strong>g all of sou<strong>the</strong>rn Europe. A similar pattern<br />
was found <strong>in</strong> <strong>the</strong> <strong>w<strong>in</strong>ter</strong> of 1969, although <strong>the</strong> nor<strong>the</strong>rn<br />
dipole was more extended, with positive anomalies also<br />
cover<strong>in</strong>g nor<strong>the</strong>rn Europe. In contrast, <strong>in</strong> 1996, <strong>the</strong> NAO<br />
pattern was clearly displaced to <strong>the</strong> east, with <strong>the</strong> nor<strong>the</strong>rn<br />
dipole centred over Scand<strong>in</strong>avia, and <strong>the</strong> sou<strong>the</strong>rn<br />
dipole, over <strong>the</strong> <strong>Iberian</strong> Pen<strong>in</strong>sula. In any case, <strong>the</strong> patterns<br />
obta<strong>in</strong>ed for all of <strong>the</strong>se 3 extreme NAO <strong>w<strong>in</strong>ter</strong>s<br />
clearly differ <strong>in</strong> magnitude from <strong>the</strong> patterns observed<br />
for <strong>the</strong> o<strong>the</strong>r negative (but non-extreme) NAO years. In<br />
fact, although <strong>the</strong> spatial pattern of <strong>the</strong> average anomalies<br />
tends to reproduce <strong>the</strong> configuration obta<strong>in</strong>ed for<br />
<strong>the</strong> most negative NAO <strong>w<strong>in</strong>ter</strong>s, <strong>the</strong> magnitude of <strong>the</strong><br />
SLP anomalies is much lower. This behaviour <strong>in</strong>dicates<br />
that <strong>the</strong> well-def<strong>in</strong>ed NAO configurations are only observed<br />
for <strong>the</strong> most extreme, negative <strong>w<strong>in</strong>ter</strong>s and, additionally,<br />
that some variability may be recorded among<br />
extreme events, as revealed by <strong>the</strong> 1996 event, which<br />
shows a displaced pattern to <strong>the</strong> east.<br />
The negative pressure anomalies <strong>in</strong> <strong>the</strong> sou<strong>the</strong>rn<br />
part of <strong>the</strong> North Atlantic region and <strong>the</strong> large pressure<br />
gradients <strong>in</strong> <strong>2010</strong> have caused <strong>the</strong> dom<strong>in</strong>ant <strong>in</strong>fluence<br />
of strong southwesterly w<strong>in</strong>d surface flows <strong>in</strong> <strong>the</strong><br />
sou<strong>the</strong>rn and western areas of <strong>the</strong> <strong>Iberian</strong> Pen<strong>in</strong>sula,<br />
with w<strong>in</strong>d vectors of high <strong>in</strong>tensity affect<strong>in</strong>g <strong>the</strong> southwestern<br />
areas (Fig. 7A). The dom<strong>in</strong>ant surface circulation<br />
was very anomalous <strong>in</strong> relation to average conditions<br />
(Fig. 7F), s<strong>in</strong>ce <strong>the</strong> common <strong>w<strong>in</strong>ter</strong> surface<br />
flows affect<strong>in</strong>g <strong>the</strong> <strong>Iberian</strong> Pen<strong>in</strong>sula are <strong>in</strong> a west- and<br />
northwest-dom<strong>in</strong>ant pattern. Thus, south and west of<br />
<strong>the</strong> <strong>Iberian</strong> Pen<strong>in</strong>sula, <strong>the</strong> dom<strong>in</strong>ant flows are to <strong>the</strong><br />
north and nor<strong>the</strong>ast, given <strong>the</strong> usual position of <strong>the</strong><br />
Azores anticyclone, but also <strong>the</strong> relief configuration.<br />
Dom<strong>in</strong>ant surface southwest flows seem to be <strong>the</strong> common<br />
pattern for <strong>the</strong> most extreme, negative NAO <strong>w<strong>in</strong>ter</strong>s<br />
like 1969 and 1996 (Fig. 7B and C, respectively),<br />
although <strong>the</strong> high <strong>in</strong>tensity of <strong>the</strong> southwest surface<br />
flows recorded <strong>in</strong> <strong>2010</strong> was unknown for all o<strong>the</strong>r negative<br />
NAO years. In contrast, <strong>the</strong> weak and moderate<br />
negative NAO years (Fig. 7D and E) do not—on average—show<br />
dom<strong>in</strong>ant southwest surface flows, nor a<br />
high <strong>in</strong>tensity of w<strong>in</strong>d flows.
Vicente-Serrano et al.: <strong>Extreme</strong> <strong>precipitation</strong> <strong>in</strong> Iberia<br />
59<br />
Fig. 7. Average direction and magnitude of 10 m flows (A) <strong>in</strong> <strong>the</strong> <strong>w<strong>in</strong>ter</strong> <strong>2010</strong>, (B) <strong>in</strong> <strong>the</strong> <strong>w<strong>in</strong>ter</strong> 1969, (C) <strong>in</strong> <strong>the</strong> <strong>w<strong>in</strong>ter</strong> 1996, (D) <strong>in</strong><br />
<strong>the</strong> <strong>w<strong>in</strong>ter</strong>s with NAO values between 0 and –1 (1948–<strong>2010</strong>), (E) <strong>in</strong> <strong>the</strong> <strong>w<strong>in</strong>ter</strong>s with NAO values between –1 and –2 (1948–<strong>2010</strong>)<br />
and (F) climatology of <strong>the</strong> average direction and magnitude of 10 m flows (1948–<strong>2010</strong>)<br />
Fig. 8 shows a very clear displacement of <strong>the</strong> 250 hPa<br />
flows, associated with <strong>the</strong> jet stream dur<strong>in</strong>g <strong>the</strong> <strong>w<strong>in</strong>ter</strong><br />
<strong>2010</strong>, which showed an anomalous sou<strong>the</strong>rn displacement<br />
compared to average <strong>w<strong>in</strong>ter</strong> conditions (Fig. 8A).<br />
Thus, dom<strong>in</strong>ant northwest 250 hPa flows affect<strong>in</strong>g<br />
<strong>the</strong> <strong>Iberian</strong> Pen<strong>in</strong>sula are observed <strong>in</strong> <strong>the</strong> climatology<br />
(Fig. 8F), whereas, <strong>in</strong> <strong>2010</strong>, <strong>the</strong>re is a clearly dom<strong>in</strong>ant<br />
west and southwest flow direction. Thus, this pattern<br />
seems to be dist<strong>in</strong>ct for this extreme NAO <strong>w<strong>in</strong>ter</strong>,<br />
s<strong>in</strong>ce most of <strong>the</strong> non-extreme, negative NAO <strong>w<strong>in</strong>ter</strong>s<br />
(Fig. 8D, E) also show dom<strong>in</strong>ant northwest flows as is<br />
also true of <strong>the</strong> extreme episode <strong>in</strong> 1969 (Fig. 8B).<br />
Therefore, although <strong>the</strong> surface flows of <strong>the</strong> <strong>w<strong>in</strong>ter</strong><br />
<strong>2010</strong> were comparable <strong>in</strong> direction and <strong>in</strong>tensity to<br />
those observed <strong>in</strong> o<strong>the</strong>r extreme, negative NAO years,<br />
at <strong>the</strong> 250 hPa level, <strong>2010</strong> seems to have demonstrated<br />
very anomalous behaviour.<br />
3.3. Synoptic scale features obta<strong>in</strong>ed with<br />
Lagrangean and Eulerian methods<br />
Displacement of <strong>the</strong> jet stream determ<strong>in</strong>ed that<br />
storm tracks were anomalously shifted southward<br />
affect<strong>in</strong>g <strong>the</strong> cyclonic activity off Iberia, nor<strong>the</strong>rn<br />
Africa and most of <strong>the</strong> western and central sectors of<br />
<strong>the</strong> Mediterranean. This feature is illustrated <strong>in</strong> Fig. 9,<br />
which shows <strong>the</strong> frequency <strong>in</strong> <strong>the</strong> position of <strong>the</strong> centre
60<br />
Clim Res 46: 51–65, 2011<br />
Fig. 8. Average direction and magnitude of 250 hPa flows (A) <strong>in</strong> <strong>the</strong> <strong>w<strong>in</strong>ter</strong> <strong>2010</strong>, (B) <strong>in</strong> <strong>the</strong> <strong>w<strong>in</strong>ter</strong> 1969, (C) <strong>in</strong> <strong>the</strong> <strong>w<strong>in</strong>ter</strong> 1996,<br />
(D) <strong>in</strong> <strong>the</strong> <strong>w<strong>in</strong>ter</strong>s with NAO values between 0 and –1 (1948–<strong>2010</strong>), (E) <strong>in</strong> <strong>the</strong> <strong>w<strong>in</strong>ter</strong>s with NAO values between –1 and<br />
–2 (1948–<strong>2010</strong>) and (F) climatology of <strong>the</strong> average direction and magnitude of 250 hPa flows (1948–<strong>2010</strong>)<br />
of storms with durations of over 2 d that affected <strong>the</strong><br />
North Atlantic and Europe regions. In <strong>w<strong>in</strong>ter</strong> <strong>2010</strong><br />
(Fig. 9A), <strong>the</strong>re was a clear <strong>in</strong>crease <strong>in</strong> <strong>the</strong> frequency of<br />
storm tracks over <strong>the</strong> North Atlantic Ocean at <strong>the</strong> latitude<br />
of <strong>the</strong> <strong>Iberian</strong> Pen<strong>in</strong>sula compared to <strong>the</strong> climatology<br />
(Fig. 9F), <strong>in</strong> which <strong>the</strong> areas with a high frequency<br />
of <strong>w<strong>in</strong>ter</strong> storms (>8) were found northward of <strong>the</strong><br />
British Isles. This anomalous southward displacement<br />
<strong>in</strong> <strong>the</strong> high frequency of storm tracks has also been<br />
recorded for o<strong>the</strong>r extreme NAO years like 1969<br />
(Fig. 9B) and 1996 (Fig. 9C), whereas, <strong>in</strong> <strong>the</strong> nonextreme,<br />
negative NAO <strong>w<strong>in</strong>ter</strong>s (Fig. 9D,E), <strong>the</strong> frequency<br />
of storms at <strong>the</strong> latitudes near <strong>the</strong> <strong>Iberian</strong><br />
Pen<strong>in</strong>sula was much lower.<br />
While <strong>the</strong> storm-track<strong>in</strong>g approach provides a<br />
Lagrangean perspective follow<strong>in</strong>g <strong>the</strong> path of each<br />
<strong>in</strong>dividual cyclone, it can be appropriately complemented<br />
with an analysis based on a stationary Eulerian<br />
perspective, such as <strong>the</strong> wea<strong>the</strong>r typ<strong>in</strong>g approach. We<br />
analysed how <strong>the</strong> NAO affects <strong>the</strong> frequency of <strong>w<strong>in</strong>ter</strong><br />
wea<strong>the</strong>r types on <strong>the</strong> <strong>Iberian</strong> Pen<strong>in</strong>sula, and we found<br />
a significant correlation (p < 0.05) with <strong>the</strong> frequency<br />
of SW (–0.46), W (–0.44) and, above all, C (–0.76) and<br />
A (0.82) wea<strong>the</strong>r types. The NAO, <strong>the</strong>refore, affects<br />
<strong>the</strong> frequency of <strong>the</strong> wea<strong>the</strong>r types most prone to cause<br />
<strong>precipitation</strong> <strong>in</strong> <strong>w<strong>in</strong>ter</strong> (SW, W and C) and <strong>the</strong> type that<br />
generally causes dry wea<strong>the</strong>r (A). Thus, a negative<br />
<strong>w<strong>in</strong>ter</strong> NAO is expected to cause a higher than aver-
Vicente-Serrano et al.: <strong>Extreme</strong> <strong>precipitation</strong> <strong>in</strong> Iberia<br />
61<br />
Fig. 9. Spatial distribution of <strong>the</strong> absolute frequency of <strong>w<strong>in</strong>ter</strong> storm tracks (A) <strong>in</strong> <strong>the</strong> <strong>w<strong>in</strong>ter</strong> <strong>2010</strong>, (B) <strong>in</strong> <strong>the</strong> <strong>w<strong>in</strong>ter</strong> 1969, (C) <strong>in</strong> <strong>the</strong><br />
<strong>w<strong>in</strong>ter</strong> 1996. Average frequency (D) <strong>in</strong> <strong>the</strong> <strong>w<strong>in</strong>ter</strong>s with NAO values between 0 and –1 (1958–<strong>2010</strong>), (E) <strong>in</strong> <strong>the</strong> <strong>w<strong>in</strong>ter</strong>s with<br />
NAO values between –1 and –2 (1958–<strong>2010</strong>) and (F) for all <strong>w<strong>in</strong>ter</strong>s (1958–<strong>2010</strong>)<br />
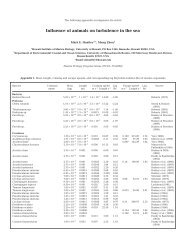
Table 2. Frequencies of different wea<strong>the</strong>r types. The table <strong>in</strong>cludes <strong>the</strong> <strong>w<strong>in</strong>ter</strong> long-term means (1900–<strong>2010</strong>); <strong>the</strong> values correspond<strong>in</strong>g<br />
to <strong>the</strong> 10th and 90th percentiles of <strong>the</strong> series; <strong>the</strong> frequency of each wea<strong>the</strong>r type <strong>in</strong> <strong>the</strong> <strong>w<strong>in</strong>ter</strong>s of <strong>2010</strong>, 1969 and 1996; and <strong>the</strong> average<br />
frequency of wea<strong>the</strong>r types <strong>in</strong> <strong>the</strong> <strong>w<strong>in</strong>ter</strong>s with North Atlantic Oscillation (NAO) values between 0 and –1 and between –1 and –2<br />
Wea<strong>the</strong>r type Mean frequency 90th 10th W<strong>in</strong>ter W<strong>in</strong>ter W<strong>in</strong>ter NAO NAO<br />
1900–<strong>2010</strong> percentile percentile <strong>2010</strong> 1996 1969 0 to –1 –1 to –2<br />
North 9 14 5 8 11 6 11 7<br />
Nor<strong>the</strong>ast 6 12 2 10 2 7 8 4<br />
East 6 11 2 6 8 2 7 5<br />
Sou<strong>the</strong>ast 6 10 2 3 9 8 4 4<br />
South 5 9 1 8 4 6 4 4<br />
Southwest 7 13 3 12 12 13 8 8<br />
West 7 12 2 12 9 12 8 13<br />
Northwest 9 13 4 5 12 8 8 11<br />
Cyclonic 18 28 9 28 36 25 20 27<br />
Anticyclonic 48 62 33 32 22 38 42 38<br />
age frequency of SW, W and C types and a low frequency<br />
of A types. The anomalous pressure pattern<br />
associated with a strong negative NAO and <strong>the</strong> w<strong>in</strong>d<br />
circulation observed <strong>in</strong> <strong>the</strong> <strong>w<strong>in</strong>ter</strong> <strong>2010</strong> determ<strong>in</strong>ed<br />
anomalous types of wea<strong>the</strong>r conditions affect<strong>in</strong>g <strong>the</strong><br />
<strong>Iberian</strong> Pen<strong>in</strong>sula. Dur<strong>in</strong>g <strong>the</strong> <strong>w<strong>in</strong>ter</strong> <strong>2010</strong>, 32 d were<br />
classified as anticyclonic, whereas <strong>the</strong> long-term average<br />
frequency <strong>in</strong> <strong>w<strong>in</strong>ter</strong> was 48 d (Table 2). In contrast,<br />
28 d were classified as cyclonic, whereas <strong>the</strong> long-term<br />
<strong>w<strong>in</strong>ter</strong> average was 18 d. Simultaneously, <strong>the</strong> ma<strong>in</strong><br />
wea<strong>the</strong>r types driv<strong>in</strong>g <strong>precipitation</strong> <strong>in</strong> <strong>the</strong> western and<br />
south-western <strong>Iberian</strong> Pen<strong>in</strong>sula (i.e. south-western
62<br />
Clim Res 46: 51–65, 2011<br />
and western directional wea<strong>the</strong>r types) were recorded<br />
on 24 d <strong>in</strong> <strong>w<strong>in</strong>ter</strong> <strong>2010</strong>, whereas <strong>the</strong> long-term daily<br />
average was 14 d. In <strong>the</strong> <strong>w<strong>in</strong>ter</strong> <strong>2010</strong>, <strong>the</strong> wea<strong>the</strong>r<br />
types most prone to cause <strong>precipitation</strong> (C, SW and W)<br />
showed a frequency of close to or more than <strong>the</strong> 90th<br />
percentile of <strong>the</strong> series. Never<strong>the</strong>less, <strong>the</strong> anomaly <strong>in</strong><br />
<strong>the</strong> frequency of <strong>the</strong>se wea<strong>the</strong>r types does not seem to<br />
expla<strong>in</strong> <strong>the</strong> large <strong>precipitation</strong> anomalies recorded <strong>in</strong><br />
<strong>the</strong> <strong>w<strong>in</strong>ter</strong> <strong>2010</strong>, s<strong>in</strong>ce <strong>the</strong> same, or an even higher, frequency<br />
of <strong>the</strong>se wea<strong>the</strong>r types has been recorded dur<strong>in</strong>g<br />
o<strong>the</strong>r negative NAO <strong>w<strong>in</strong>ter</strong>s, such as 1969 or 1996,<br />
<strong>in</strong> which <strong>precipitation</strong> anomalies were much more<br />
moderate than those recorded <strong>in</strong> <strong>2010</strong>. Thus, <strong>the</strong> average<br />
frequencies of C, SW and W wea<strong>the</strong>r types are<br />
similar to <strong>the</strong> averages for <strong>the</strong> <strong>w<strong>in</strong>ter</strong>s with NAO values<br />
between –1 and –2. Therefore, <strong>the</strong> anomalous frequency<br />
of wea<strong>the</strong>r types dur<strong>in</strong>g <strong>the</strong> <strong>w<strong>in</strong>ter</strong> <strong>2010</strong>, although<br />
prone to cause high <strong>precipitation</strong>, would not,<br />
by itself, expla<strong>in</strong> <strong>the</strong> anomalous <strong>precipitation</strong> dur<strong>in</strong>g<br />
<strong>the</strong> <strong>w<strong>in</strong>ter</strong> <strong>2010</strong>.<br />
4. FUTURE SCENARIOS OF WINTER NAO INDEX<br />
The previous analysis confirms that <strong>the</strong> extreme <strong>precipitation</strong><br />
observed <strong>in</strong> <strong>the</strong> <strong>w<strong>in</strong>ter</strong> <strong>2010</strong> was associated<br />
with anomalous and persistent strong negative conditions<br />
of <strong>the</strong> NAO pattern, which determ<strong>in</strong>ed <strong>the</strong> magnitude<br />
and direction of <strong>the</strong> w<strong>in</strong>d flows that affected <strong>the</strong><br />
<strong>Iberian</strong> Pen<strong>in</strong>sula. At daily and sub-weekly scales we<br />
showed that <strong>the</strong> NAO mode steered <strong>the</strong> trajectories of<br />
many storms associated with <strong>the</strong> Polar front on a southward<br />
track and <strong>in</strong>duced an abnormally high frequency<br />
of <strong>the</strong> wea<strong>the</strong>r types that determ<strong>in</strong>e <strong>precipitation</strong> <strong>in</strong><br />
Iberia. It is expected that future extreme NAO conditions,<br />
similar to those observed <strong>in</strong> <strong>2010</strong> (and o<strong>the</strong>r<br />
years with extreme NAO <strong>w<strong>in</strong>ter</strong>s) may also cause<br />
extreme <strong>precipitation</strong> on <strong>the</strong> <strong>Iberian</strong> Pen<strong>in</strong>sula.<br />
To project <strong>the</strong> future occurrence of extreme phases<br />
of <strong>the</strong> NAO it is necessary to check <strong>the</strong> accuracy of current<br />
state-of-<strong>the</strong>-art GCMs <strong>in</strong> reproduc<strong>in</strong>g <strong>the</strong> NAO<br />
values observed dur<strong>in</strong>g <strong>the</strong> period of available measured<br />
data. Table 3 shows <strong>the</strong> absolute frequencies of<br />
<strong>the</strong> negative NAO values dur<strong>in</strong>g <strong>the</strong> period 1875–<strong>2010</strong><br />
under <strong>the</strong> consideration of different thresholds, represent<strong>in</strong>g<br />
20% (–0.84), 10% (–1.28), 5% (–1.65) and 1%<br />
(–2.33) of <strong>the</strong> probability distribution function of <strong>the</strong><br />
NAO <strong>in</strong>dex values. The observed frequencies of Jones<br />
et al.’s (1997) NAO <strong>in</strong>dex, <strong>the</strong> frequencies obta<strong>in</strong>ed by<br />
10 different GCMs and <strong>the</strong> empirical frequencies<br />
accord<strong>in</strong>g to <strong>the</strong> length of <strong>the</strong> dataset are also shown.<br />
The table shows how <strong>the</strong> occurrence of <strong>the</strong> extreme,<br />
negative NAO values (
Vicente-Serrano et al.: <strong>Extreme</strong> <strong>precipitation</strong> <strong>in</strong> Iberia<br />
63<br />
3<br />
2<br />
NAO <strong>in</strong>dex<br />
1<br />
0<br />
–1<br />
–2<br />
–3<br />
1820 1840 1860 1880 1900 1920 1940 1960 1980 2000 2020 2040 2060 2080 2100<br />
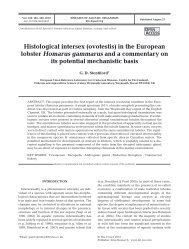
Fig. 10. Observed (1823–<strong>2010</strong>) and modelled <strong>w<strong>in</strong>ter</strong> (DJFM) NAO <strong>in</strong>dex (1875–2100) from <strong>the</strong> 10 global climate models used <strong>in</strong><br />
<strong>the</strong> present study. Grey: 10 <strong>in</strong>dividual models; blue: observed NAO; red: a multimodel approach<br />
seems to reflect a general tendency for <strong>the</strong> future.<br />
Fig. 10 shows <strong>the</strong> evolution of <strong>the</strong> observed NAO values<br />
between 1824 and <strong>2010</strong> and <strong>the</strong> predictions of <strong>the</strong><br />
10 GCMs used from 1875 to 2100. The figure also<br />
<strong>in</strong>cludes multimodel NAO predictions obta<strong>in</strong>ed with<br />
<strong>the</strong> average of <strong>the</strong> pressure fields from <strong>the</strong> 10 different<br />
models. Between 1875 and <strong>2010</strong> <strong>the</strong> range of variability<br />
between <strong>the</strong> observations and <strong>the</strong> model predictions<br />
was similar, with no trends recorded dur<strong>in</strong>g <strong>the</strong><br />
period. This pattern was also observed for <strong>the</strong> model<br />
predictions until 2039. However, from 2040 onwards,<br />
most model outputs and <strong>the</strong> multimodel average show<br />
a clear <strong>in</strong>crease <strong>in</strong> NAO <strong>in</strong>dex values, with a positive<br />
and gradual evolution up to <strong>the</strong> end of <strong>the</strong> 20th century.<br />
This would expla<strong>in</strong> <strong>the</strong> lower frequencies of <strong>the</strong><br />
most extreme, negative <strong>w<strong>in</strong>ter</strong> NAO values listed <strong>in</strong><br />
Table 3, but we must also take <strong>in</strong>to account that half of<br />
<strong>the</strong> GCMs still predicted <strong>the</strong> occurrence of extreme,<br />
negative NAO <strong>w<strong>in</strong>ter</strong>s (below <strong>the</strong> –2.33 and –1.65<br />
thresholds), with frequencies similar to those expected<br />
empirically. Therefore, although with decreas<strong>in</strong>g likelihood,<br />
it seems reasonable to expect extreme, negative<br />
<strong>w<strong>in</strong>ter</strong>s <strong>in</strong> <strong>the</strong> future, with NAO values of similar<br />
magnitude to those observed <strong>in</strong> <strong>2010</strong>. Thus, <strong>w<strong>in</strong>ter</strong>s<br />
with very extreme <strong>precipitation</strong> <strong>in</strong>duced by <strong>in</strong>tense<br />
negative NAO are likely to decrease dur<strong>in</strong>g <strong>the</strong> 21st<br />
century, but <strong>the</strong>y rema<strong>in</strong> possible.<br />
5. DISCUSSION AND CONCLUSIONS<br />
The present study has illustrated <strong>the</strong> substantial<br />
effects of <strong>the</strong> extreme, negative <strong>w<strong>in</strong>ter</strong> NAO on <strong>the</strong><br />
<strong>precipitation</strong> <strong>in</strong> western and sou<strong>the</strong>rn Iberia. The <strong>w<strong>in</strong>ter</strong><br />
NAO pattern, characterised by an <strong>in</strong>tense north–<br />
south SLP dipole over <strong>the</strong> North Atlantic region, was<br />
clearly identified <strong>in</strong> <strong>the</strong> <strong>w<strong>in</strong>ter</strong> <strong>2010</strong>. These pressure<br />
anomalies set a new record for <strong>the</strong> most extreme, negative<br />
NAO <strong>in</strong>dex values quantified s<strong>in</strong>ce 1823 (Jones et<br />
al. 1997). In <strong>2010</strong> <strong>the</strong> extreme, negative NAO conditions<br />
caused <strong>the</strong> dom<strong>in</strong>ant, humid Atlantic flows from<br />
south-westerly and westerly directions that affected<br />
most of <strong>the</strong> <strong>Iberian</strong> Pen<strong>in</strong>sula. The SLP pattern has<br />
been associated with a sou<strong>the</strong>rn displacement of <strong>the</strong><br />
jet stream and also <strong>the</strong> high number of polar storms<br />
that affected <strong>the</strong> <strong>Iberian</strong> Pen<strong>in</strong>sula and Mediterranean<br />
bas<strong>in</strong>, for <strong>the</strong> most part above <strong>the</strong> average <strong>w<strong>in</strong>ter</strong> frequency<br />
(as shown <strong>in</strong> Trigo 2006). These patterns determ<strong>in</strong>ed<br />
that <strong>the</strong> wea<strong>the</strong>r types prone to cause <strong>precipitation</strong><br />
on <strong>the</strong> <strong>Iberian</strong> Pen<strong>in</strong>sula (cyclonic and advectives<br />
of west and southwest) had a very high frequency <strong>in</strong><br />
<strong>the</strong> <strong>w<strong>in</strong>ter</strong> <strong>2010</strong>.<br />
At <strong>the</strong> regional scale, <strong>the</strong> ma<strong>in</strong> consequence of <strong>the</strong><br />
anomalous atmospheric conditions was <strong>the</strong> extremely<br />
high levels of <strong>precipitation</strong> on most of <strong>the</strong> <strong>Iberian</strong><br />
Pen<strong>in</strong>sula dur<strong>in</strong>g <strong>the</strong> <strong>w<strong>in</strong>ter</strong> <strong>2010</strong>, with a clear north–<br />
south gradient that resembles <strong>the</strong> widely recognised<br />
<strong>in</strong>fluence of <strong>the</strong> NAO <strong>in</strong> <strong>the</strong> region (Rodríguez-Puebla<br />
et al. 1998, Trigo et al. 2002). Thus, <strong>the</strong> nor<strong>the</strong>rn and<br />
eastern coastlands, where <strong>the</strong> effect of <strong>the</strong> <strong>w<strong>in</strong>ter</strong> NAO<br />
on <strong>precipitation</strong> is usually weaker, did not display positive<br />
<strong>precipitation</strong> anomalies dur<strong>in</strong>g <strong>the</strong> <strong>w<strong>in</strong>ter</strong> <strong>2010</strong>.<br />
In contrast, <strong>the</strong> strongest positive anomalies were recorded<br />
<strong>in</strong> western and sou<strong>the</strong>rn areas, where <strong>precipitation</strong><br />
is primarily controlled by <strong>the</strong> NAO. Moreover, <strong>in</strong><br />
<strong>the</strong>se areas, <strong>the</strong> most extreme <strong>precipitation</strong> events at a<br />
daily time scale were recorded dur<strong>in</strong>g <strong>the</strong> days with<br />
<strong>the</strong> strongest negative NAO <strong>in</strong>dex. In addition, <strong>the</strong><br />
extreme seasonal <strong>precipitation</strong> was related to both <strong>the</strong><br />
large <strong>in</strong>crease <strong>in</strong> <strong>the</strong> frequency of ra<strong>in</strong>y days and <strong>the</strong>
64<br />
Clim Res 46: 51–65, 2011<br />
frequency of daily extreme <strong>precipitation</strong> events, although<br />
some spatial differences were found to play<br />
a role <strong>in</strong> both phenomena. For example, <strong>in</strong> Atlantic<br />
coastlands, <strong>the</strong> frequency of ra<strong>in</strong>y days did not show a<br />
large anomaly; ra<strong>the</strong>r, <strong>the</strong> large values of <strong>the</strong> <strong>precipitation</strong><br />
observed were a consequence of <strong>the</strong> high frequency<br />
of extreme daily <strong>precipitation</strong> events.<br />
We must note that most of <strong>the</strong> anomalous atmospheric<br />
conditions recorded dur<strong>in</strong>g <strong>the</strong> <strong>w<strong>in</strong>ter</strong> <strong>2010</strong> are<br />
comparable to o<strong>the</strong>r extreme, negative NAO <strong>w<strong>in</strong>ter</strong>s<br />
such as 1996, <strong>in</strong> which more moderate <strong>precipitation</strong><br />
was recorded. For example, <strong>the</strong> anomalous frequency<br />
of wea<strong>the</strong>r types prone to cause <strong>precipitation</strong> was similar<br />
to <strong>the</strong> frequency recorded <strong>in</strong> o<strong>the</strong>r negative NAO<br />
<strong>w<strong>in</strong>ter</strong>s. Also, <strong>the</strong> <strong>in</strong>tensity and direction of <strong>the</strong> w<strong>in</strong>d<br />
surface flows were similar to those observed for o<strong>the</strong>r<br />
negative <strong>w<strong>in</strong>ter</strong>s (i.e. 1969 and 1996). Never<strong>the</strong>less, <strong>in</strong><br />
<strong>the</strong> <strong>w<strong>in</strong>ter</strong> <strong>2010</strong> some particularities were recorded<br />
that would expla<strong>in</strong> <strong>the</strong> extremely high <strong>precipitation</strong><br />
recorded <strong>in</strong> large areas of <strong>the</strong> <strong>Iberian</strong> Pen<strong>in</strong>sula. For<br />
example, <strong>the</strong> SLP gradient between <strong>the</strong> north and<br />
south of <strong>the</strong> North Atlantic region, characteristic of <strong>the</strong><br />
NAO dipole (Hurrell et al. 2003), was very <strong>in</strong>tense <strong>in</strong><br />
<strong>the</strong> <strong>w<strong>in</strong>ter</strong> <strong>2010</strong>, only comparable with <strong>the</strong> <strong>w<strong>in</strong>ter</strong> of<br />
1969, and very different—<strong>in</strong> terms of <strong>the</strong> magnitude of<br />
<strong>the</strong> anomalies—with that observed <strong>in</strong> o<strong>the</strong>r negative<br />
NAO <strong>w<strong>in</strong>ter</strong>s. Even <strong>the</strong> second strongest <strong>w<strong>in</strong>ter</strong> NAO<br />
(1996) showed lower SLP anomalies, ma<strong>in</strong>ly <strong>in</strong> <strong>the</strong><br />
sou<strong>the</strong>rn part of <strong>the</strong> NAO dipole, which affects <strong>the</strong><br />
<strong>Iberian</strong> Pen<strong>in</strong>sula. The ma<strong>in</strong> difference <strong>in</strong> <strong>the</strong> atmospheric<br />
mechanisms recorded <strong>in</strong> <strong>2010</strong> versus <strong>in</strong> o<strong>the</strong>r<br />
negative NAO <strong>w<strong>in</strong>ter</strong>s was recorded <strong>in</strong> <strong>the</strong> 250 hPa<br />
flows, which, <strong>in</strong> <strong>2010</strong>, showed a clear displacement to<br />
<strong>the</strong> south, with a dom<strong>in</strong>ant southwest pattern and a<br />
high <strong>in</strong>tensity that affected <strong>the</strong> <strong>Iberian</strong> Pen<strong>in</strong>sula.<br />
Thus, <strong>the</strong> <strong>w<strong>in</strong>ter</strong> of <strong>2010</strong> evidenced a very anomalous<br />
displacement of <strong>the</strong> mid-latitude jet stream (L’Hereux<br />
et al. <strong>2010</strong>), which had not previously been observed<br />
<strong>in</strong> any o<strong>the</strong>r <strong>w<strong>in</strong>ter</strong> NAO. Thus, this displacement<br />
directly affected <strong>the</strong> western and sou<strong>the</strong>rn areas of <strong>the</strong><br />
<strong>Iberian</strong> Pen<strong>in</strong>sula, with an above-average frequency<br />
of cyclones cross<strong>in</strong>g <strong>the</strong> region. Therefore, <strong>the</strong> ma<strong>in</strong><br />
atmospheric mechanisms, which may expla<strong>in</strong> <strong>the</strong> exceptional<br />
<strong>precipitation</strong> recorded on <strong>the</strong> <strong>Iberian</strong> Pen<strong>in</strong>sula<br />
dur<strong>in</strong>g <strong>w<strong>in</strong>ter</strong> <strong>2010</strong>, were associated with a<br />
very negative NAO, but were more strongly l<strong>in</strong>ked to<br />
<strong>the</strong> anomalous conditions <strong>in</strong> <strong>the</strong> mid-troposphere than<br />
to <strong>the</strong> surface anomalies.<br />
An <strong>in</strong>terest<strong>in</strong>g characteristic of <strong>the</strong> <strong>w<strong>in</strong>ter</strong> <strong>2010</strong> was<br />
<strong>the</strong> persistence of ra<strong>in</strong>y days, with an anomalously<br />
high frequency over most of <strong>the</strong> <strong>Iberian</strong> Pen<strong>in</strong>sula.<br />
Thus, <strong>the</strong> NAO, measured at a daily scale, showed a<br />
high persistence of negative values, with 2 periods of<br />
35 and 65 consecutive days <strong>in</strong> which <strong>the</strong> daily NAO<br />
<strong>in</strong>dex was cont<strong>in</strong>uously negative. The <strong>w<strong>in</strong>ter</strong> <strong>2010</strong><br />
showed a high persistence of block<strong>in</strong>g conditions <strong>in</strong><br />
<strong>the</strong> North Atlantic region (Cattiaux et al. <strong>2010</strong>), which<br />
commonly caused a displacement of <strong>the</strong> mid- to hightroposphere<br />
flows to more sou<strong>the</strong>rn latitudes (Barriopedro<br />
et al. 2006). Such a pattern was ultimately responsible<br />
for <strong>the</strong> large anomaly found <strong>in</strong> <strong>the</strong> average<br />
direction and <strong>in</strong>tensity of <strong>the</strong> 250 hPa flows and <strong>the</strong><br />
sou<strong>the</strong>rn displacement of <strong>the</strong> mid-latitude jet stream<br />
(Cattiaux et al. <strong>2010</strong>).<br />
Climate change scenarios obta<strong>in</strong>ed with different<br />
GCMs reveal that a significant decrease of <strong>precipitation</strong><br />
<strong>in</strong> this region can be expected (Solomon et al.<br />
2007). In addition, future projections of <strong>the</strong> NAO <strong>in</strong>dex<br />
based on GCMs show a general, positive trend throughout<br />
<strong>the</strong> 21st century (e.g. Osborn et al. 1999, Demuzere<br />
et al. 2009). Despite <strong>the</strong> positive trend, GCMs <strong>in</strong>form<br />
that extreme, negative NAO conditions, as strong as<br />
that observed for <strong>the</strong> <strong>w<strong>in</strong>ter</strong> <strong>2010</strong>, will still be recorded<br />
<strong>in</strong> <strong>the</strong> future, which, accord<strong>in</strong>g to results of this work,<br />
may cause very high <strong>precipitation</strong> <strong>in</strong> <strong>the</strong> sou<strong>the</strong>rn and<br />
western parts of <strong>the</strong> <strong>Iberian</strong> Pen<strong>in</strong>sula. Never<strong>the</strong>less,<br />
we must bear <strong>in</strong> m<strong>in</strong>d that present climate models are<br />
still unable to consistently replicate <strong>the</strong> observed<br />
amplitude of <strong>the</strong> <strong>in</strong>terannual variability and of important<br />
modes, e.g. <strong>the</strong> NAO (Osborn 2004, Solomon et<br />
al. 2007), and <strong>the</strong>refore some uncerta<strong>in</strong>ties may rema<strong>in</strong><br />
<strong>in</strong> <strong>the</strong> presented projections.<br />
Acknowledgements. This work was supported by <strong>the</strong><br />
research projects CGL2008-01189/BTE and CGL2006-11619/<br />
HID, f<strong>in</strong>anced by <strong>the</strong> Spanish Commission of Science and<br />
Technology and FEDER; by EUROGEOSS (FP7-ENV-2008-1-<br />
226487) and ACQWA (FP7-ENV-2007-1-212250), f<strong>in</strong>anced by<br />
<strong>the</strong> VII Framework Programme of <strong>the</strong> European Commission;<br />
and ‘La nieve en el Pir<strong>in</strong>eo aragonés: distribución espacial y<br />
su respuesta a las condiciones climáticas’, f<strong>in</strong>anced by ‘Obra<br />
Social La Caixa’ and <strong>the</strong> Aragón Government. Ricardo Trigo’s<br />
work was partially supported by <strong>the</strong> FCT (Portugal) through<br />
project ENAC (PTDC/AAC-CLI/103567/2008).<br />
LITERATURE CITED<br />
Aust<strong>in</strong> RB, Cantero-Martínez C, Arrúe JL, Playán E, Cano-<br />
Marcellán P (1998) Yield–ra<strong>in</strong>fall relationships <strong>in</strong> cereal<br />
cropp<strong>in</strong>g systems <strong>in</strong> <strong>the</strong> Ebro river valley of Spa<strong>in</strong>. Eur J<br />
Agron 8:239–248<br />
Baldw<strong>in</strong> MP, Dunkerton TJ (1999) Propagation of <strong>the</strong> Arctic<br />
Oscillation from <strong>the</strong> stratosphere to <strong>the</strong> troposphere.<br />
J Geophys Res 104:30937–30946<br />
Barriopedro D, García-Herrera R, Lupo A, Hernández E<br />
(2006) A Climatology of Nor<strong>the</strong>rn Hemisphere Block<strong>in</strong>g.<br />
J Clim 19:1042–1063<br />
Brönnimann S (2007) Impact of El Niño–Sou<strong>the</strong>rn Oscillation<br />
on European climate. Rev Geophys 45. doi:10.1029/2006<br />
RG000199<br />
Brönnimann S, Luterbacher J, Staehel<strong>in</strong> J, Svendby TM,<br />
Hansen G, Svenøe T (2004) <strong>Extreme</strong> climate of <strong>the</strong> global<br />
troposphere and stratosphere <strong>in</strong> 1940–42 related to El<br />
Niño. Nature 431:971–974
Vicente-Serrano et al.: <strong>Extreme</strong> <strong>precipitation</strong> <strong>in</strong> Iberia<br />
65<br />
Cattiaux J, Vautard R, Cassou C, Yiou P, Masson-Delmotte V,<br />
Codron F (<strong>2010</strong>) <strong>in</strong> Europe: a cold extreme <strong>in</strong> a warm<strong>in</strong>g<br />
climate. Geophys Res Lett 37. doi:10.1029/<strong>2010</strong>GL044613<br />
Demuzere M, Werner M, van Lipzig NPM, Roeckner E (2009)<br />
An analysis of present and future ECHAM5 pressure<br />
fields us<strong>in</strong>g a classification of circulation patterns. Int J<br />
Climatol 29:1796–1810<br />
Hurrell JW (1995) Decadal trends <strong>in</strong> North Atlantic Oscillation:<br />
regional temperatures and <strong>precipitation</strong>. Science<br />
269:676–679<br />
Hurrell JW, Van Loon H (1997) Decadal variations <strong>in</strong> climate<br />
associated with <strong>the</strong> North Atlantic Oscillation. Clim Change<br />
36:301–326<br />
Hurrell JW, Kushnir Y, Ottersen G, Visbeck M (2003) An overview<br />
of <strong>the</strong> North Atlantic Oscillation. The North Atlantic<br />
Oscillation: climate significance and environmental impact.<br />
Geophys Monogr 134:1–36<br />
Jenk<strong>in</strong>son AF, Collison P (1977) An <strong>in</strong>itial climatology of<br />
Wales over <strong>the</strong> North Sea. Synoptic Climatology Branch<br />
Memorandum 62, Meteorological Office, London<br />
Jones PD, Jónsson T, Wheeler D (1997) Extension to <strong>the</strong> North<br />
Atlantic Oscillation us<strong>in</strong>g early <strong>in</strong>strumental pressure observations<br />
from Gibraltar and south-west Iceland. Int J<br />
Climatol 17:1433–1450<br />
Kalnay E, Kanamitsu M, Kistler R, Coll<strong>in</strong>s W and o<strong>the</strong>rs (1996)<br />
The NCEP/NCAR 40-year reanalysis project. Bull Am<br />
Meteorol Soc 77:437–471<br />
L’Heureux M, Butler A, Jha B, Kumar A, Wang W (<strong>2010</strong>)<br />
Unusual extremes <strong>in</strong> <strong>the</strong> negative phase of <strong>the</strong> Arctic<br />
Oscillation dur<strong>in</strong>g 2009. Geophys Res Lett 37. doi:10.1029/<br />
<strong>2010</strong>GL043338<br />
López-Moreno JI, Vicente-Serrano SM (2007) Atmospheric<br />
circulation <strong>in</strong>fluence on <strong>the</strong> <strong>in</strong>terannual variability of<br />
snowpack <strong>in</strong> <strong>the</strong> Spanish Pyrenees dur<strong>in</strong>g <strong>the</strong> second half<br />
of <strong>the</strong> twentieth century. Nord Hydrol 38:33–44<br />
López-Moreno JI, Vicente-Serrano SM, Beguería S, García-<br />
Ruiz JM, Portela MM, Almeida AB (2009) Downstream<br />
propagation of hydrological droughts <strong>in</strong> highly regulated<br />
transboundary rivers: <strong>the</strong> case of <strong>the</strong> Tagus River between<br />
Spa<strong>in</strong> and Portugal. Water Resour Res 45:W02405. doi:<br />
10.1029/2008WR007198<br />
Lorenzo-Lacruz J, Vicente-Serrano SM, López-Moreno JI,<br />
Beguería S, García-Ruiz JM, Cuadrat JM (<strong>2010</strong>) The<br />
impact of droughts and water management on various<br />
hydrological systems <strong>in</strong> <strong>the</strong> headwaters of <strong>the</strong> Tagus River<br />
(central Spa<strong>in</strong>). J Hydrol (Amst) 386:13–26<br />
McKee TBN, Doesken J, Kleist J (1993) The relationship of<br />
drought frequency and duration to time scales. In: Proc 8th<br />
Conf on Applied Climatology. Am Meteorol Soc p 179–184<br />
Osborn TJ (2004) Simulat<strong>in</strong>g <strong>the</strong> <strong>w<strong>in</strong>ter</strong> North Atlantic Oscillation:<br />
<strong>the</strong> roles of <strong>in</strong>ternal variability and greenhouse gas<br />
forc<strong>in</strong>g. Clim Dyn 22:605–623<br />
Osborn TJ, Briffa KR, Tett SFB, Jones PD, Trigo RM (1999)<br />
Evaluation of <strong>the</strong> North Atlantic Oscillation as simulated<br />
by a coupled climate model. Clim Dyn 15:685–702<br />
Editorial responsibility: Luis Gimeno,<br />
Ourense, Spa<strong>in</strong><br />
Rodríguez-Puebla C, Enc<strong>in</strong>as AH, Nieto S, Garmendia J<br />
(1998) Spatial and temporal patterns of annual <strong>precipitation</strong><br />
variability over <strong>the</strong> <strong>Iberian</strong> Pen<strong>in</strong>sula. Int J Climatol<br />
18:299–316<br />
Seager R, Kushnir Y, Nakamura J, T<strong>in</strong>g M, Naik N (<strong>2010</strong>)<br />
Nor<strong>the</strong>rn Hemisphere <strong>w<strong>in</strong>ter</strong> snow anomalies: ENSO,<br />
NAO and <strong>the</strong> <strong>w<strong>in</strong>ter</strong> of 2009/10. Geophys Res Lett 37.<br />
doi:10.1029/<strong>2010</strong>GL043830<br />
Solomon S, Q<strong>in</strong> D, Mann<strong>in</strong>g M, Alley RB and o<strong>the</strong>rs (2007)<br />
Technical summary. In: Solomon S, Q<strong>in</strong> D, Mann<strong>in</strong>g M,<br />
Chen Z, Marquis M, Averyt KB, Tignor M, Miller HL (eds)<br />
Climate Change 2007: <strong>the</strong> physical science basis. Contribution<br />
of Work<strong>in</strong>g Group I to <strong>the</strong> 4th assessment report of<br />
<strong>the</strong> Intergovernmental Panel on Climate Change. Cambridge<br />
University Press, Cambridge<br />
Trenberth KE, Guillemot ChJ (1996) Physical processes<br />
<strong>in</strong>volved <strong>in</strong> <strong>the</strong> 1988 drought and 1993 floods <strong>in</strong> north<br />
America. J Clim 9:1288–1298<br />
Trenberth KE, Paol<strong>in</strong>o DA Jr (1980) The Nor<strong>the</strong>rn Hemisphere<br />
sea-level pressure data set: trends, errors, and<br />
discont<strong>in</strong>uities. Mon Wea<strong>the</strong>r Rev 108:855–872<br />
Trigo IF (2006) Climatology and <strong>in</strong>terannual variability of<br />
storm-tracks <strong>in</strong> <strong>the</strong> Euro-Atlantic sector: a comparison<br />
between ERA-40 and NCEP/NCAR reanalyses. Clim Dyn<br />
26:127–143<br />
Trigo RM, DaCamara C (2000) Circulation wea<strong>the</strong>r types and<br />
<strong>the</strong>ir <strong>in</strong>fluence on <strong>the</strong> <strong>precipitation</strong> regime <strong>in</strong> Portugal.<br />
Int J Climatol 20:1559–1581<br />
Trigo IF, Trevor DD, Grant RB (1999) Objective climatology of<br />
cyclones <strong>in</strong> <strong>the</strong> Mediterranean region. J Clim 12:1685–1696<br />
Trigo RM, Osborn TJ, Corte-Real JM (2002) The North<br />
Atlantic Oscillation <strong>in</strong>fluence on Europe: climate impacts<br />
and associated physical mechanisms. Clim Res 20:9–17<br />
Vicente-Serrano SM (2005) El Niño and La Niña <strong>in</strong>fluence on<br />
drought conditions at different time scales <strong>in</strong> <strong>the</strong> <strong>Iberian</strong><br />
Pen<strong>in</strong>sula. Water Resour Res 41:W12415. doi:10.1029/2004<br />
WR003908<br />
Vicente-Serrano SM (2006) Differences <strong>in</strong> spatial patterns of<br />
drought on different time scales: an analysis of <strong>the</strong> <strong>Iberian</strong><br />
Pen<strong>in</strong>sula. Water Resour Manag 20:37–60<br />
Vicente-Serrano SM, Cuadrat JM, Romo A (2006) Early<br />
prediction of crop productions us<strong>in</strong>g drought <strong>in</strong>dices at<br />
different time scales and remote sens<strong>in</strong>g data: application<br />
<strong>in</strong> <strong>the</strong> Ebro valley (north-east Spa<strong>in</strong>). Int J Remote Sens<br />
27:511–518<br />
Wallace JM (2000) North Atlantic Oscillation/annular model:<br />
two paradigms-one phenomenon. QJR Meteorol Soc 126:<br />
791–805<br />
Wang C, Liu H, Lee S (<strong>2010</strong>) The record-break<strong>in</strong>g cold temperatures<br />
dur<strong>in</strong>g <strong>the</strong> <strong>w<strong>in</strong>ter</strong> of 2009/<strong>2010</strong> <strong>in</strong> <strong>the</strong> Nor<strong>the</strong>rn<br />
Hemisphere. Atmos Sci Lett. doi:10.1002/asl.278<br />
Zezere JL, Trigo RM, Fragoso M, Oliveira SC, Garcia RAC<br />
(2008) Ra<strong>in</strong>fall-triggered landslides <strong>in</strong> <strong>the</strong> Lisbon region<br />
over 2006 and relationships with <strong>the</strong> North Atlantic Oscillation.<br />
Nat Hazards Earth Syst Sci 8:483–499<br />
Submitted: July 14, <strong>2010</strong>; Accepted: November 18, <strong>2010</strong><br />
Proofs received from author(s): January 19, 2011