Extreme winter precipitation in the Iberian Peninsula in 2010 ...
Extreme winter precipitation in the Iberian Peninsula in 2010 ...
Extreme winter precipitation in the Iberian Peninsula in 2010 ...

You also want an ePaper? Increase the reach of your titles
YUMPU automatically turns print PDFs into web optimized ePapers that Google loves.
62<br />
Clim Res 46: 51–65, 2011<br />
and western directional wea<strong>the</strong>r types) were recorded<br />
on 24 d <strong>in</strong> <strong>w<strong>in</strong>ter</strong> <strong>2010</strong>, whereas <strong>the</strong> long-term daily<br />
average was 14 d. In <strong>the</strong> <strong>w<strong>in</strong>ter</strong> <strong>2010</strong>, <strong>the</strong> wea<strong>the</strong>r<br />
types most prone to cause <strong>precipitation</strong> (C, SW and W)<br />
showed a frequency of close to or more than <strong>the</strong> 90th<br />
percentile of <strong>the</strong> series. Never<strong>the</strong>less, <strong>the</strong> anomaly <strong>in</strong><br />
<strong>the</strong> frequency of <strong>the</strong>se wea<strong>the</strong>r types does not seem to<br />
expla<strong>in</strong> <strong>the</strong> large <strong>precipitation</strong> anomalies recorded <strong>in</strong><br />
<strong>the</strong> <strong>w<strong>in</strong>ter</strong> <strong>2010</strong>, s<strong>in</strong>ce <strong>the</strong> same, or an even higher, frequency<br />
of <strong>the</strong>se wea<strong>the</strong>r types has been recorded dur<strong>in</strong>g<br />
o<strong>the</strong>r negative NAO <strong>w<strong>in</strong>ter</strong>s, such as 1969 or 1996,<br />
<strong>in</strong> which <strong>precipitation</strong> anomalies were much more<br />
moderate than those recorded <strong>in</strong> <strong>2010</strong>. Thus, <strong>the</strong> average<br />
frequencies of C, SW and W wea<strong>the</strong>r types are<br />
similar to <strong>the</strong> averages for <strong>the</strong> <strong>w<strong>in</strong>ter</strong>s with NAO values<br />
between –1 and –2. Therefore, <strong>the</strong> anomalous frequency<br />
of wea<strong>the</strong>r types dur<strong>in</strong>g <strong>the</strong> <strong>w<strong>in</strong>ter</strong> <strong>2010</strong>, although<br />
prone to cause high <strong>precipitation</strong>, would not,<br />
by itself, expla<strong>in</strong> <strong>the</strong> anomalous <strong>precipitation</strong> dur<strong>in</strong>g<br />
<strong>the</strong> <strong>w<strong>in</strong>ter</strong> <strong>2010</strong>.<br />
4. FUTURE SCENARIOS OF WINTER NAO INDEX<br />
The previous analysis confirms that <strong>the</strong> extreme <strong>precipitation</strong><br />
observed <strong>in</strong> <strong>the</strong> <strong>w<strong>in</strong>ter</strong> <strong>2010</strong> was associated<br />
with anomalous and persistent strong negative conditions<br />
of <strong>the</strong> NAO pattern, which determ<strong>in</strong>ed <strong>the</strong> magnitude<br />
and direction of <strong>the</strong> w<strong>in</strong>d flows that affected <strong>the</strong><br />
<strong>Iberian</strong> Pen<strong>in</strong>sula. At daily and sub-weekly scales we<br />
showed that <strong>the</strong> NAO mode steered <strong>the</strong> trajectories of<br />
many storms associated with <strong>the</strong> Polar front on a southward<br />
track and <strong>in</strong>duced an abnormally high frequency<br />
of <strong>the</strong> wea<strong>the</strong>r types that determ<strong>in</strong>e <strong>precipitation</strong> <strong>in</strong><br />
Iberia. It is expected that future extreme NAO conditions,<br />
similar to those observed <strong>in</strong> <strong>2010</strong> (and o<strong>the</strong>r<br />
years with extreme NAO <strong>w<strong>in</strong>ter</strong>s) may also cause<br />
extreme <strong>precipitation</strong> on <strong>the</strong> <strong>Iberian</strong> Pen<strong>in</strong>sula.<br />
To project <strong>the</strong> future occurrence of extreme phases<br />
of <strong>the</strong> NAO it is necessary to check <strong>the</strong> accuracy of current<br />
state-of-<strong>the</strong>-art GCMs <strong>in</strong> reproduc<strong>in</strong>g <strong>the</strong> NAO<br />
values observed dur<strong>in</strong>g <strong>the</strong> period of available measured<br />
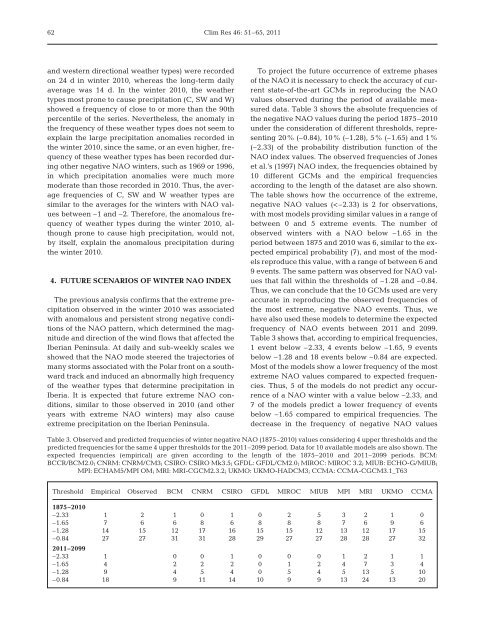
data. Table 3 shows <strong>the</strong> absolute frequencies of<br />
<strong>the</strong> negative NAO values dur<strong>in</strong>g <strong>the</strong> period 1875–<strong>2010</strong><br />
under <strong>the</strong> consideration of different thresholds, represent<strong>in</strong>g<br />
20% (–0.84), 10% (–1.28), 5% (–1.65) and 1%<br />
(–2.33) of <strong>the</strong> probability distribution function of <strong>the</strong><br />
NAO <strong>in</strong>dex values. The observed frequencies of Jones<br />
et al.’s (1997) NAO <strong>in</strong>dex, <strong>the</strong> frequencies obta<strong>in</strong>ed by<br />
10 different GCMs and <strong>the</strong> empirical frequencies<br />
accord<strong>in</strong>g to <strong>the</strong> length of <strong>the</strong> dataset are also shown.<br />
The table shows how <strong>the</strong> occurrence of <strong>the</strong> extreme,<br />
negative NAO values (