Extreme winter precipitation in the Iberian Peninsula in 2010 ...
Extreme winter precipitation in the Iberian Peninsula in 2010 ...
Extreme winter precipitation in the Iberian Peninsula in 2010 ...

Create successful ePaper yourself
Turn your PDF publications into a flip-book with our unique Google optimized e-Paper software.
Vicente-Serrano et al.: <strong>Extreme</strong> <strong>precipitation</strong> <strong>in</strong> Iberia<br />
57<br />
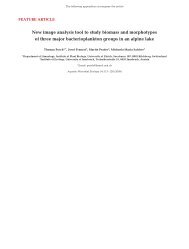
Fig. 5. (A) Spatial distribution of <strong>the</strong> number of ra<strong>in</strong>y days dur<strong>in</strong>g <strong>the</strong> <strong>w<strong>in</strong>ter</strong> <strong>2010</strong>. (B) Average ra<strong>in</strong>y days dur<strong>in</strong>g <strong>the</strong> <strong>w<strong>in</strong>ter</strong><br />
(1965–<strong>2010</strong>). (C) Percentage of ra<strong>in</strong>y days <strong>in</strong> <strong>the</strong> <strong>w<strong>in</strong>ter</strong> <strong>2010</strong> compared to <strong>the</strong> average. (D) Number of days record<strong>in</strong>g <strong>precipitation</strong><br />
>95th percentile dur<strong>in</strong>g <strong>the</strong> <strong>w<strong>in</strong>ter</strong> <strong>2010</strong>. (E) Ratio of number of days with <strong>precipitation</strong> >95th percentile compared to <strong>the</strong><br />
average. Black squares: stations with daily <strong>precipitation</strong> data 1965–<strong>2010</strong><br />
centile was recorded on 8 d dur<strong>in</strong>g <strong>the</strong> <strong>w<strong>in</strong>ter</strong> <strong>2010</strong>.<br />
Thus, <strong>the</strong> number of <strong>precipitation</strong> days above this<br />
threshold also shows a north–south gradient, with<br />
maximum values recorded <strong>in</strong> <strong>the</strong> sou<strong>the</strong>ast and southwest<br />
(Fig. 5E).<br />
3.2. Large-scale atmospheric circulation patterns<br />
We have made an effort to syn<strong>the</strong>size <strong>the</strong> most relevant<br />
large-scale features that characterise <strong>the</strong> anomalous<br />
atmospheric circulation over <strong>the</strong> North Atlantic<br />
and Europe (Figs. 6–9). The spatial distributions of <strong>the</strong><br />
SLP anomalies for <strong>the</strong> North Atlantic region dur<strong>in</strong>g <strong>the</strong><br />
<strong>w<strong>in</strong>ter</strong> <strong>2010</strong> is shown <strong>in</strong> Fig. 6A, as well as for <strong>the</strong> o<strong>the</strong>r 2<br />
extreme seasonal NAO years: 1969 (Fig. 6B) and 1996<br />
(Fig. 6C). Additionally, we have represented <strong>the</strong> average<br />
anomalous SLP field for weak (–1 < NAO < 0; Fig. 6D)<br />
and moderately negative <strong>w<strong>in</strong>ter</strong>s (–2 < NAO < –1;<br />
Fig. 6E). In <strong>2010</strong>, <strong>the</strong> SLP anomalies show a clear<br />
north–south-oriented dipole, with strong positive (negative)<br />
anomalies located over <strong>the</strong> Iceland/Greenland