Extreme winter precipitation in the Iberian Peninsula in 2010 ...
Extreme winter precipitation in the Iberian Peninsula in 2010 ...
Extreme winter precipitation in the Iberian Peninsula in 2010 ...

You also want an ePaper? Increase the reach of your titles
YUMPU automatically turns print PDFs into web optimized ePapers that Google loves.
Vicente-Serrano et al.: <strong>Extreme</strong> <strong>precipitation</strong> <strong>in</strong> Iberia<br />
55<br />
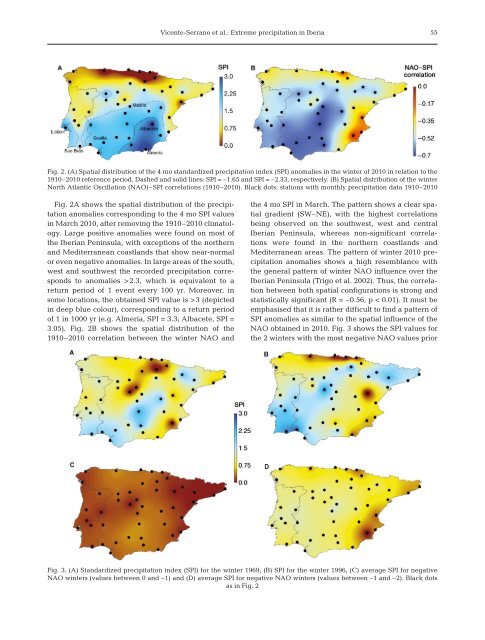
Fig. 2. (A) Spatial distribution of <strong>the</strong> 4 mo standardized <strong>precipitation</strong> <strong>in</strong>dex (SPI) anomalies <strong>in</strong> <strong>the</strong> <strong>w<strong>in</strong>ter</strong> of <strong>2010</strong> <strong>in</strong> relation to <strong>the</strong><br />
1910–<strong>2010</strong> reference period. Dashed and solid l<strong>in</strong>es: SPI = –1.65 and SPI = –2.33, respectively. (B) Spatial distribution of <strong>the</strong> <strong>w<strong>in</strong>ter</strong><br />
North Atlantic Oscillation (NAO)–SPI correlations (1910–<strong>2010</strong>). Black dots: stations with monthly <strong>precipitation</strong> data 1910–<strong>2010</strong><br />
Fig. 2A shows <strong>the</strong> spatial distribution of <strong>the</strong> <strong>precipitation</strong><br />
anomalies correspond<strong>in</strong>g to <strong>the</strong> 4 mo SPI values<br />
<strong>in</strong> March <strong>2010</strong>, after remov<strong>in</strong>g <strong>the</strong> 1910–<strong>2010</strong> climatology.<br />
Large positive anomalies were found on most of<br />
<strong>the</strong> <strong>Iberian</strong> Pen<strong>in</strong>sula, with exceptions of <strong>the</strong> nor<strong>the</strong>rn<br />
and Mediterranean coastlands that show near-normal<br />
or even negative anomalies. In large areas of <strong>the</strong> south,<br />
west and southwest <strong>the</strong> recorded <strong>precipitation</strong> corresponds<br />
to anomalies >2.3, which is equivalent to a<br />
return period of 1 event every 100 yr. Moreover, <strong>in</strong><br />
some locations, <strong>the</strong> obta<strong>in</strong>ed SPI value is >3 (depicted<br />
<strong>in</strong> deep blue colour), correspond<strong>in</strong>g to a return period<br />
of 1 <strong>in</strong> 1000 yr (e.g. Almería, SPI = 3.3; Albacete, SPI =<br />
3.05). Fig. 2B shows <strong>the</strong> spatial distribution of <strong>the</strong><br />
1910–<strong>2010</strong> correlation between <strong>the</strong> <strong>w<strong>in</strong>ter</strong> NAO and<br />
<strong>the</strong> 4 mo SPI <strong>in</strong> March. The pattern shows a clear spatial<br />
gradient (SW–NE), with <strong>the</strong> highest correlations<br />
be<strong>in</strong>g observed on <strong>the</strong> southwest, west and central<br />
<strong>Iberian</strong> Pen<strong>in</strong>sula, whereas non-significant correlations<br />
were found <strong>in</strong> <strong>the</strong> nor<strong>the</strong>rn coastlands and<br />
Mediterranean areas. The pattern of <strong>w<strong>in</strong>ter</strong> <strong>2010</strong> <strong>precipitation</strong><br />
anomalies shows a high resemblance with<br />
<strong>the</strong> general pattern of <strong>w<strong>in</strong>ter</strong> NAO <strong>in</strong>fluence over <strong>the</strong><br />
<strong>Iberian</strong> Pen<strong>in</strong>sula (Trigo et al. 2002). Thus, <strong>the</strong> correlation<br />
between both spatial configurations is strong and<br />
statistically significant (R = –0.56, p < 0.01). It must be<br />
emphasised that it is ra<strong>the</strong>r difficult to f<strong>in</strong>d a pattern of<br />
SPI anomalies as similar to <strong>the</strong> spatial <strong>in</strong>fluence of <strong>the</strong><br />
NAO obta<strong>in</strong>ed <strong>in</strong> <strong>2010</strong>. Fig. 3 shows <strong>the</strong> SPI values for<br />
<strong>the</strong> 2 <strong>w<strong>in</strong>ter</strong>s with <strong>the</strong> most negative NAO values prior<br />
Fig. 3. (A) Standardized <strong>precipitation</strong> <strong>in</strong>dex (SPI) for <strong>the</strong> <strong>w<strong>in</strong>ter</strong> 1969, (B) SPI for <strong>the</strong> <strong>w<strong>in</strong>ter</strong> 1996, (C) average SPI for negative<br />
NAO <strong>w<strong>in</strong>ter</strong>s (values between 0 and –1) and (D) average SPI for negative NAO <strong>w<strong>in</strong>ter</strong>s (values between –1 and –2). Black dots<br />
as <strong>in</strong> Fig. 2