A Literature Review and Meta Analysis of the Effects of Lockdowns on COVID 19 Mortality

Create successful ePaper yourself
Turn your PDF publications into a flip-book with our unique Google optimized e-Paper software.
were issued 7½ days after both schools <str<strong>on</strong>g>and</str<strong>on</strong>g> workplaces closed, <str<strong>on</strong>g>and</str<strong>on</strong>g> 12 days after <str<strong>on</strong>g>the</str<strong>on</strong>g> first <str<strong>on</strong>g>of</str<strong>on</strong>g> <str<strong>on</strong>g>the</str<strong>on</strong>g><br />
two closed. Only <strong>on</strong>e state, Tennessee, issued a SIPO before schools <str<strong>on</strong>g>and</str<strong>on</strong>g> workplaces closed. The<br />
10 states that did not issue SIPOs all closed schools. Moreover, <str<strong>on</strong>g>of</str<strong>on</strong>g> those 10 states, three closed<br />
some n<strong>on</strong>-essential businesses, while <str<strong>on</strong>g>the</str<strong>on</strong>g> remaining 7 closed all n<strong>on</strong>-essential businesses.<br />
Because <str<strong>on</strong>g>of</str<strong>on</strong>g> this, we perceive estimates for SIPOs based <strong>on</strong> U.S.-data as <str<strong>on</strong>g>the</str<strong>on</strong>g> marginal effect <str<strong>on</strong>g>of</str<strong>on</strong>g><br />
SIPOs <strong>on</strong> top <str<strong>on</strong>g>of</str<strong>on</strong>g> o<str<strong>on</strong>g>the</str<strong>on</strong>g>r restricti<strong>on</strong>s, although we acknowledge that <str<strong>on</strong>g>the</str<strong>on</strong>g> estimates may capture <str<strong>on</strong>g>the</str<strong>on</strong>g><br />
effects <str<strong>on</strong>g>of</str<strong>on</strong>g> o<str<strong>on</strong>g>the</str<strong>on</strong>g>r NPI measures as well.<br />
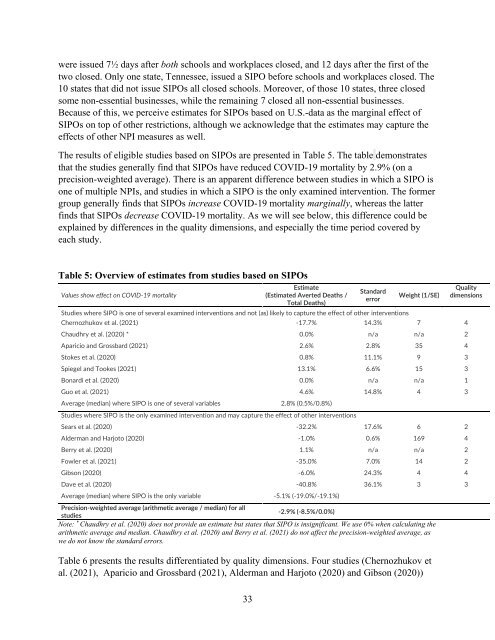
The results <str<strong>on</strong>g>of</str<strong>on</strong>g> eligible studies based <strong>on</strong> SIPOs are presented in Table 5. The table dem<strong>on</strong>strates<br />
that <str<strong>on</strong>g>the</str<strong>on</strong>g> studies generally find that SIPOs have reduced <strong>COVID</strong>-<strong>19</strong> mortality by 2.9% (<strong>on</strong> a<br />
precisi<strong>on</strong>-weighted average). There is an apparent difference between studies in which a SIPO is<br />
<strong>on</strong>e <str<strong>on</strong>g>of</str<strong>on</strong>g> multiple NPIs, <str<strong>on</strong>g>and</str<strong>on</strong>g> studies in which a SIPO is <str<strong>on</strong>g>the</str<strong>on</strong>g> <strong>on</strong>ly examined interventi<strong>on</strong>. The former<br />
group generally finds that SIPOs increase <strong>COVID</strong>-<strong>19</strong> mortality marginally, whereas <str<strong>on</strong>g>the</str<strong>on</strong>g> latter<br />
finds that SIPOs decrease <strong>COVID</strong>-<strong>19</strong> mortality. As we will see below, this difference could be<br />
explained by differences in <str<strong>on</strong>g>the</str<strong>on</strong>g> quality dimensi<strong>on</strong>s, <str<strong>on</strong>g>and</str<strong>on</strong>g> especially <str<strong>on</strong>g>the</str<strong>on</strong>g> time period covered by<br />
each study.<br />
Table 5: Overview <str<strong>on</strong>g>of</str<strong>on</strong>g> estimates from studies based <strong>on</strong> SIPOs<br />
Values show effect <strong>on</strong> <strong>COVID</strong>-<strong>19</strong> mortality<br />
33<br />
Estimate<br />
(Estimated Averted Deaths /<br />
Total Deaths)<br />
St<str<strong>on</strong>g>and</str<strong>on</strong>g>ard<br />
error<br />
Studies where SIPO is <strong>on</strong>e <str<strong>on</strong>g>of</str<strong>on</strong>g> several examined interventi<strong>on</strong>s <str<strong>on</strong>g>and</str<strong>on</strong>g> not (as) likely to capture <str<strong>on</strong>g>the</str<strong>on</strong>g> effect <str<strong>on</strong>g>of</str<strong>on</strong>g> o<str<strong>on</strong>g>the</str<strong>on</strong>g>r interventi<strong>on</strong>s<br />
Weight (1/SE)<br />
Chernozhukov et al. (2021) -17.7% 14.3% 7 4<br />
Chaudhry et al. (2020) * 0.0% n/a n/a 2<br />
Aparicio <str<strong>on</strong>g>and</str<strong>on</strong>g> Grossbard (2021) 2.6% 2.8% 35 4<br />
Stokes et al. (2020) 0.8% 11.1% 9 3<br />
Spiegel <str<strong>on</strong>g>and</str<strong>on</strong>g> Tookes (2021) 13.1% 6.6% 15 3<br />
B<strong>on</strong>ardi et al. (2020) 0.0% n/a n/a 1<br />
Guo et al. (2021) 4.6% 14.8% 4 3<br />
Average (median) where SIPO is <strong>on</strong>e <str<strong>on</strong>g>of</str<strong>on</strong>g> several variables 2.8% (0.5%/0.8%)<br />
Studies where SIPO is <str<strong>on</strong>g>the</str<strong>on</strong>g> <strong>on</strong>ly examined interventi<strong>on</strong> <str<strong>on</strong>g>and</str<strong>on</strong>g> may capture <str<strong>on</strong>g>the</str<strong>on</strong>g> effect <str<strong>on</strong>g>of</str<strong>on</strong>g> o<str<strong>on</strong>g>the</str<strong>on</strong>g>r interventi<strong>on</strong>s<br />
Sears et al. (2020) -32.2% 17.6% 6 2<br />
Alderman <str<strong>on</strong>g>and</str<strong>on</strong>g> Harjoto (2020) -1.0% 0.6% 169 4<br />
Berry et al. (2020) 1.1% n/a n/a 2<br />
Fowler et al. (2021) -35.0% 7.0% 14 2<br />
Gibs<strong>on</strong> (2020) -6.0% 24.3% 4 4<br />
Dave et al. (2020) -40.8% 36.1% 3 3<br />
Average (median) where SIPO is <str<strong>on</strong>g>the</str<strong>on</strong>g> <strong>on</strong>ly variable -5.1% (-<strong>19</strong>.0%/-<strong>19</strong>.1%)<br />
Precisi<strong>on</strong>-weighted average (arithmetic average / median) for all<br />
-2.9% (-8.5%/0.0%)<br />
studies<br />
Note: * Chaudhry et al. (2020) does not provide an estimate but states that SIPO is insignificant. We use 0% when calculating <str<strong>on</strong>g>the</str<strong>on</strong>g><br />
arithmetic average <str<strong>on</strong>g>and</str<strong>on</strong>g> median. Chaudhry et al. (2020) <str<strong>on</strong>g>and</str<strong>on</strong>g> Berry et al. (2021) do not affect <str<strong>on</strong>g>the</str<strong>on</strong>g> precisi<strong>on</strong>-weighted average, as<br />
we do not know <str<strong>on</strong>g>the</str<strong>on</strong>g> st<str<strong>on</strong>g>and</str<strong>on</strong>g>ard errors.<br />
Table 6 presents <str<strong>on</strong>g>the</str<strong>on</strong>g> results differentiated by quality dimensi<strong>on</strong>s. Four studies (Chernozhukov et<br />
al. (2021), Aparicio <str<strong>on</strong>g>and</str<strong>on</strong>g> Grossbard (2021), Alderman <str<strong>on</strong>g>and</str<strong>on</strong>g> Harjoto (2020) <str<strong>on</strong>g>and</str<strong>on</strong>g> Gibs<strong>on</strong> (2020))<br />
Quality<br />
dimensi<strong>on</strong>s