Eawag Annual Report 2022
As the aquatic research institute of the ETH Domain, our research is in service of society. You can see this for yourself in our Annual Report. The annual compact review highlights the most relevant research results of the past year and shows how they were developed.
As the aquatic research institute of the ETH Domain, our research is in service of society. You can see this for yourself in our Annual Report. The annual compact review highlights the most relevant research results of the past year and shows how they were developed.

You also want an ePaper? Increase the reach of your titles
YUMPU automatically turns print PDFs into web optimized ePapers that Google loves.
INSTITUTION<br />
47<br />
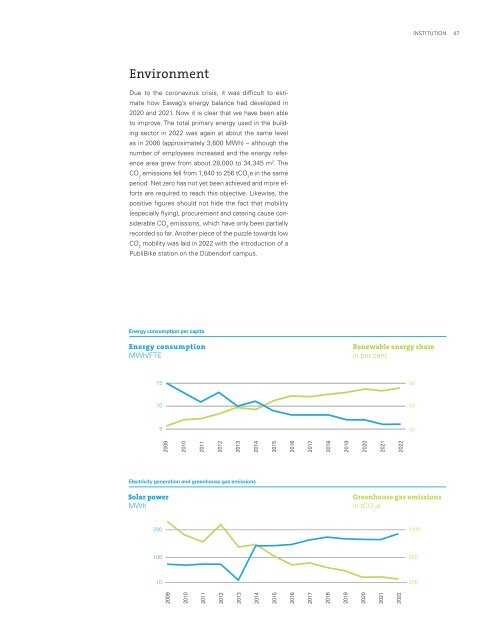
Environment<br />
Due to the coronavirus crisis, it was difficult to estimate<br />
how <strong>Eawag</strong>’s energy balance had developed in<br />
2020 and 2021. Now it is clear that we have been able<br />
to improve. The total primary energy used in the building<br />
sector in <strong>2022</strong> was again at about the same level<br />
as in 2006 (approximately 3,600 MWh) – although the<br />
number of employees increased and the energy reference<br />
area grew from about 28,000 to 34,345 m 2 . The<br />
CO 2<br />
emissions fell from 1,640 to 256 tCO 2<br />
e in the same<br />
period. Net zero has not yet been achieved and more efforts<br />
are required to reach this objective. Likewise, the<br />
positive figures should not hide the fact that mobility<br />
(especially flying), procurement and catering cause considerable<br />
CO 2<br />
emissions, which have only been partially<br />
recorded so far. Another piece of the puzzle towards low<br />
CO 2<br />
mobility was laid in <strong>2022</strong> with the introduction of a<br />
PubliBike station on the Dübendorf campus.<br />
Energy consumption per capita<br />
Energy consumption<br />
MWh/FTE<br />
Renewable energy share<br />
in per cent<br />
15<br />
90<br />
10<br />
60<br />
5<br />
30<br />
2009<br />
2010<br />
2011<br />
2012<br />
2013<br />
2014<br />
2015<br />
2016<br />
Electricity generation and greenhouse gas emissions<br />
Solar power<br />
MWh<br />
Greenhouse gas emissions<br />
in tCO e<br />
2<br />
600<br />
1000<br />
200<br />
2009<br />
2010<br />
2011<br />
2012<br />
2013<br />
2014<br />
2015<br />
2016<br />
2017<br />
2018<br />
2019<br />
2020<br />
2021<br />
<strong>2022</strong><br />
2017<br />
2018<br />
2019<br />
2020<br />
2021<br />
<strong>2022</strong><br />
200<br />
100<br />
10