World Intellectual Property Report 2011
World Intellectual Property Report 2011
World Intellectual Property Report 2011

Create successful ePaper yourself
Turn your PDF publications into a flip-book with our unique Google optimized e-Paper software.
Chapter 1 the Changing faCe of innovation and intelleCtual property<br />
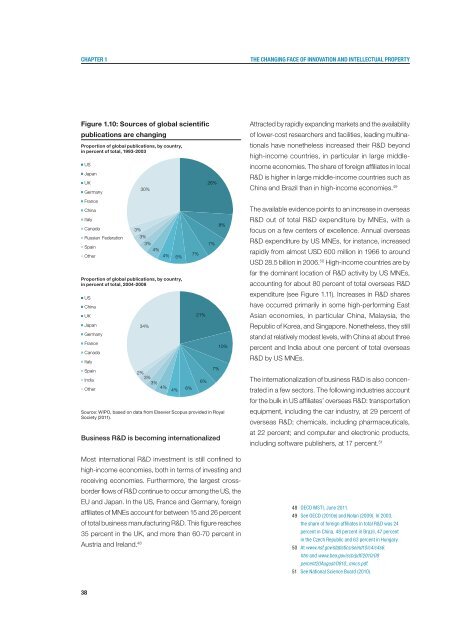
Figure 1.10: Sources of global scientific<br />
publications are changing<br />
Proportion of global publications, by country,<br />
in percent of total, 1993-2003<br />
US<br />
Japan<br />
UK<br />
Germany<br />
France<br />
China<br />
Italy<br />
Canada<br />
Russian Federation<br />
Spain<br />
Other<br />
Proportion of global publications, by country,<br />
in percent of total, 2004-2008<br />
US<br />
China<br />
UK<br />
Japan<br />
Germany<br />
France<br />
Canada<br />
Italy<br />
Spain<br />
India<br />
Other<br />
Source: WIPO, based on data from Elsevier Scopus provided in Royal<br />
Society (<strong>2011</strong>).<br />
Business R&D is becoming internationalized<br />
Most international R&D investment is still confined to<br />
high-income economies, both in terms of investing and<br />
receiving economies. Furthermore, the largest crossborder<br />
flows of R&D continue to occur among the US, the<br />
EU and Japan. In the US, France and Germany, foreign<br />
affiliates of MNEs account for between 15 and 26 percent<br />
of total business manufacturing R&D. This figure reaches<br />
35 percent in the UK, and more than 60-70 percent in<br />
Austria and Ireland. 48<br />
38<br />
30%<br />
3%<br />
3%<br />
3%<br />
4%<br />
34%<br />
2%<br />
3%<br />
3%<br />
4%<br />
4%<br />
4%<br />
5%<br />
6%<br />
7%<br />
21%<br />
6%<br />
26%<br />
7%<br />
7%<br />
8%<br />
10%<br />
Attracted by rapidly expanding markets and the availability<br />
of lower-cost researchers and facilities, leading multinationals<br />
have nonetheless increased their R&D beyond<br />
high-income countries, in particular in large middleincome<br />
economies. The share of foreign affiliates in local<br />
R&D is higher in large middle-income countries such as<br />
China and Brazil than in high-income economies. 49<br />
The available evidence points to an increase in overseas<br />
R&D out of total R&D expenditure by MNEs, with a<br />
focus on a few centers of excellence. Annual overseas<br />
R&D expenditure by US MNEs, for instance, increased<br />
rapidly from almost USD 600 million in 1966 to around<br />
USD 28.5 billion in 2006. 50 High-income countries are by<br />
far the dominant location of R&D activity by US MNEs,<br />
accounting for about 80 percent of total overseas R&D<br />
expenditure (see Figure 1.11). Increases in R&D shares<br />
have occurred primarily in some high-performing East<br />
Asian economies, in particular China, Malaysia, the<br />
Republic of Korea, and Singapore. Nonetheless, they still<br />
stand at relatively modest levels, with China at about three<br />
percent and India about one percent of total overseas<br />
R&D by US MNEs.<br />
The internationalization of business R&D is also concentrated<br />
in a few sectors. The following industries account<br />
for the bulk in US affiliates’ overseas R&D: transportation<br />
equipment, including the car industry, at 29 percent of<br />
overseas R&D; chemicals, including pharmaceuticals,<br />
at 22 percent; and computer and electronic products,<br />
including software publishers, at 17 percent. 51<br />
48 OECD MSTI, June <strong>2011</strong>.<br />
49 See OECD (2010e) and Nolan (2009). In 2003,<br />
the share of foreign affiliates in total R&D was 24<br />
percent in China, 48 percent in Brazil, 47 percent<br />
in the Czech Republic and 63 percent in Hungary.<br />
50 At www.nsf.gov/statistics/seind10/c4/c4s6.<br />
htm and www.bea.gov/scb/pdf/2010/08<br />
percent20August/0810_mncs.pdf.<br />
51 See National Science Board (2010).