Low Cost Dust Monitoring at The British Library - IFLA
Low Cost Dust Monitoring at The British Library - IFLA
Low Cost Dust Monitoring at The British Library - IFLA

You also want an ePaper? Increase the reach of your titles
YUMPU automatically turns print PDFs into web optimized ePapers that Google loves.
A colour-coded system was used to record the four dust c<strong>at</strong>egories<br />
on the fl oor plans as follows:<br />
Scale 0: no colour<br />
Scale 1: yellow<br />
Scale 2: blue<br />
Scale 3: pink<br />
<strong>The</strong> inform<strong>at</strong>ion recorded on the plans would then be transferred<br />
onto spreadsheets refl ecting the ranges and bays <strong>at</strong> a<br />
l<strong>at</strong>er d<strong>at</strong>e.<br />
Although the <strong>British</strong> <strong>Library</strong> oper<strong>at</strong>es <strong>at</strong> a large scale, the principle<br />
of establishing a system of visual assessment and using fl oor<br />
plans to record the loc<strong>at</strong>ion of dust build-up can be applied to<br />
organis<strong>at</strong>ions of all sizes.<br />
Carrying out the dust survey<br />
<strong>The</strong> assessment and recording of dust was carried out by teams<br />
of two people working together. One person carried out the visual<br />
assessment and the other person recorded the inform<strong>at</strong>ion<br />
directly onto the plans using the colour-coding system.<br />
Due to the size of the area being surveyed it was not possible to<br />
look <strong>at</strong> every range of shelves. In each basement compartment,<br />
every 3 rd to 4 th range was checked and the results were applied<br />
to the adjacent ranges. In the reading rooms, the smaller areas<br />
meant th<strong>at</strong> each range could be checked.<br />
Each team collected inform<strong>at</strong>ion on the level of dust <strong>at</strong> four<br />
different shelf heights: on canopies (the highest level above<br />
shelves and books); the top of ranges (the highest book shelf);<br />
mid range (a shelf <strong>at</strong> mid level); and bottom of range (the lowest<br />
shelf).<br />
Collecting d<strong>at</strong>a in this way allowed the team to compare dust<br />
levels in different compartments, see the overall distribution<br />
of dust within a compartment, see the distribution of dust by<br />
height, and identify the areas of heaviest dust deposit.<br />
<strong>The</strong> d<strong>at</strong>a from the fl oorplans was then transferred to spreadsheets<br />
to enable the inform<strong>at</strong>ion to be analysed and edited.<br />
This was best done by the people who had collected the d<strong>at</strong>a,<br />
and soon after the inform<strong>at</strong>ion had been g<strong>at</strong>hered to avoid<br />
misinterpret<strong>at</strong>ion. <strong>The</strong> grid form<strong>at</strong> of the spreadsheet was used<br />
to refl ect the shelf layout and height of shelves, and to separ<strong>at</strong>e<br />
out inform<strong>at</strong>ion about the shelf canopies (Est<strong>at</strong>es responsibility)<br />
from th<strong>at</strong> rel<strong>at</strong>ing to books and shelves (Collection Care<br />
responsibility).<br />
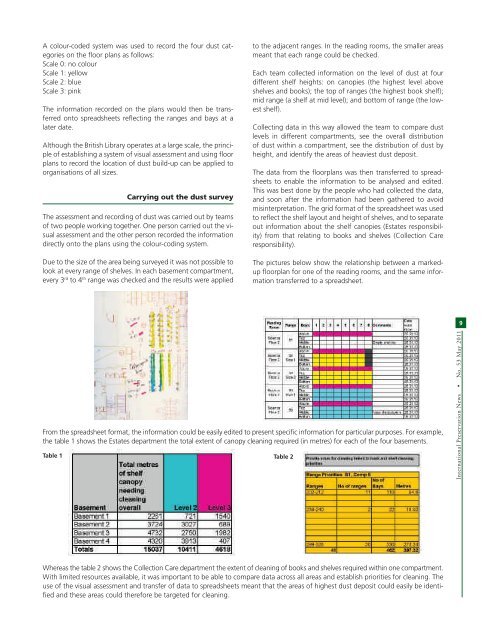
<strong>The</strong> pictures below show the rel<strong>at</strong>ionship between a markedup<br />
fl oorplan for one of the reading rooms, and the same inform<strong>at</strong>ion<br />
transferred to a spreadsheet.<br />
From the spreadsheet form<strong>at</strong>, the inform<strong>at</strong>ion could be easily edited to present specifi c inform<strong>at</strong>ion for particular purposes. For example,<br />
the table 1 shows the Est<strong>at</strong>es department the total extent of canopy cleaning required (in metres) for each of the four basements.<br />
Table 1 Table 2<br />
Whereas the table 2 shows the Collection Care department the extent of cleaning of books and shelves required within one compartment.<br />
With limited resources available, it was important to be able to compare d<strong>at</strong>a across all areas and establish priorities for cleaning. <strong>The</strong><br />
use of the visual assessment and transfer of d<strong>at</strong>a to spreadsheets meant th<strong>at</strong> the areas of highest dust deposit could easily be identifi<br />
ed and these areas could therefore be targeted for cleaning.<br />
9<br />
Intern<strong>at</strong>ional Preserv<strong>at</strong>ion News No. 53 May 2011