Photodegradation and laser desorption mass spectrometry ... - Library
Photodegradation and laser desorption mass spectrometry ... - Library
Photodegradation and laser desorption mass spectrometry ... - Library
Create successful ePaper yourself
Turn your PDF publications into a flip-book with our unique Google optimized e-Paper software.
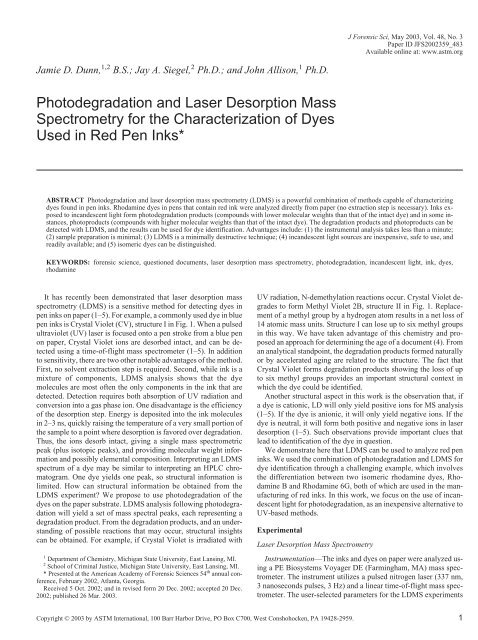
Jamie D. Dunn, 1,2 B.S.; Jay A. Siegel, 2 Ph.D.; <strong>and</strong> John Allison, 1 Ph.D.<br />
<strong>Photodegradation</strong> <strong>and</strong> Laser Desorption Mass<br />
Spectrometry for the Characterization of Dyes<br />
Used in Red Pen Inks*<br />
ABSTRACT <strong>Photodegradation</strong> <strong>and</strong> <strong>laser</strong> <strong>desorption</strong> <strong>mass</strong> <strong>spectrometry</strong> (LDMS) is a powerful combination of methods capable of characterizing<br />
dyes found in pen inks. Rhodamine dyes in pens that contain red ink were analyzed directly from paper (no extraction step is necessary). Inks exposed<br />
to inc<strong>and</strong>escent light form photodegradation products (compounds with lower molecular weights than that of the intact dye) <strong>and</strong> in some instances,<br />
photoproducts (compounds with higher molecular weights than that of the intact dye). The degradation products <strong>and</strong> photoproducts can be<br />
detected with LDMS, <strong>and</strong> the results can be used for dye identification. Advantages include: (1) the instrumental analysis takes less than a minute;<br />
(2) sample preparation is minimal; (3) LDMS is a minimally destructive technique; (4) inc<strong>and</strong>escent light sources are inexpensive, safe to use, <strong>and</strong><br />
readily available; <strong>and</strong> (5) isomeric dyes can be distinguished.<br />
KEYWORDS: forensic science, questioned documents, <strong>laser</strong> <strong>desorption</strong> <strong>mass</strong> <strong>spectrometry</strong>, photodegradation, inc<strong>and</strong>escent light, ink, dyes,<br />
rhodamine<br />
It has recently been demonstrated that <strong>laser</strong> <strong>desorption</strong> <strong>mass</strong><br />
<strong>spectrometry</strong> (LDMS) is a sensitive method for detecting dyes in<br />
pen inks on paper (1–5). For example, a commonly used dye in blue<br />
pen inks is Crystal Violet (CV), structure I in Fig. 1. When a pulsed<br />
ultraviolet (UV) <strong>laser</strong> is focused onto a pen stroke from a blue pen<br />
on paper, Crystal Violet ions are desorbed intact, <strong>and</strong> can be detected<br />
using a time-of-flight <strong>mass</strong> spectrometer (1–5). In addition<br />
to sensitivity, there are two other notable advantages of the method.<br />
First, no solvent extraction step is required. Second, while ink is a<br />
mixture of components, LDMS analysis shows that the dye<br />
molecules are most often the only components in the ink that are<br />
detected. Detection requires both absorption of UV radiation <strong>and</strong><br />
conversion into a gas phase ion. One disadvantage is the efficiency<br />
of the <strong>desorption</strong> step. Energy is deposited into the ink molecules<br />
in 2–3 ns, quickly raising the temperature of a very small portion of<br />
the sample to a point where <strong>desorption</strong> is favored over degradation.<br />
Thus, the ions desorb intact, giving a single <strong>mass</strong> spectrometric<br />
peak (plus isotopic peaks), <strong>and</strong> providing molecular weight information<br />
<strong>and</strong> possibly elemental composition. Interpreting an LDMS<br />
spectrum of a dye may be similar to interpreting an HPLC chromatogram.<br />
One dye yields one peak, so structural information is<br />
limited. How can structural information be obtained from the<br />
LDMS experiment? We propose to use photodegradation of the<br />
dyes on the paper substrate. LDMS analysis following photodegradation<br />
will yield a set of <strong>mass</strong> spectral peaks, each representing a<br />
degradation product. From the degradation products, <strong>and</strong> an underst<strong>and</strong>ing<br />
of possible reactions that may occur, structural insights<br />
can be obtained. For example, if Crystal Violet is irradiated with<br />
1 Department of Chemistry, Michigan State University, East Lansing, MI.<br />
2 School of Criminal Justice, Michigan State University, East Lansing, MI.<br />
* Presented at the American Academy of Forensic Sciences 54 th annual conference,<br />
February 2002, Atlanta, Georgia.<br />
Received 5 Oct. 2002; <strong>and</strong> in revised form 20 Dec. 2002; accepted 20 Dec.<br />
2002; published 26 Mar. 2003.<br />
UV radiation, N-demethylation reactions occur. Crystal Violet degrades<br />
to form Methyl Violet 2B, structure II in Fig. 1. Replacement<br />
of a methyl group by a hydrogen atom results in a net loss of<br />
14 atomic <strong>mass</strong> units. Structure I can lose up to six methyl groups<br />
in this way. We have taken advantage of this chemistry <strong>and</strong> proposed<br />
an approach for determining the age of a document (4). From<br />
an analytical st<strong>and</strong>point, the degradation products formed naturally<br />
or by accelerated aging are related to the structure. The fact that<br />
Crystal Violet forms degradation products showing the loss of up<br />
to six methyl groups provides an important structural context in<br />
which the dye could be identified.<br />
Another structural aspect in this work is the observation that, if<br />
a dye is cationic, LD will only yield positive ions for MS analysis<br />
(1–5). If the dye is anionic, it will only yield negative ions. If the<br />
dye is neutral, it will form both positive <strong>and</strong> negative ions in <strong>laser</strong><br />
<strong>desorption</strong> (1–5). Such observations provide important clues that<br />
lead to identification of the dye in question.<br />
We demonstrate here that LDMS can be used to analyze red pen<br />
inks. We used the combination of photodegradation <strong>and</strong> LDMS for<br />
dye identification through a challenging example, which involves<br />
the differentiation between two isomeric rhodamine dyes, Rhodamine<br />
B <strong>and</strong> Rhodamine 6G, both of which are used in the manufacturing<br />
of red inks. In this work, we focus on the use of inc<strong>and</strong>escent<br />
light for photodegradation, as an inexpensive alternative to<br />
UV-based methods.<br />
Experimental<br />
Laser Desorption Mass Spectrometry<br />
Copyright © 2003 by ASTM International, 100 Barr Harbor Drive, PO Box C700, West Conshohocken, PA 19428-2959.<br />
J Forensic Sci, May 2003, Vol. 48, No. 3<br />
Paper ID JFS2002359_483<br />
Available online at: www.astm.org<br />
Instrumentation—The inks <strong>and</strong> dyes on paper were analyzed using<br />
a PE Biosystems Voyager DE (Farmingham, MA) <strong>mass</strong> spectrometer.<br />
The instrument utilizes a pulsed nitrogen <strong>laser</strong> (337 nm,<br />
3 nanoseconds pulses, 3 Hz) <strong>and</strong> a linear time-of-flight <strong>mass</strong> spectrometer.<br />
The user-selected parameters for the LDMS experiments<br />
1
2 JOURNAL OF FORENSIC SCIENCES<br />
include an accelerating voltage of 20,000 V for detection of positive<br />
ions <strong>and</strong> �15,000 V for detection of negative ions, an intermediate<br />
source grid voltage that is 94% of the accelerating voltage,<br />
a guide wire voltage that is opposite in bias, <strong>and</strong> 0.05% in magnitude<br />
of the accelerating voltage, <strong>and</strong> an extraction delay time of 100<br />
ns. Details of the experiment have been reported previously (1).<br />
The calibrant used for positive <strong>and</strong> negative ion analysis was cesium<br />
iodide (CsI) (99.9%; Aldrich, Milwaukee, WI).<br />
Analysis of Ink on Paper—Single written lines on MSU letterhead<br />
paper were analyzed directly. The nitrogen <strong>laser</strong> spot can be<br />
focused onto a portion of a pen stroke approximately 0.3–0.4 mm<br />
wide. The currently available red ballpoint pen inks used here were<br />
BIC Round Stic ® <strong>and</strong> BIC Cristal ® . The sources of the naturally<br />
aged inks are unknown. Inc<strong>and</strong>escent light-induced degradation<br />
was performed using a 75 W, 120 V light bulb. A distance of 9 cm<br />
between the sample <strong>and</strong> the light source was maintained.<br />
Analysis of Dyes on Paper—To parallel the analysis of the inks<br />
on paper, aqueous dye solutions were prepared, spotted on paper,<br />
<strong>and</strong> allowed to dry for subsequent LDMS analysis. The dyes used in<br />
this work are Rhodamine B (Sigma, St. Louis, MO), Rhodamine 6G<br />
(Aldrich, Milwaukee, WI), Rhodamine 123 hydrate (Aldrich, Milwaukee,<br />
WI), <strong>and</strong> New Fuchsin (Aldrich, Milwaukee, WI). Inc<strong>and</strong>escent<br />
degradation was performed using a 75 W, 120 V light bulb.<br />
Thin-Layer Chromatography—TLC was carried out using silica<br />
gel 150 Å TLC plates (Whatman, Ann Arbor, MI) with dimensions<br />
FIG. 1—Dye structures.<br />
FIG. 2—Positive ion LD <strong>mass</strong> spectrum of a red ink used to grade a<br />
biology exam from 1967.<br />
of 5 � 10 cm <strong>and</strong> a stationary phase thickness of 250 �m. The solvent<br />
system consisted of ethyl acetate:ethanol:water (70:35:30).<br />
Results <strong>and</strong> Discussion<br />
<strong>Photodegradation</strong> <strong>and</strong> LDMS Analysis of a Red Pen Ink Used to<br />
Grade a Biology Exam in 1967<br />
Frequently, teachers use pens with red ink to grade exams. Figure<br />
2 shows the positive ion LD <strong>mass</strong> spectrum of red ink from a<br />
1967 high school biology exam. The ink was analyzed directly
from the paper using LDMS. The positive ion spectrum contains<br />
several peaks. Based on our experiences to date, we would begin an<br />
analysis by assuming that the most intense peak, at m/z 443, is representative<br />
of an intact dye, <strong>and</strong> the lower m/z, less intense <strong>mass</strong><br />
spectral peaks represent the natural degradation products of the dye<br />
(1–5). From this <strong>mass</strong> spectrum, we were able to detect a mixture<br />
of at least six components. Each peak represents a component desorbed<br />
intact by the pulsed UV radiation. In LDMS, if a dye is neutral,<br />
then the dye would be detected in both positive <strong>and</strong> negative<br />
ion modes. Most often, a neutral dye (M) gains a positive charge by<br />
protonation, to form (M�H) � , allowing the dye to be detected in<br />
positive ion LDMS, <strong>and</strong> obtains a negative charge by deprotonation,<br />
forming (M�H) � (1–5). Negative ion LDMS was also used<br />
to analyze this red ink. The resulting spectrum did not contain any<br />
peaks that would signify the presence of a dye that carried a negative<br />
charge. The absence of a peak at m/z 441 in negative ion mode<br />
lead to the conclusion that the dye present in this ink, represented<br />
by the peak at m/z 443, is a cationic dye.<br />
According to US Patent 5,993,098 (6), two rhodamine dyes,<br />
Rhodamine B <strong>and</strong> Rhodamine 6G, can both be used to manufacture<br />
red pen ink. The Sigma-Aldrich H<strong>and</strong>book of Stains, Dyes, <strong>and</strong> Indicators<br />
(7) reveals that the two rhodamine dyes are isomeric,<br />
cationic dyes (structures III <strong>and</strong> IV), <strong>and</strong> have a molecular <strong>mass</strong> of<br />
443 Daltons (Da).<br />
Rhodamine dyes have been used in a variety of systems from<br />
<strong>laser</strong>s to pens containing red ink. The family of rhodamine dyes has<br />
been produced by BASF since 1887 (8). The two possible dye c<strong>and</strong>idates,<br />
Rhodamine 6G <strong>and</strong> Rhodamine B, could be represented by<br />
the peak at m/z 443 in the positive ion <strong>mass</strong> spectrum in Fig. 2. The<br />
dyes contain unique functional groups that distinguish them <strong>and</strong><br />
will be most relevant to this work. Rhodamine B (III) contains a<br />
carboxylic acid group where Rhodamine 6G, (IV), contains an ester<br />
group. Also, Rhodamine B contains four ethyl groups, two attached<br />
to each nitrogen atom, while Rhodamine 6G contains two<br />
ethyl groups, one attached to each nitrogen atom. We will determine<br />
which of these two rhodamine dyes was the dye in the pen ink<br />
that was used to grade the biology exam in order to demonstrate the<br />
use of the photodegradation/LDMS approach. Since LDMS of<br />
each would presumably yield only a single peak in the spectrum at<br />
m/z 443, LDMS does not provide sufficient structural information<br />
about the dyes to determine which dye is present in the ink. Inc<strong>and</strong>escent<br />
radiation can be used to induce dye degradation. The photodegradation<br />
products can be analyzed using LDMS to provide<br />
structural clues to aid in the identification of the dye.<br />
LDMS Analysis of Some Red Ballpoint Pen Inks Currently<br />
Available<br />
Several kinds of red ballpoint pens currently available were analyzed<br />
to further investigate the unknown red dye that was represented<br />
by the peak at m/z 443 in Fig. 2. Two specific patterns<br />
emerged as a result of analyzing <strong>and</strong> comparing the LD <strong>mass</strong> spectra<br />
of these red pen inks. Figure 3a shows a positive ion LDMS spectrum<br />
of red ink from a BIC Round Stic ® ballpoint pen <strong>and</strong> represents<br />
the majority of the red ink samples from our small set, while Fig. 4a<br />
represents the smaller population of the red ink pens. Figure 4a is a<br />
positive LDMS spectrum of red ink from a BIC Cristal ® ballpoint<br />
pen. LDMS analysis of the smaller population of the red ink pens<br />
generated <strong>mass</strong> spectra that contained predominantly one peak at<br />
m/z 443. Most of the red inks, upon positive ion LDMS examination,<br />
yielded <strong>mass</strong> spectra with two distinct peaks at m/z 443 <strong>and</strong><br />
399. These two peaks have a <strong>mass</strong> difference of 44 Da <strong>and</strong> could signify<br />
a mixture of dyes, or the peak at m/z 399 could represent a com-<br />
DUNN ETAL. • LDMS ANALYSIS OF PEN INK 3<br />
FIG. 3—Analysis of red ballpoint pen inks currently available: positive<br />
ion LD <strong>mass</strong> spectra of BIC ® Round Stic pen: (a) with no exposure to inc<strong>and</strong>escent<br />
light <strong>and</strong> (b) exposed to inc<strong>and</strong>escent light for 24 h.<br />
FIG. 4—Analysis of red ballpoint pen inks currently available: positive<br />
ion LD <strong>mass</strong> spectra from BIC ® Cristal pen: (a) with no exposure to inc<strong>and</strong>escent<br />
light <strong>and</strong> (b) exposed to inc<strong>and</strong>escent light for 24 h.<br />
ponent in the pen ink that is not a colorant. Usually, only the dyes<br />
from the pen ink are detected with LDMS. <strong>Photodegradation</strong> was<br />
evaluated as a tool for dye structure determination <strong>and</strong> the results<br />
are presented here. Grim et al. (1) discussed UV photodegradation<br />
of Methyl Violet 2B as an approach for accelerated aging. This<br />
method is effective for rhodamine dyes as well. Alternative sources<br />
of photons for dye degradation were evaluated. Inc<strong>and</strong>escent <strong>and</strong><br />
fluorescent lights can also be used to induce the degradation of dyes.<br />
These two approaches have several advantages over UV irradiation.<br />
These light sources are inexpensive, safer to use, <strong>and</strong> readily available.<br />
The results presented here focus on the use of inc<strong>and</strong>escent<br />
light as the source for inducing degradation.<br />
Inc<strong>and</strong>escent Irradiation as a Tool for Dye Characterization<br />
The red pen ink samples were irradiated with inc<strong>and</strong>escent light<br />
using a 75 W light bulb. Figures 3b <strong>and</strong> 4b show the positive LD<br />
<strong>mass</strong> spectra of the two representative red ballpoint pen inks, after<br />
24 h of exposure to inc<strong>and</strong>escent irradiation. There are some no-
4 JOURNAL OF FORENSIC SCIENCES<br />
table differences between the two spectra. The spectrum in Fig. 3b<br />
contains peaks at m/z 415, 387, 359, <strong>and</strong> 331, which are all photochemical<br />
degradation products from the initial dye, m/z 443. From<br />
m/z 443 to m/z 331, pairs of <strong>mass</strong> spectral peaks are separated by<br />
a <strong>mass</strong> difference of 28 Da, for a total of four losses of 28 <strong>mass</strong><br />
units. Also, the series of peaks m/z 399 → 371 → 343 show <strong>mass</strong><br />
differences of 28 Da. The spectrum in Fig. 4b also shows the sequential<br />
loss of 28 <strong>mass</strong> units from the intact dye, but there are only<br />
two losses of 28 <strong>mass</strong> units.<br />
The rhodamine dyes are similar to Crystal Violet in that they are<br />
cationic dyes that contain alkylated amino groups. The degradation<br />
process for the rhodamine dyes should be similar to that of CV<br />
degradation, <strong>and</strong> should occur by oxidative N-deethylation. Oxidative<br />
N-deethylation results in substitution of ethyl groups (�29) by<br />
hydrogen atoms (�1). Rhodamine B has four possible ethyl groups<br />
that all can be replaced by hydrogen atoms which would lead to<br />
four degradation products, separated by <strong>mass</strong> differences of 28 Da.<br />
Rhodamine 6G only possesses two ethyl groups that can be lost.<br />
Thus, degradation products suggest that some red pen inks contain<br />
Rhodamine B <strong>and</strong> some contain Rhodamine 6G.<br />
Analysis of Pure Rhodamine Dyes on Paper<br />
Analyzing pure dyes will help to establish the identity of unknown<br />
dyes, can be used to establish the degradation characteristics of the<br />
dye directly, <strong>and</strong> can provide insight into the mechanism responsible<br />
for photodegradation. <strong>Photodegradation</strong> <strong>and</strong> LDMS analyses were<br />
carried out to examine the degradation of two pure rhodamine dyes<br />
directly, to confirm that the rhodamine dyes actually undergo Ndeethylation<br />
as proposed. Aqueous solutions of Rhodamine B <strong>and</strong><br />
Rhodamine 6G were prepared with pure rhodamine dyes, spotted on<br />
letterhead paper, allowed to dry, <strong>and</strong> were analyzed by LDMS before<br />
exposure to inc<strong>and</strong>escent light. The samples were then subjected to<br />
12 h of inc<strong>and</strong>escent light, <strong>and</strong> again analyzed by LDMS. The positive<br />
ion spectra in Figs. 5a <strong>and</strong> 5b are from the analysis of Rhodamine<br />
B before <strong>and</strong> after exposure to inc<strong>and</strong>escent radiation, respectively.<br />
FIG. 5—Analysis of pure rhodamine dyes: positive ion LD <strong>mass</strong> spectra<br />
of Rhodamine B (a) with no exposure to inc<strong>and</strong>escent light <strong>and</strong> (b) exposed<br />
to inc<strong>and</strong>escent light for 12 h.<br />
FIG. 6—Analysis of pure rhodamine dyes: positive ion LD <strong>mass</strong> spectra<br />
of Rhodamine 6G (a) with no exposure to inc<strong>and</strong>escent light <strong>and</strong> (b) exposed<br />
to inc<strong>and</strong>escent light for 12 h.<br />
These spectra contain the same peaks that were present in the spectra<br />
of the red ink from the BIC Round Stic ® pen. Figures 6a <strong>and</strong> 6b<br />
are LDMS spectra obtained from analyzing pure Rhodamine 6G.<br />
The spectra in these figures contain the same peaks that were present<br />
in the spectra of the red ink from the BIC Cristal ® pen. The appearance<br />
of the characteristic peaks in the LDMS <strong>mass</strong> spectra for the<br />
rhodamine dyes suggests that the red ink from the BIC Round Stic ®<br />
pen contains Rhodamine B, the red ink from the BIC Cristal ® pen<br />
contains Rhodamine 6G, <strong>and</strong> the pen used to grade the biology exam<br />
in 1967 contained Rhodamine B. Further degradation induced by inc<strong>and</strong>escent<br />
light of the 1967 red ink sample confirmed the presence<br />
of Rhodamine B (spectra not shown). Light-induced dye degradation<br />
combined with LDMS provides structural information that can be<br />
used to characterize <strong>and</strong> identify the suspected dyes.<br />
The LDMS spectra of the two rhodamine dyes are different in<br />
that the spectrum of Rhodamine B consistently includes a small<br />
peak at m/z 399. We believe this peak represents a decarbonylated<br />
form of Rhodamine B (RB-CO2) � . The difference between the intact<br />
dye <strong>and</strong> this species is 44 Da, which corresponds to carbon<br />
dioxide. Rhodamine B, an acid, may decarbonylate while the analogous<br />
impurity would not be expected in Rhodamine 6G, which<br />
does not contain a free acid group. The compound corresponding<br />
to m/z 399 does not form negative ions in LDMS, so it is a cationic<br />
dye. It undergoes photochemical N-deethylation, just as the rhodamine<br />
dyes do, reflecting a similar structure. In this context it is<br />
interesting to note that while Rhodamine 6G is commercially available<br />
(Aldrich) at a purity of 99%, Rhodamine B (Sigma) is available<br />
at a purity of 95%. This is consistent with an impurity being<br />
present, <strong>and</strong> the impurity being (RB-CO2) � . Thus, the LDMS spectra<br />
of a red dye found in a pen can immediately suggest that the dye<br />
is Rhodamine B, if the impurity peak at m/z 399 is present. <strong>Photodegradation</strong><br />
can then be used to confirm the dye structure.<br />
Investigating Other Photoproducts of Rhodamine 6G<br />
In our experiences to date, dyes can be photodegraded into<br />
smaller molecules using UV <strong>and</strong> visible light. Rhodamine 6G is the
first dye that we have encountered that also forms higher <strong>mass</strong><br />
molecules photochemically. Specifically, Fig. 6b shows a peak at<br />
m/z 457, representing a photoproduct that is 14 amu higher than the<br />
intact dye peak. Peaks higher in <strong>mass</strong> are not photochemically<br />
formed from Rhodamine B, as seen in the spectrum in Fig. 5b. To<br />
investigate this, two additional dyes were selected, Rhodamine 123<br />
(V) <strong>and</strong> New Fuchsin (VI). Figure 7 shows the LDMS spectra of<br />
FIG. 7—LDMS analysis of Rhodamine 123: (a) with no exposure to inc<strong>and</strong>escent<br />
light <strong>and</strong> (b) exposed to inc<strong>and</strong>escent light for 133 h.<br />
FIG. 8—LDMS analysis of New Fuschin: (a) with no exposure to inc<strong>and</strong>escent<br />
light <strong>and</strong> (b) exposed to inc<strong>and</strong>escent light for 211 h.<br />
Rhodamine 123, before <strong>and</strong> after exposure to inc<strong>and</strong>escent light.<br />
The peak at m/z 345 corresponds to the intact dye cation. Exposure<br />
for 133 h did not lead to any photoproducts for this small rhodamine<br />
dye. Figure 8 shows that New Fuchsin also forms both expected<br />
photodegradation products <strong>and</strong> higher <strong>mass</strong> photoproducts<br />
(following exposure to inc<strong>and</strong>escent radiation for 211 h), as did<br />
Rhodamine 6G. In contrast to Rhodamine 6G, New Fuchsin<br />
formed several photoproducts, including two representing increases<br />
in <strong>mass</strong> of the intact dye by 14 <strong>mass</strong> units (m/z 344, 358).<br />
The structural features that Rhodamine 6G <strong>and</strong> New Fuchsin share<br />
are methyl groups, ortho to the amine functionalities, on the aromatic<br />
rings. In addition, they have less than a full complement of<br />
alkyl groups on the nitrogen atoms. Since the formation of higher<br />
<strong>mass</strong> photoproducts occurs for just these dyes alone on paper, one<br />
need not consider other components of the ink as possible reactants.<br />
While these insights alone do not establish a mechanism, bimolecular<br />
disproportionation reactions of dye molecules, such as<br />
that shown in Fig. 9, may contribute to the observed photoproducts.<br />
Ink Batch-to-Batch Dye Variation<br />
FIG. 9—Suggested mechanism for the formation of photoproducts.<br />
DUNN ETAL. • LDMS ANALYSIS OF PEN INK 5<br />
From the data presented one might assume that BIC Round Stic ®<br />
red pens contain Rhodamine B <strong>and</strong> BIC Cristal ® red pens contain<br />
Rhodamine 6G. This however, is not the case, since it appears that<br />
ink in pens of the same type from different batches have different<br />
composition. Six BIC Round Stic ® pens were collected from different<br />
sources, <strong>and</strong> the dyes in the inks of each pen were examined<br />
by LDMS. There are distinct differences in the LDMS spectra that<br />
differentiate among batches of pen inks of the same br<strong>and</strong>. The<br />
spectra of the six pen inks could be generally classified into three<br />
categories. Figures 10a, 10b, <strong>and</strong> 10c show positive LDMS spectra<br />
of three BIC Round Stic ® ballpoint pens 1, 2, <strong>and</strong> 3. The spectra<br />
show variations in ink dyes used in their manufacture. The peaks in<br />
the <strong>mass</strong> spectra of red ink dyes represent Rhodamine B <strong>and</strong> Rhodamine<br />
6G, but there appears to be an additional dye, which is used<br />
in combination with Rhodamine B. The unknown additional dye<br />
will be referred to as Dye 533. Thin-layer chromatography (TLC)<br />
was used to identify the color of the additional dye. Ink dye separation<br />
by TLC yielded two b<strong>and</strong>s, one b<strong>and</strong> colored red <strong>and</strong> the<br />
other b<strong>and</strong> colored yellow. The red TLC b<strong>and</strong> corresponds to Rhodamine<br />
B <strong>and</strong> the yellow b<strong>and</strong> corresponds to Dye 533. The yellow<br />
b<strong>and</strong> was extracted, spotted on letterhead paper, <strong>and</strong> analyzed. The<br />
relative intensity of the peak at m/z 533 compared with the Rhodamine<br />
B peak varies between the pen inks as well. The <strong>mass</strong> spectrum<br />
in Fig. 10a shows that pen 1 contains predominantly Rhodamine<br />
B <strong>and</strong> a very small amount of Dye 533 compared with<br />
Rhodamine B. Figure 10b shows the <strong>mass</strong> spectrum of ink from<br />
pen 2 which consists of approximately 54% RB, 13% of the impurity<br />
RB-CO2, <strong>and</strong> 33% Dye 533 (assuming an equal LDMS response<br />
for each dye). Dye 533 appears to be a yellow, cationic dye
6 JOURNAL OF FORENSIC SCIENCES<br />
FIG. 10—LDMS analysis of variations in ink dye composition in BIC ®<br />
Round Stic red ballpoint pen ink: (a) pen 1, (b) pen 2, <strong>and</strong> (c) pen 3.<br />
with a <strong>mass</strong> of 533 Da, which contains ethylated nitrogen atoms.<br />
<strong>Photodegradation</strong> of the dye on paper was separately carried out<br />
using inc<strong>and</strong>escent <strong>and</strong> UV radiation. The radiation caused the dye<br />
to N-deethylate a maximum of four times since four degradation<br />
peaks appeared, each separated by 28 <strong>mass</strong> units. Induced degradation<br />
of pure Rhodamine B does not produce a photoproduct with<br />
a <strong>mass</strong> of 533 Da; however, the peak at m/z 533 cannot be completely<br />
eliminated as a photoproduct from Rhodamine B, since ink<br />
is a complex system. Ink contains other components that could react<br />
with Rhodamine B in pen ink to from a product with a <strong>mass</strong> of<br />
533 Da when photodegraded, if all dyes can be desorbed <strong>and</strong> ionized<br />
with equal efficiency. Additional analysis is required; the purpose<br />
of this work is not to evaluate yellow dyes, but to point out<br />
that there are other dye components in red ink that can be detected<br />
by LDMS.<br />
Conclusion<br />
LDMS is a versatile <strong>and</strong> sensitive tool for detecting dyes in a variety<br />
of inks. LDMS spectra alone may not provide sufficient in-<br />
formation for dye identification. Dyes can be photodegraded directly<br />
on paper using inc<strong>and</strong>escent light, <strong>and</strong> the photoproducts can<br />
be analyzed by LDMS, providing structural information. While<br />
Rhodamine 6G <strong>and</strong> Rhodamine B are isomers, the photodegradation/LDMS<br />
combination can be used to distinguish between the<br />
two dyes. The structural differences between the isomers allow different<br />
photodegradation products <strong>and</strong> photoproducts to be formed<br />
<strong>and</strong> detected.<br />
Batch-to-batch variations are found in the dyes used in red pens<br />
of a single type from a single manufacturer. From the st<strong>and</strong>point of<br />
addressing questions such as “Could this writing have come from<br />
this pen?” this is certainly a preferable situation increasing the<br />
probability of implicating a particular pen.<br />
The chemistry of dye photodegradation remains to be defined,<br />
especially for ink on paper. The degradation of ink on paper is a<br />
complex system that may involve reactions with paper components<br />
or environmental gases such as water. Our work continues to develop<br />
the photochemistry/LDMS approach for identifying dyes<br />
used in inks, <strong>and</strong> to further define the relationship between photoproducts<br />
<strong>and</strong> dye structure.<br />
References<br />
1. Grim DM, Siegel JA, Allison J. Evaluation of <strong>laser</strong> <strong>desorption</strong> <strong>mass</strong> <strong>spectrometry</strong><br />
<strong>and</strong> UV accelerated aging of dyes on paper as tools for the evaluation<br />
of a questioned document. J Forensic Sci 2002;47(6):1265–73.<br />
2. Grim DM, Siegel JA, Allison J. Evaluation of <strong>desorption</strong>/ionization <strong>mass</strong><br />
spectrometric methods in the forensic applications of the analysis of inks<br />
on paper. J Forensic Sci 2001;46(6):1411–20.<br />
3. Grim DM, Siegel JA, Allison J. Does ink age inside of a pen cartridge? J<br />
Forensic Sci 2002;47(6):1294–7.<br />
4. Grim DM, Dunn JD, Allison J, Siegel JA. Characterizing the degradation<br />
of methyl violet from inks on paper using <strong>laser</strong> <strong>desorption</strong> <strong>mass</strong> <strong>spectrometry</strong><br />
for the analysis of questioned documents. American Academy of<br />
Forensic Sciences 54th Annual Conference; 2002 Feb; Atlanta (GA).<br />
5. Dunn JD, Grim DM, Allison J, Siegel JA. Molecular level information on<br />
the aging of dyes from ink on paper: what’s there <strong>and</strong> how does it change?<br />
American Academy of Forensic Sciences 54th Annual Conference; 2002<br />
Feb; Atlanta (GA).<br />
6. Osada T, inventors. Mitsubishi Pencil Kabushiki Kaisha, assignee. Aqueous<br />
gel ink-filled ballpoint pen. US Patent 5,993,098 Nov 1999.<br />
7. Green FJ. The Sigma-Aldrich h<strong>and</strong>book of stains, dyes, <strong>and</strong> indicators.<br />
Milwaukee: Aldrich Chemical Company, 1990.<br />
8. Ball P. Bright earth: art <strong>and</strong> the invention of color. New York: Farrar,<br />
Straus <strong>and</strong> Giroux, 2001.<br />
Additional information <strong>and</strong> reprint requests:<br />
John Allison<br />
335 Chemistry Building<br />
Michigan State University<br />
East Lansing, MI 48824-1322<br />
E-mail: allison@cem.msu.edu


