Sucrose (JrSUT1) and hexose (JrHT1 and JrHT2 ... - Tree Physiology
Sucrose (JrSUT1) and hexose (JrHT1 and JrHT2 ... - Tree Physiology
Sucrose (JrSUT1) and hexose (JrHT1 and JrHT2 ... - Tree Physiology

Create successful ePaper yourself
Turn your PDF publications into a flip-book with our unique Google optimized e-Paper software.
218 DECOURTEIX ET AL.<br />
Fifteen-µm sections were rinsed in PBS (pH 7.2) <strong>and</strong> bathed<br />
for 15 min in PBS containing 0.1% (v/v) Triton X-100 <strong>and</strong><br />
0.2% (w/v) glycine (pH 7.2). After saturation of nonspecific<br />
sites, sections were incubated overnight with either 1/100 diluted<br />
antibody against <strong>JrSUT1</strong>, 1/5 diluted antibody against<br />
<strong>JrHT1</strong> <strong>and</strong> <strong>JrHT2</strong> or the same antibodies saturated with the<br />
KLH-coupled synthetic peptide. After washing, sections were<br />
incubated for 3 h with goat anti-rabbit antibodies conjugated<br />
to alkaline phosphatase (Sigma) diluted in blocking solution.<br />
Tissue sections were washed with Tris buffered saline <strong>and</strong> incubated<br />
with the chromogenic substrates nitro-blue tetrazolium<br />
chloride <strong>and</strong> 5-bromo-4-chloro-3′-indolyphosphate p-toluidine<br />
salt (BioRad). Color development was carried out at<br />
room temperature <strong>and</strong> was stopped by washing in H2O.<br />
Statistical analysis<br />
Means <strong>and</strong> st<strong>and</strong>ard errors were calculated from replicates.<br />
Date <strong>and</strong> sugar effects were evaluated by analysis of variance<br />
(ANOVA) <strong>and</strong> by rank <strong>and</strong> Duncan tests (at 5%).<br />
Results<br />
Starch <strong>and</strong> sugar in xylem parenchyma cells<br />
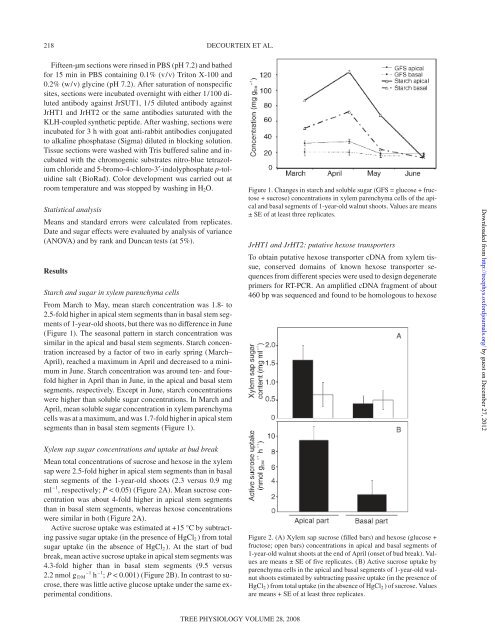
From March to May, mean starch concentration was 1.8- to<br />
2.5-fold higher in apical stem segments than in basal stem segments<br />
of 1-year-old shoots, but there was no difference in June<br />
(Figure 1). The seasonal pattern in starch concentration was<br />
similar in the apical <strong>and</strong> basal stem segments. Starch concentration<br />
increased by a factor of two in early spring (March–<br />
April), reached a maximum in April <strong>and</strong> decreased to a minimum<br />
in June. Starch concentration was around ten- <strong>and</strong> fourfold<br />
higher in April than in June, in the apical <strong>and</strong> basal stem<br />
segments, respectively. Except in June, starch concentrations<br />
were higher than soluble sugar concentrations. In March <strong>and</strong><br />
April, mean soluble sugar concentration in xylem parenchyma<br />
cells was at a maximum, <strong>and</strong> was 1.7-fold higher in apical stem<br />
segments than in basal stem segments (Figure 1).<br />
Xylem sap sugar concentrations <strong>and</strong> uptake at bud break<br />
Mean total concentrations of sucrose <strong>and</strong> <strong>hexose</strong> in the xylem<br />
sap were 2.5-fold higher in apical stem segments than in basal<br />
stem segments of the 1-year-old shoots (2.3 versus 0.9 mg<br />
ml –1 , respectively; P < 0.05) (Figure 2A). Mean sucrose concentration<br />
was about 4-fold higher in apical stem segments<br />
than in basal stem segments, whereas <strong>hexose</strong> concentrations<br />
were similar in both (Figure 2A).<br />
Active sucrose uptake was estimated at +15 °C by subtracting<br />
passive sugar uptake (in the presence of HgCl2 ) from total<br />
sugar uptake (in the absence of HgCl2 ). At the start of bud<br />
break, mean active sucrose uptake in apical stem segments was<br />
4.3-fold higher than in basal stem segments (9.5 versus<br />
2.2 nmol g DM –1 h –1 ; P < 0.001) (Figure 2B). In contrast to sucrose,<br />
there was little active glucose uptake under the same experimental<br />
conditions.<br />
TREE PHYSIOLOGY VOLUME 28, 2008<br />
Figure 1. Changes in starch <strong>and</strong> soluble sugar (GFS = glucose + fructose<br />
+ sucrose) concentrations in xylem parenchyma cells of the apical<br />
<strong>and</strong> basal segments of 1-year-old walnut shoots. Values are means<br />
± SE of at least three replicates.<br />
<strong>JrHT1</strong> <strong>and</strong> <strong>JrHT2</strong>: putative <strong>hexose</strong> transporters<br />
To obtain putative <strong>hexose</strong> transporter cDNA from xylem tissue,<br />
conserved domains of known <strong>hexose</strong> transporter sequences<br />
from different species were used to design degenerate<br />
primers for RT-PCR. An amplified cDNA fragment of about<br />
460 bp was sequenced <strong>and</strong> found to be homologous to <strong>hexose</strong><br />
Figure 2. (A) Xylem sap sucrose (filled bars) <strong>and</strong> <strong>hexose</strong> (glucose +<br />
fructose; open bars) concentrations in apical <strong>and</strong> basal segments of<br />
1-year-old walnut shoots at the end of April (onset of bud break). Values<br />
are means ± SE of five replicates. (B) Active sucrose uptake by<br />
parenchyma cells in the apical <strong>and</strong> basal segments of 1-year-old walnut<br />
shoots estimated by subtracting passive uptake (in the presence of<br />
HgCl2 ) from total uptake (in the absence of HgCl2 ) of sucrose. Values<br />
are means + SE of at least three replicates.<br />
Downloaded from<br />
http://treephys.oxfordjournals.org/ by guest on December 27, 2012