hyperspectral meets laserscanning - Institut für Photogrammetrie ...
hyperspectral meets laserscanning - Institut für Photogrammetrie ...
hyperspectral meets laserscanning - Institut für Photogrammetrie ...

You also want an ePaper? Increase the reach of your titles
YUMPU automatically turns print PDFs into web optimized ePapers that Google loves.
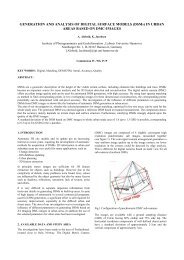
HYPERSPECTRAL MEETS LASERSCANNING: IMAGE ANALYSIS OF ROOF<br />
SURFACES<br />
Hans-Peter Bähr, Dirk Lemp, Uwe Weidner<br />
<strong>Institut</strong>e of Photogrammetry and Remote Sensing, University Karlsruhe, Englerstraße 7, 76128 Karlsruhe, Germany<br />
{hans-peter.baehr, dirk.lemp, uwe.weidner}@ipf.uni-karlsruhe.de<br />
ABSTRACT:<br />
Description of roofs in urban environments by their geometry and material is a basic feature for budgeting toxic water runoff. This<br />
e.g. allows to quantify pollution and the necessary dimension of sewage plants.<br />
An automatic procedure to determine the roof parameters has been jointly developed by geodesists and water chemistry experts<br />
from Karlsruhe University. Input data are <strong>hyperspectral</strong> images together with airborne <strong>laserscanning</strong> data. Image segmentation and<br />
classification use mainly the object-oriented eCognition approach. The procedure was tested at the Karlsruhe University Campus as<br />
a pilot area. For five main roof surface classes (brick, copper, aluminium/zinc, slate and stonelike/bitumen) the obtained absolute<br />
accuracy is better than 90 %.<br />
1. 1. INTRODUCTION<br />
The ongoing dynamic development of sensor technology<br />
leads to completely new opportunities and applications in<br />
the GIS domain: This confirms the technological law that<br />
new tools should not focus on existing products, but must<br />
necessarily lead to new ones. In this context, the paper<br />
presents a new opportunity offered by fusion of high<br />
resolution sensors, i.e. <strong>laserscanning</strong> on the one hand and<br />
<strong>hyperspectral</strong> imagery on the other. Both feature highresolution:<br />
laser scanning with respect to its geometrical<br />
resolution and <strong>hyperspectral</strong> imagery with respect to its<br />
inherent spectral resolution in terms of the number of<br />
narrow bands represented.<br />
The new opportunity given here is the description of roof<br />
surfaces by dimension and material in order to quantify<br />
polluted runoff water. Roofs in urban area had already<br />
played a role for 3D City models however limited to<br />
geometry (cf. Baltsavias and Grün, 2001). The analysis<br />
for pollution of runoff water is a new challenge.<br />
Functionality of roof surfaces has been neglected so far<br />
for both their negative and positive impact. While a<br />
negative side is presented in the following investigation,<br />
a positive side would be the use of roof surfaces for<br />
photovoltaic mini power plant assembly.<br />
2. BACKGROUND OF THE INVESTIGATION<br />
Laser scanning and <strong>hyperspectral</strong> data are often used<br />
exclusively, either to derive the geometry based on laser<br />
scanning data (cf. [2]) or to derive material maps based<br />
on <strong>hyperspectral</strong> data (cf. [1]). [3] use <strong>hyperspectral</strong> data<br />
(AVIRIS) in order to improve reconstruction results<br />
based on IFSAR, namely to mask vegetation areas, but<br />
the used data has only limited geometric resolution. In<br />
[4], they present results of <strong>hyperspectral</strong> data analysis for<br />
urban areas based on ROSIS and DAIS data, also<br />
discussing the impact of spectral and geometric<br />
resolution. [5] integrate Digital Surface Model (DSM)<br />
information in order to improve the results of<br />
<strong>hyperspectral</strong> classification based on HYDICE data. In<br />
their research the DSM, derived from aerial imagery, is<br />
applied for the discrimination of roofs and ground<br />
surfaces. The materials may have a similar spectrum, but<br />
they can be discriminated based on the height<br />
information. [6] show material mapping techniques based<br />
on deterministic similarity measures for spectral<br />
matching to separate target from non-target pixels in<br />
urban areas.<br />
[7] is the closest related work to our approach. They use a<br />
normalized DSM and <strong>hyperspectral</strong> data taken by the<br />
airborne DAIS 7915 sensor. A similar approach of [8] is<br />
using HyMap data, high resolution orthophotos and a<br />
DSM – the latter both derived from HRSC-A data. Their<br />
focus is on fusing the high resolution datasets by a<br />
segment-based technique.<br />
Our approach differs from the above with respect to the<br />
input data, in particular the laser scanning data. The<br />
segmentation strategy used allows to incorporate<br />
geometric and spectral clues. For classification, we use<br />
eCognition, which allows a hierchical classification and<br />
introduction of knowledge by using the different<br />
information sources for different decisions within a fuzzy<br />
classification scheme.<br />
The given results are from a research project under way<br />
at Karlsruhe University in cooperation with the Chair of<br />
Water Chemistry (Engler-Bunte-<strong>Institut</strong>e) and the<br />
<strong>Institut</strong>e of Photogrammetry and Remote Sensing. The<br />
aim is to quantify pollution from sealed surfaces in urban<br />
environment, especially from the different kind of roof<br />
surfaces and their different materials. The toxic material,<br />
like the metallic surfaces, has a strong impact on the type<br />
and dimension of sewage plants. The question is<br />
discussed, whether the owner of a building, that produces<br />
pollution and the cost to remove it, should pay a tax. On<br />
the other hand, treatment of rain runoffs water would be<br />
easier and considerably cheaper in case of low pollution<br />
rates. The modelling of the dissolved harmful<br />
components is not a trivial matter. Experiments in the<br />
Labs of Water Chemistry show a function of rainfall<br />
characteristics, different for the respective material. First<br />
flush shows higher concentrations than the following run<br />
off. After all, the concentrations are in function of the<br />
time elapsed from the last rainfall event.<br />
The recent activities in the described field emerge last not<br />
least from the EU water framework directive, which<br />
require continuous monitoring of the status for surface<br />
and ground water. Table 1 gives an overview of common<br />
roof material and their contribution to pollution.
Material Pollutant<br />
Brick PAC<br />
Copper CU, PAC<br />
Aluminium<br />
Zinc ZN, PAC<br />
Roofing felt/Bitumen TOC, DOC<br />
Stone plates, gravel<br />
Slate<br />
Grass<br />
Table 1: Example of roof materials and their properties as<br />
pollutants<br />
The definition of classes must take into consideration that<br />
stone plates and gravel are always combined with<br />
bitumen, and aluminium and zinc may not be separated<br />
even from visual inspection (see chapter 4).<br />
3. PILOT AREA AND DATA<br />
The Campus of Karlsruhe University was taken for a<br />
pilot area. The nearly 200 years of age of this oldest<br />
German Technical University show large roof surfaces of<br />
different material. The buildings, where the roofs are all<br />
accessible for checking without difficulties, are<br />
concentrated in an area of approximately 1 km x 0,5 km.<br />
The Campus is very well suited as a training field for<br />
research activities. A photogrammetric CAD-Model is<br />
available for multipurpose use together with sets of roof<br />
material from local inspection (Figure 1).<br />
Figure 1: The main campus of Karlsruhe University<br />
(approx. 1km x 0.5 km)<br />
CAD model generated from aerial photogrammetry<br />
The roof material of all buildings has been checked<br />
during the photogrammetric restitution by data from the<br />
University Administration and/or by local inspection.<br />
This yields nearly perfect ground truth.<br />
Table 2 resumes the <strong>hyperspectral</strong> data together with the<br />
laser scanning flight (more details see [12]).<br />
PAC = Polycyclic aromatic components, TOC = Total organic<br />
carbon, DOC = Dissolved organic carbon, Cu = copper, Zn =<br />
Zinc<br />
Sensor HyMap TopoSys II<br />
Flight HyEurope<br />
Campaign<br />
07/2003<br />
March, 2002<br />
Operation and DLR (German TopoSys<br />
Data<br />
Aerospace Company<br />
preprocessing Centre)<br />
Ravensburg<br />
Ground<br />
4 m x 4 m 1m x 1m<br />
Resolution (1m x 1m<br />
Spectral Range<br />
resampling)<br />
438 – 2483 nm 1560 nm (*)<br />
Spectral<br />
Resolution<br />
126 channels 1 channel<br />
Mode First and last<br />
pulse<br />
Table 2: Airborne <strong>hyperspectral</strong> and laser scanning data<br />
(*) used wavelength<br />
4. METHODOLOGY<br />
The classification of roof surfaces in urban environment<br />
requires high-resolution data for both geometric and<br />
spectral properties as shown in the previous chapter. Due<br />
to the very complex urban scenario (see Fig. 2), the<br />
object-based eCognition approach was chosen. This is an<br />
explicit procedure, where knowledge is entered a priori (a<br />
so-called “knowledge based approach”). The more<br />
heuristic statistical methods, like a Maximum Likelihood<br />
Multispectral Classification is not applicable, because of<br />
restriction to spectral signatures in a complex large scale<br />
environment.<br />
Figure 2: Geometrical and spectral challenges in a large<br />
scale urbain domain (section of approx. 100m x 100m<br />
from the central campus).<br />
4.1 Image Segmentation<br />
Image segmentation means subdivision of the scene into<br />
homogeneous primitives which are useful for the<br />
subsequent classification. In our case we are looking for<br />
roofs and their material, i. e. planar surfaces of different<br />
slope and of height above the ground starting from 3 m<br />
approximately.
The eCognition software, designed for Remote Sensing<br />
applications, does not allow to accept inclined surfaces<br />
as homogeneous by its region growing algorithm.<br />
However, inclination is a very strong geometric property<br />
entered from <strong>laserscanning</strong> data. Therefore, by IPF an<br />
algorithm was developed (first by F. Quint and S. Landes,<br />
1996 [10] and refined by T. Vögtle and E. Steinle, 2000<br />
[11]), which allows the segmentation of inclined roofs.<br />
Figures 3a/b show the obtained improvement for roofs.<br />
Fig. 3a: Segmentation of homogeneous primitives by<br />
eCognition (same clipping as Fig. 2)<br />
Fig. 3b: Segmentation of homogeneous primitives by the<br />
IPF approach<br />
Fig. 3c: IPF approach followed by eCognition<br />
The smooth transition between the brick and the slate<br />
patch at the lower right of Fig. 3 cannot be resolved by<br />
the geometric segmentation. Therefore, a subsequent<br />
eCognition algorithm had to be applied taking 2 spectral<br />
channels (red and infrared) in addition to the “geometric”<br />
ones from <strong>laserscanning</strong>.<br />
This procedure leads to the results shown in Fig. 3c. The<br />
roof surfaces are correctly separated. Consequently this<br />
2step-approach for segmentation is applied for the entire<br />
scene and offers an augmented functionality.<br />
4.2 Classification<br />
The definition of classes has to be done in relation to<br />
their contribution to the budget of pollution on the one<br />
hand side and to the available data in the feature space on<br />
the other. As mentioned before (chapter 2), stone plates,<br />
gravel and bitumen/roofing felt are assigned to one class<br />
“stonelike/bitumen”, because stone plates and gravel on<br />
roofs only occur in combination with bitumen underneath<br />
the surface, thus producing the respective toxic<br />
components. Moreover, zinc and aluminium are<br />
aggregated to one class after classification.<br />
The feature space offers geometric parameters from the<br />
<strong>laserscanning</strong> and spectral ones from the <strong>hyperspectral</strong><br />
flight. 3 geometrical channels are applied (i. e. heights<br />
from first and last pulse together with slope) and 20<br />
spectral channels carefully selected out of the available<br />
126 Hymap channels. Figure 4 gives an overview of the<br />
spectra for the roof material under consideration.
Figure 4: Spectra of roof surfaces (directly taken from the<br />
real HyMap data set)<br />
The eCognition fuzzy logic based classification<br />
procedure requires the a priori estimation of membership<br />
functions for each class. By this step knowledge about the<br />
classes with respect to the geometric and spectral features<br />
is modelled. This includes, besides obvious conclusions<br />
(e. g. steep increase of the brick spectral curve from<br />
channel 1 to 25, see Figure 4), more sophisticated<br />
relations are considered: Slope of the roof surfaces may<br />
serve as a class indicator. Flat roofs are always connected<br />
with stone plates/gravel/bitumen; in case of brick and<br />
slate an inclination is mandatory.<br />
5. RESULTS<br />
Tests have been done for different compositions of the<br />
input features for classification and reported by D. Lemp<br />
and U. Weidner (2005) [12]. In conclusion, refined<br />
segmentation and classification pays off and lead to better<br />
results compared to less rigorous approaches.<br />
5.1 Roof maps<br />
Figure 5: Classification result for the example of Figure<br />
2/3 (legend see Figure 4)<br />
Figure 5 shows the classification result for the small<br />
central campus section introduced in Figure 2. Visual<br />
inspection comparing Figure 2 and Figure 5 reveals a<br />
good quality of the result, taking in consideration the very<br />
complex building topography.<br />
The membership values in the classification procedure<br />
were determined by the fuzzy and (min), which showed a<br />
better quality than the fuzzy or (max). More details<br />
concerning the classification procedure are given in [9].<br />
The approach was applied to the whole area of the<br />
University Campus (Figure 1) and adjacent areas. The<br />
complete result (73.659 m 2 ) is displayed in [12]. With<br />
respect to a better readability, Figure 6 restricts the<br />
resulting roof map to the central part of the main campus.<br />
Figure 6: Final result: roof map of the Karlsruhe<br />
University (enlarged section approximately 0,8 km x 0,5<br />
km, legend see Figure 4).<br />
5.2 Quality Assessment<br />
Quality check of classification is a crucial step in image<br />
analysis. This is particularly true for the implicit methods,<br />
where knowledge is not modelled a priori. In case of<br />
knowledge-based explicit approaches like fuzzy logic in<br />
eCognition, the system itself offers internal quality<br />
measures.<br />
In this context the eCognition software takes the<br />
membership values as a “stability factor”. The values are<br />
computed for each object in the respective classes and<br />
present individual estimations of the reliability of the<br />
obtained results.<br />
Table 3: Mean membership values and their statistics for<br />
all objects retrieved for the fuzzy and (min)
Figure 7: eCognition stability of classification for the area<br />
displayed in Fig. 6<br />
The statistics of Table 3 shows high membership values<br />
for all classes. However, visualisation of the individual<br />
results in Fig. 7 reveal that in some minor areas the<br />
stability is weak. This happens primarily due to the<br />
limited geometrical ground resolution of 4m x 4m for the<br />
HyMap system which is not fully acceptable for roof<br />
analysis.<br />
As mentioned earlier, ground truth from local inspection<br />
is available. Therefore, this reference may be compared<br />
to the obtained results from eCognition leading to<br />
absolute quality values. In Table 4 the comparison is<br />
given by a confusion matrix. The numbers confirm the<br />
results from the previous analysis (Table 3 and Figure 7),<br />
showing best quality for brick roofs (nearly 100% correct<br />
classification) and the weakest for slate roofs. The<br />
overall correctness is 91,2%, i.e. 67.167 m 2 out of 73.659<br />
m 2 were correctly classified.<br />
Reference<br />
eCognition<br />
brick<br />
copper<br />
aluminum/<br />
zinc (*)<br />
slate<br />
stonelike/<br />
bitumen<br />
consumer<br />
accuracy<br />
brick 12728 0 8 0 6 99.9%<br />
copper 0 1570 111 0 7 93%<br />
aluminum/zinc 0 106 14810 232 2169 85.5%<br />
slate 24 0 410 4490 634 81%<br />
stonelike/bitumen 76 99 732 356 33569 96.4%<br />
producer accuracy 99.2% 88.5% 92.2% 88.4% 92.3%<br />
Table 4: Confusion matrix comparing reference data<br />
(ground truth) to object-oriented classification results<br />
The numbers are in m 2<br />
(*) Aluminum and Zinc is not seperated yet in reference<br />
data<br />
6. OUTLOOK<br />
New sensors like airborne <strong>hyperspectral</strong> and<br />
<strong>laserscanning</strong> lead to new applications, requiring new<br />
models and algorithms. The joint processing of<br />
<strong>hyperspectral</strong> and <strong>laserscanning</strong> means the fusion of very<br />
different data types. Therefore, the object oriented<br />
eCognition approach is well suited in order to obtain<br />
satisfactory results: finally a budget of pollution for<br />
runoff water from roofs.<br />
Large scale applications in urban environments will show<br />
growing importance in future. The reasons are in the<br />
demographic development, exploding population and<br />
megacities with all their problems like pollution, traffic<br />
collapse or disasters. Roofs as pollutants represent a very<br />
small sector in this context; however, they may be<br />
regarded also as resources. This is, e.g., true for<br />
installation of photovoltaic mini power plants on roof<br />
surfaces. The necessary methodology to find appropriate<br />
locations would be very similar to what has been<br />
developed in the presented analysis.<br />
REFERENCES<br />
[1] U. Heiden, S. Roessner, and K. Segl, “Potential of<br />
<strong>hyperspectral</strong> hymap data for material oriented<br />
identification of urban surfaces,” in Remote Sensing of<br />
Urban Areas, ser. Regensburger Geographische<br />
Schriften, vol. 35, 2001, pp. 69 – 77.<br />
[2] T. Vögtle and E. Steinle, “On the quality of object<br />
classification and automated building modelling based on<br />
<strong>laserscanning</strong> data,” in ISPRS WG III/3 Workshop - 3D<br />
Reconstruction from Airborne Laserscanner and InSAR<br />
Data, 2003, cD-ROM.<br />
[3] P. Gamba and B. Houshmand, “Hyperspectral and<br />
IFSAR data for 3d urban characterization,” in IGARSS<br />
2000, Honolulu, 2000, cD-ROM.<br />
[4] F. DellAcqua, P. Gamba, and G. Lisini, “Urban land<br />
cover mapping using <strong>hyperspectral</strong> and multispectral vhr<br />
sensors: Spatial versus spectral resolution,” in IAPRSIS,<br />
Vol. XXXVI-8/W27: ISPRS Joint Conferences 3rd<br />
International Symposium Remote Sensing and Data<br />
Fusion Over Urban Areas (URBAN 2005) / 5th<br />
International Symposium Remote Sensing of Urban Areas<br />
(URS 2005), M. Moeller and E. Wentz, Eds.,<br />
2005, CD-ROM.<br />
[5] V. Madhok and D. Landgrebe, “Supplementing<br />
<strong>hyperspectral</strong> data with digital elevation,” in IGARSS<br />
1999, Hamburg, 1999, cD-ROM.<br />
[6] S.Homayouni and M. Roux, “Hyperspectral image<br />
analysis for material mapping using spectral matching,”<br />
in IAPRSIS, Vol. 35, Part B (Comm. VII), 2004, cD-<br />
ROM.<br />
[7] M. Bochow, A. Greiwe, and M. Ehlers, “Ein<br />
Prozessmodell zur Analyse von Hyperspektraldaten in<br />
urbanen Gebieten,” in Vorträge 23. Wissenschaftlich-<br />
Technische Jahrestagung der DGPF, Bochum, 2003, pp.<br />
255 – 264.<br />
[8] A. Greiwe, M. Bochow, and M. Ehlers,<br />
“Segmentbasierte Fusion geometrisch hoch aufgelöster<br />
und hyperspektraler Daten zur Verbesserung der<br />
Klassifikationsgüte am Beispiel einer urbanen Szene,”<br />
PFG, vol. 6, pp. 485 – 494, 2004.<br />
[9] D. Lemp and U. Weidner, “Use of <strong>hyperspectral</strong> and<br />
laser scanning data for the characterization of surfaces in<br />
urban areas,” in IAPRSIS, Vol. XXXV, Part B (Comm.<br />
VII), 2004, CD-ROM.<br />
[10] F. Quint and S. Landes, “Colour aerial image<br />
segmentation using a bayesian homogenity predicate and<br />
map knowledge,” in IAPRS, Vol. 31, Part B4, 1996, pp.<br />
663 – 668.
[11] T. Vögtle and E. Steinle, “3d modelling of buildings<br />
using laser scanning and spectral information,” in IAPRS,<br />
Vol. 33, Part B3, 2000, pp. 927 – 934.<br />
[12] D. Lemp and U. Weidner, “Improvements of roof<br />
surface classification using <strong>hyperspectral</strong> and laser<br />
scanning data”, in IAPRSIS, Vol. XXXVI-8/W27: ISPRS<br />
Joint Conferences 3rd International Symposium Remote<br />
Sensing and Data Fusion Over Urban Areas (URBAN<br />
2005) / 5th International Symposium Remote Sensing of<br />
Urban Areas (URS 2005), M. Moeller and E. Wentz,<br />
Eds., 2005, CD-ROM.