Understanding the gaps to lay stronger foundations.
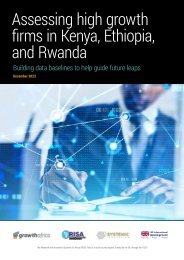
Appraising scaling data indicators in Kenya, Ethiopia and Rwanda. In this report, we highlight key elements of a data supply audit undertaken to determine what data exists that is relevant to scaling ventures in Kenya, Ethiopia and Rwanda. The findings inform the co-design and co-development of country-level data collaboratives to support ventures and ecosystem stakeholders by identifying, collating and diffusing relevant data and insights on scaling in the three countries.
Appraising scaling data indicators in Kenya, Ethiopia and Rwanda. In this report, we highlight key elements of a data supply audit undertaken to determine what data exists that is relevant to scaling ventures in Kenya, Ethiopia and Rwanda. The findings inform the co-design and co-development of country-level data collaboratives to support ventures and ecosystem stakeholders by identifying, collating and diffusing relevant data and insights on scaling in the three countries.

Create successful ePaper yourself
Turn your PDF publications into a flip-book with our unique Google optimized e-Paper software.
PAGE. 4<br />
<strong>Understanding</strong> <strong>the</strong><br />
<strong>gaps</strong> <strong>to</strong> <strong>lay</strong> <strong>stronger</strong><br />
<strong>foundations</strong><br />
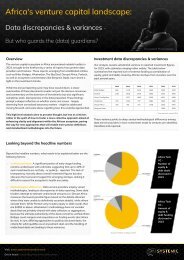
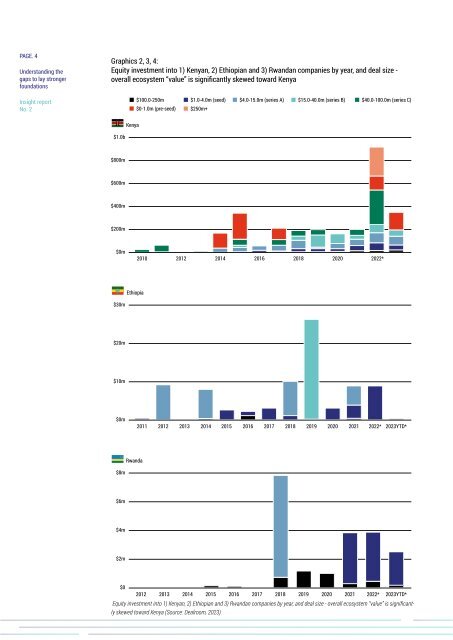
Graphics 2, 3, 4:<br />
Equity investment in<strong>to</strong> 1) Kenyan, 2) Ethiopian and 3) Rwandan companies by year, and deal size -<br />
overall ecosystem “value” is significantly skewed <strong>to</strong>ward Kenya<br />
Insight report<br />
No. 2<br />
$100.0-250m<br />
$0-1.0m (pre-seed)<br />
$1.0-4.0m (seed) $4.0-15.0m (series A) $15.0-40.0m (series B) $40.0-100.0m (series C)<br />
$250m+<br />
Kenya<br />
$1.0b<br />
$800m<br />
$600m<br />
$400m<br />
$200m<br />
$0m<br />
2010<br />
2012 2014 2016 2018 2020 2022*<br />
$30m<br />
Ethiopia<br />
$20m<br />
$10m<br />
$0m<br />
2011 2012 2013 2014 2015 2016 2017 2018 2019 2020 2021 2022* 2023YTD*<br />
Rwanda<br />
$8m<br />
$6m<br />
$4m<br />
$2m<br />
$0<br />
2012 2013 2014 2015 2016 2017 2018 2019 2020 2021 2022* 2023YTD*<br />
Equity investment in<strong>to</strong> 1) Kenyan, 2) Ethiopian and 3) Rwandan companies by year, and deal size - overall ecosystem “value” is significantly<br />
skewed <strong>to</strong>ward Kenya (Source: Dealroom, 2023)