The Mount Costigan Zn–Pb–Ag Deposit, West-Central New ...
The Mount Costigan Zn–Pb–Ag Deposit, West-Central New ...
The Mount Costigan Zn–Pb–Ag Deposit, West-Central New ...

You also want an ePaper? Increase the reach of your titles
YUMPU automatically turns print PDFs into web optimized ePapers that Google loves.
MRR 2012-1: Paper 2<br />
(CD-ROM)<br />
Mineral Resource Report<br />
James A. Walker and Douglas Clark<br />
2012<br />
Energy and Mines<br />
Geological Surveys<br />
<strong>The</strong> <strong>Mount</strong> <strong>Costigan</strong> <strong>Zn–Pb–Ag</strong><br />
<strong>Deposit</strong>, <strong>West</strong>-<strong>Central</strong> <strong>New</strong><br />
Brunswick, Canada: Stratigraphic<br />
Setting and Evolution of Felsic<br />
Intrusion-Related Mineralization
MADAWASKA<br />
Edmundston<br />
Maine,<br />
U.S.A.<br />
Report<br />
area<br />
Figure preparation<br />
Editing, layout<br />
Translation<br />
Campbellton<br />
RESTIGOUCHE<br />
VICTORIA<br />
CARLETON<br />
Fredericton<br />
YORK<br />
CHARLOTTE<br />
Recommended citation<br />
Report prepared by<br />
NORTHUMBERLAND<br />
SUNBURY<br />
Saint<br />
John<br />
Bathurst<br />
GLOUCESTER<br />
Miramichi<br />
QUEENS<br />
KINGS<br />
KENT<br />
Sussex<br />
SAINT JOHN<br />
Moncton<br />
WESTMORLAND<br />
ALBERT<br />
NEW<br />
BRUNSWICK<br />
Terry Leonard, Gwen L. Martin<br />
Gwen L. Martin<br />
Mineral Resource Report 2012-1:<br />
Paper 2 (CD-ROM)<br />
<strong>The</strong> <strong>Mount</strong> <strong>Costigan</strong> <strong>Zn–Pb–Ag</strong><br />
<strong>Deposit</strong>, <strong>West</strong>-<strong>Central</strong> <strong>New</strong><br />
Brunswick, Canada: Stratigraphic<br />
Setting and Evolution of Felsic<br />
Intrusion-Related Mineralization<br />
CD-ROM Edition<br />
ISBN 978-1-55471-778-1<br />
ISSN 1911-7582<br />
Online Edition<br />
ISBN 978-1-55471-779-8<br />
ISSN 1717-1237<br />
Le Bureau de traduction, Ministère de l’Approvisionnement et des<br />
Services du Nouveau-Brunswick (Translation Bureau, <strong>New</strong> Brunswick<br />
Department of Supply and Services)<br />
Walker, J.A., and Clark, D. 2012.<strong>The</strong><strong>Mount</strong> <strong>Costigan</strong> <strong>Zn–Pb–Ag</strong><br />
deposit, west-central <strong>New</strong> Brunswick, Canada: stratigraphic setting and<br />
evolution of felsic intrusion-related mineralization. <strong>New</strong> Brunswick<br />
Department of Energy and Mines; Geological Surveys Branch, Mineral<br />
Resource Report 2012-1: Paper 2 (CD-ROM), 50 p.<br />
Geological Surveys Branch<br />
<strong>New</strong> Brunswick Department of Energy and Mines<br />
Hon. Craig Leonard<br />
Minister of Energy and Mines<br />
October 2012
i<br />
TABLE OF CONTENTS<br />
LIST OF FIGURES AND TABLES.......................................................................................................... i<br />
ABSTRACT..................................................................................................................................... iii<br />
RÉSUMÉ........................................................................................................................................ iv<br />
INTRODUCTION ...............................................................................................................................1<br />
EXPLORATION HISTORY ..................................................................................................................1<br />
REGIONAL GEOLOGY ......................................................................................................................3<br />
DEPOSIT STRATIGRAPHY ................................................................................................................8<br />
LITHOGEOCHEMISTRY ...................................................................................................................11<br />
<strong>Mount</strong> <strong>Costigan</strong> <strong>Deposit</strong>..........................................................................................................12<br />
Felsic Volcanic Rocks .........................................................................................................12<br />
Mafic Dyke ..........................................................................................................................16<br />
Sedimentary Rocks .............................................................................................................16<br />
Lewis Brook Occurrence.........................................................................................................16<br />
Felsic Volcanic Rocks .........................................................................................................16<br />
Mafic Volcanic Rocks..........................................................................................................17<br />
Redstone <strong>Mount</strong>ain Granite ....................................................................................................17<br />
HYDROTHERMAL ALTERATION .......................................................................................................18<br />
MINERALIZATION...........................................................................................................................22<br />
SAMPLE ANALYSES.......................................................................................................................25<br />
Sulphur Isotope Analysis ........................................................................................................25<br />
Radiogenic Lead Isotope Analysis..........................................................................................27<br />
DISCUSSION .................................................................................................................................30<br />
CONCLUSIONS..............................................................................................................................34<br />
ACKNOWLEDGEMENTS ..................................................................................................................44<br />
REFERENCES ...............................................................................................................................44<br />
LIST OF FIGURES AND TABLES<br />
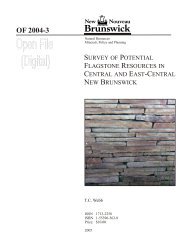
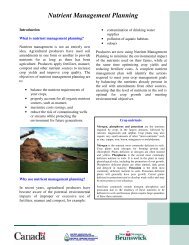
Figure 1 Location of the <strong>Mount</strong> <strong>Costigan</strong> deposit and other significant base metal<br />
sulphide deposits within the Chaleur Bay Synclinorium of west-central <strong>New</strong><br />
Brunswick. ............................................................................................................ 2<br />
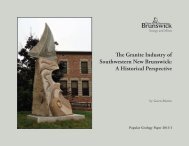
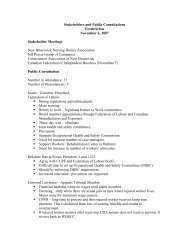
Figure 2 Geology map of the <strong>Mount</strong> <strong>Costigan</strong> deposit, showing the distribution<br />
of diamond-drillhole collars and traces, trenches, and mineralization. ................... 4<br />
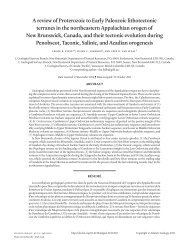
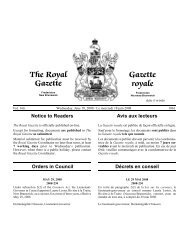
Figure 3 Cross-section A–A’ through the <strong>Mount</strong> <strong>Costigan</strong> deposit....................................... 5<br />
Figure 4 Samples of the Redstone <strong>Mount</strong>ain Granite. ........................................................ 7<br />
Figure 5 Rhyolitic host rocks of the <strong>Mount</strong> <strong>Costigan</strong> deposit. ............................................. 9<br />
Figure 6 Pyroclastic volcanic rocks intersected during drilling at the <strong>Mount</strong> <strong>Costigan</strong><br />
deposit. .............................................................................................................. 10<br />
Figure 7 Sedimentary rocks and peperite from the <strong>Mount</strong> <strong>Costigan</strong> area. ......................... 11
ii<br />
Figure 8 Major-element lithogeochemical discrimination diagrams for rocks from the<br />
<strong>Mount</strong> <strong>Costigan</strong>–Lewis Brook area . ................................................................... 13<br />
Figure 9 Trace-element lithogeochemical discrimination diagrams for rocks from the<br />
<strong>Mount</strong> <strong>Costigan</strong>–Lewis Brook area...................................................................... 14<br />
Figure 10 Rare-earth-element data for rocks from the <strong>Mount</strong> <strong>Costigan</strong>–Lewis Brook<br />
area. ................................................................................................................... 15<br />
Figure 11 Graphic presentation of mass balance data for host rocks from the <strong>Mount</strong><br />
<strong>Costigan</strong> deposit. ................................................................................................ 20<br />
Figure 12 Hydrothermal alteration in rocks from the <strong>Mount</strong> <strong>Costigan</strong> deposit. .................... 21<br />
Figure 13 Mineralization and alteration in drill core samples from the <strong>Mount</strong> <strong>Costigan</strong><br />
deposit. .............................................................................................................. 23<br />
Figure 14 a) Pb–Cu–Zn ternary diagram for assay data from the <strong>Mount</strong> <strong>Costigan</strong><br />
deposit. b) W versus Sn diagram for data from the <strong>Mount</strong> <strong>Costigan</strong> deposit,<br />
Lewis Brook occurrence, and Redstone <strong>Mount</strong>ain Granite. ................................. 25<br />
Figure 15 Seawater sulphur isotope curve through time, showing the δ 34 S content of<br />
marine evaporites, barite, and pyrite from the Selwyn Basin. ............................. 28<br />
Figure 16 Radiogenic lead isotope diagrams for host rocks and mineralization from<br />
the <strong>Mount</strong> <strong>Costigan</strong>, Shingle Gulch, and Sewell Brook deposits. ........................ 29<br />
Figure 17 Schematic diagram showing the inferred relationship between the <strong>Mount</strong><br />
<strong>Costigan</strong> deposit and the Lewis Brook occurrence, and the similarity of the<br />
<strong>Mount</strong> <strong>Costigan</strong> deposit to part of the Cordilleran epithermal Au–Ag deposit<br />
model of Panteleyev (1988)................................................................................ 32<br />
Note: Tables 1 to 3 contained multi-page lithogeochemical data and are compiled<br />
at the end of this report. Tables 4 to 6 appear in the text, where cited.<br />
Table 1 Lithogeochemical data for SLAM Exploration Ltd. drill cores and trenches at<br />
the <strong>Mount</strong> <strong>Costigan</strong> deposit. ............................................................................... 36<br />
Table 2 Lithogeochemical data for the Lewis Brook occurrence (<strong>Costigan</strong><br />
<strong>Mount</strong>ain Formation), and average values for the River Dee rhyolite and<br />
River Dee basalt (Wapske Formation)................................................................. 40<br />
Table 3 Lithogeochemical data for the Redstone <strong>Mount</strong>ain Granite collected during<br />
this investigation and compiled from previously published data of Whalen<br />
(1993).................................................................................................................. 43<br />
Table 4 Microprobe analyses for points on sample CM08-8-54 m. ................................... 19<br />
Table 5 Sulphur isotope data for bulk sulphides, and sphalerite and galena separates,<br />
from the <strong>Mount</strong> <strong>Costigan</strong> deposit......................................................................... 26<br />
Table 6 Temperatures of formation calculated from δ 34 S data for sphalerite and galena<br />
separates from the <strong>Mount</strong> <strong>Costigan</strong> deposit. ........................................................... 27
iii<br />
ABSTRACT<br />
<strong>Mount</strong> <strong>Costigan</strong> is the largest of several <strong>Zn–Pb–Ag</strong> sulphide deposits hosted by Early<br />
Devonian felsic volcanic rocks of the Tobique Group in the Chaleur Bay Synclinorium<br />
of west-central <strong>New</strong> Brunswick. <strong>The</strong> host sequence at <strong>Mount</strong> <strong>Costigan</strong> consists of high<br />
silica (70–76% SiO2), sparsely feldspar–phyric to aphyric rhyolite flows and breccia,<br />
intercalated felsic lithic- and crystal–lithic-lapilli tuff, and subordinate fine-grained<br />
clastic sedimentary rocks. <strong>The</strong> mineralized zone has a strike length of ~200 m and a<br />
width of up to 300 m, and has been intersected up to 300 m below surface. A historical<br />
resource estimate suggests a mass of mineralized rock of 6–8 Mt. Recent work has<br />
shown that, within this envelope, a subvertical to very steeply east-dipping zone<br />
contains a geological resource of ~0.9 Mt of 4–5% Zn + Pb.<br />
Mineralization is entirely epigenetic. It occurs as stratabound, finely disseminated grains<br />
and coarse patches within lithic tuff, and as massive sulphide veins and veinlets crosscutting<br />
rhyolitic flows. Sulphide mineralogy is dominated by reddish brown to pale<br />
yellow sphalerite (without chalcopyrite inclusions) and subordinate galena, with Zn/Pb<br />
~2. Pyrite is subordinate to sphalerite, and trace chalcopyrite is present. Elevated<br />
levels of silver (up to 132 g/t) and gold (up to 1.88 g/t), as well as anomalous Sn, Sb,<br />
and W, are present within the mineralized zone; however, no minerals have been<br />
identified in which these elements are primary constituents. <strong>The</strong> δ 34 S for bulk sulphide<br />
in the upper 100 m of the deposit is tightly constrained between 9.2‰ and 9.9‰ and is<br />
coincident with sulphide in equilibrium with Early Devonian seawater. A slightly lower<br />
δ 34 S (7.38‰) from deeper in the system (187 m) implies a larger percentage of<br />
magmatic sulphur at depth.<br />
<strong>The</strong> <strong>Mount</strong> <strong>Costigan</strong> mineralization is interpreted to have formed below the seafloor as<br />
a result of mixing metal-rich, magmatically derived ascending fluids with seawater that<br />
moved laterally through permeable pyroclastic rocks. <strong>The</strong> source of these metal-rich<br />
fluids may have been the nearby subvolcanic Redstone <strong>Mount</strong>ain Granite. <strong>The</strong><br />
subsurface precipitation of sulphides at temperatures of ~200°C allowed the<br />
development of a relatively coarse grain size. <strong>The</strong> relative lack of brecciation in<br />
deeper parts of the system implies that confining pressure inhibited separation of a<br />
gas phase (i.e., boiling). This model is supported by the recognition of undisrupted and<br />
unmineralized sedimentary units that crossed the core of the mineralized zone, units<br />
that apparently behaved as local barriers to upward egress of mineralizing fluids.<br />
However, the flow of fluids to shallower levels and the concomitant decrease in<br />
confining pressure did allow boiling in the upper part of the system, as indicated by the<br />
development of hydrothermal breccias.
iv<br />
RÉSUMÉ<br />
Le mont <strong>Costigan</strong> abrite le plus important de plusieurs gisements de sulfures de <strong>Zn–Pb–Ag</strong><br />
que renferment les roches felsiques du groupe de Tobique du début du Dévonien, dans le<br />
synclinorium du Centre-Ouest du Nouveau-Brunswick. La succession de roches<br />
encaissantes du mont <strong>Costigan</strong> comprend des unités à haute teneur en silice (70 à 76 % de<br />
SiO2), des coulées et des brèches rhyolitiques éparses à phénocristaux de feldspath<br />
aphyrique, ainsi que des strates de tuf felsique lithique et cristallin lithique et à lapilli, et des<br />
roches clastiques sédimentaires à grains fins subordonnées. La direction de la zone<br />
minéralisée s’étend sur un axe de plus ou moins 200 m et a une largeur qui peut atteindre<br />
300 m. La minéralisation a été interceptée à une profondeur qui peut atteindre 300 m sous<br />
la surface. Une ancienne estimation des ressources a établi un volume de roches<br />
minéralisées qui se situe entre 6 et 8 Mt. Des travaux récents ont indiqué que dans cette<br />
enveloppe, une zone caractérisée par un pendage subvertical à un angle abrupt vers l’est<br />
contiendrait une ressource géologique de 4 à 5 % de Zn-Pb de plus ou moins 0,9 Mt.<br />
La minéralisation est d’origine entièrement épigénétique. Elle se présente sous forme de grains<br />
fins stratoïdes et de bancs à grains grossiers encaissés dans du tuf lithique et sous forme de<br />
filons de sulfures massifs, et de filonnets de coulées rhyolitiques transversales. La minéralogie<br />
des sulfures se caractérise principalement par de la sphalérite brun rouge à jaune pâle<br />
(sans inclusion de chalcopyrite) et de la galène subordonnée, accompagnée de plus ou<br />
moins 2 éléments de Zn/Pb. La pyrite est subordonnée à la sphalérite et de la chalcopyrite<br />
est présente à l’état de trace. Des teneurs élevées d’argent (jusqu’à 132 g/t) et d’or (jusqu’à<br />
1,88 g/t), et des anomalies de Sn, Sb et de W sont observées dans la zone minéralisée.<br />
Toutefois, aucun minéral dont ces éléments seraient les principaux composants n’a été relevé.<br />
La valeur de δ 34 S du sulfure massif pour les premiers 100 m du gisement à partir de la surface<br />
se situe très exactement entre 9,2 ‰ et 9,9 ‰ et elle correspond à la présence équilibrée de<br />
sulfure dans l’eau de mer du début du Dévonien. Une valeur légèrement plus faible de δ 34 S<br />
(7,38 ‰) observée plus en profondeur dans la minéralisation (187 m) laisse présager un<br />
pourcentage plus important de sulfure d’origine magmatique en profondeur.<br />
La minéralisation du mont <strong>Costigan</strong> serait apparue sous le fond de l’océan et résulterait d’un<br />
mélange entre, d’une part, de l’eau de mer en déplacement latéral à travers des roches<br />
pyroclastiques perméables et, d’autre part, des fluides ascendants métallifères d’origine<br />
magmatique. Ces fluides ont pu provenir du granite subvolcanique voisin du mont<br />
Redstone. La précipitation de subsurface des sulfures à une température de plus ou moins<br />
200 °C a provoqué l’apparition de grains relativement grossiers. L’absence relative de<br />
bréchification dans les zones plus profondes du système porte à croire que la pression de<br />
confinement a empêché une séparation de phase gazeuse (c’est-à-dire l’ébullition). Ce<br />
modèle d’interprétation est corroboré par la reconnaissance d’unités sédimentaires intactes<br />
et non minéralisées qui ont traversé le coeur de la zone minéralisée, et d’unités qui ont<br />
semble-t-il agi par endroits comme une barrière et bloqué la migration vers la surface des<br />
fluides de minéralisation. Par ailleurs, l’écoulement de fluides vers des zones moins<br />
profondes et la pression de confinement plus faible qui l’accompagnait ont permis l’ébullition<br />
dans la partie supérieure de la minéralisation, comme l’atteste l’apparition de brèches<br />
hydrothermales.
INTRODUCTION<br />
1<br />
<strong>The</strong> <strong>Mount</strong> <strong>Costigan</strong> deposit, Unique Reference Number (URN) 720 in the <strong>New</strong> Brunswick<br />
Department of Natural Resources (NBDNR) Mineral Occurrence Database (Rose and<br />
Johnson 1990; NBDNR 2011), is located approximately 30 km east-northeast of the village of<br />
Plaster Rock, on the east slope of <strong>Costigan</strong> <strong>Mount</strong>ain in west-central <strong>New</strong> Brunswick (Fig. 1).<br />
<strong>The</strong> deposit is the largest <strong>Zn–Pb–Ag</strong> sulphide accumulation recognized within the southern<br />
Chaleur Bay Synclinorium (Fig. 1, inset). <strong>The</strong> synclinorium also contains the Shingle Gulch<br />
and Sewell Brook deposits (URN 102 and URN 986, respectively; Fig. 1) and has a reported<br />
historical (non-NI 43-101-compliant) tonnage estimate of 6–8 Mt (Fyffe and Pronk 1985).<br />
Although the deposit was discovered in the early 1970s, it has not previously benefitted from<br />
detailed mineral deposit studies, primarily because of the lack of sufficient, good-quality drill<br />
core. However, recent drilling by SLAM Exploration (Clark 2004, 2008) has provided cores<br />
sufficient for the stratigraphic and metallogenic assessment presented herein.<br />
<strong>The</strong> purpose of this investigation is three-fold: 1) to document the position of the deposit within<br />
the volcanosedimentary stratigraphy of the Tobique Group, 2) to document the style of<br />
mineralization and related hydrothermal alteration, and 3) to formulate a model explaining<br />
deposit genesis in order to aid industry in the search for similar deposits.<br />
EXPLORATION HISTORY<br />
<strong>The</strong> first documented indication of mineralization in the <strong>Costigan</strong> <strong>Mount</strong>ain area occurred in<br />
1954, when the area was highlighted for its anomalous Pb and Zn in a regional stream<br />
sediment survey (<strong>Mount</strong> <strong>Costigan</strong> Mines 1955). Follow-up work, including soil geochemical<br />
and self-potential surveys, outlined anomalous areas but failed to identify in situ mineralization<br />
(MacLean 1963). Likewise, soil geochemical surveys conducted by Silcan Mines Ltd. failed to<br />
identify in situ mineralization (Riddell 1971).<br />
<strong>The</strong> <strong>Mount</strong> <strong>Costigan</strong> deposit (Fig. 2, 3) was discovered by Amoco Ltd. in 1973 while the<br />
company conducted induced-polarization (IP) surveys as a follow-up to earlier work (Maingot<br />
1974). In 1975 Amoco established a grid, conducted soil geochemical and IP surveys, and<br />
drilled holes NBTO-1 to NBTO-5 (Bjornson 1975). Drillholes NBTO-6 to NBTO-25 were put<br />
down in 1976 (Fig. 2), but only holes NBTO-22 through NBTO-25 were filed for assessment<br />
(Bjornson 1976). Holes NBTO-26 to NBTO-28 were drilled in 1977 (Bjornson 1977). Lac<br />
Minerals optioned the <strong>Mount</strong> <strong>Costigan</strong> property in the early 1980s and conducted<br />
magnetometer and electromagnetic (VLF) surveys (Lavoie 1982), followed by the relogging of<br />
Amoco’s previously drilled cores, additional magnetometer and VLF surveys, trenching, and<br />
mapping (Crevier 1983). Lac Minerals drilled holes LCO-1 to LCO-10, totalling 1977 m in and<br />
around the area of mineralization in 1983 (Crevier and Gravel 1983; Crevier 1984). Collar<br />
locations for all the above holes are given in Fyffe and Pronk (1985). Later drilling by Lac<br />
Minerals consisted of five drillholes (LCO84-1 through LCO84-5) that totalled 996 m (Crevier<br />
1985). Geochemical samples collected from previously reported drill cores were assayed for<br />
Cu, Pb, Zn, Ag, and Au (Lac Minerals 1989).
Map<br />
area<br />
Maine,<br />
U.S.A.<br />
o<br />
46 59’00”<br />
Campbellton<br />
CVGS<br />
0 100 km<br />
APA<br />
BMC<br />
Saint<br />
John<br />
CARBONIFEROUS<br />
Terrestrial<br />
sedimentary rocks<br />
EARLY DEVONIAN<br />
Redstone <strong>Mount</strong>ain<br />
Granite<br />
Mafic intrusions<br />
Rocky Brook–<br />
Millstream<br />
Fault<br />
Bathurst<br />
Miramichi<br />
Moncton<br />
Fredericton<br />
CVGS<br />
Connecticut Valley–<br />
Gaspé Synclinorium<br />
APA<br />
Miramichi<br />
Anticlinorium<br />
(Ganderia)<br />
Elmtree Inlier<br />
DW<br />
Chaleur Bay<br />
Synclinorium<br />
BMC<br />
Bathurst<br />
Mining Camp<br />
Aroostook–Percé<br />
Anticlinorium<br />
Plaster Rock<br />
0 8 km<br />
Area of<br />
Figure 2<br />
Tobique Group<br />
Wapske Formation<br />
2<br />
Sewell<br />
Brook<br />
Marine sedimentary rocks<br />
Mainly felsic volcanic rocks<br />
Mainly mafic volcanic rocks<br />
<strong>Costigan</strong> <strong>Mount</strong>ain Formation<br />
Mainly felsic volcanic rocks<br />
Mainly mafic volcanic rocks<br />
Shingle<br />
Gulch<br />
412.5 ± 2 Ma<br />
<strong>Mount</strong><br />
<strong>Costigan</strong><br />
Lewis<br />
Brook<br />
LATE SILURIAN<br />
North Pole Stream Granite<br />
CAMBRO–ORODOVICIAN<br />
Miramichi Anticlinorium<br />
Unconformity, fault<br />
Base metal sulphide deposit<br />
Syncline, anticline<br />
Figure 1. Location of the <strong>Mount</strong> <strong>Costigan</strong> deposit in west-central <strong>New</strong> Brunswick, showing other<br />
significant base metal sulphide deposits within the Chaleur Bay Synclinorium (see inset). (Geology<br />
modified from Fyffe and Pronk 1985; Wilson 1990; Smith and Fyffe 2006a, 2006b.)<br />
67 00’00”<br />
o<br />
River Dee<br />
volcanic<br />
rocks<br />
Shingle<br />
Gulch East<br />
Trousers<br />
Lake<br />
U–Pb (zircon) radiometric<br />
age (Wilson et al. 2004)
3<br />
Taylor and Associates acquired the property in 1984 and carried out a VLF survey on the<br />
deposit (Taylor 1995). Chapleau Resources optioned the property in 1996 and conducted a<br />
soil geochemical survey (Turner 1996a), magnetometer and VLF surveys, and geological<br />
mapping (Turner 1996b). In 1998 previously unreported diamond drilling by Chapleau<br />
Resources (drillholes MC97-1 through MC97-3, totalling 750.1 m) and results of a soil<br />
geochemical survey and geological mapping were filed by Taylor and Associates (Walker<br />
1998). <strong>The</strong> current (2012) property holder, SLAM Exploration Ltd., acquired the property in<br />
2003. That company drilled 475.2 m of core in three diamond drillholes (CM03-1 through<br />
CM03-3) (Clark 2004) and in 2008 drilled an additional 11 holes (CM08-04 through CM08-14),<br />
totalling 2768 m (Clark 2008). In addition to being described in the assessment files cited<br />
above, the <strong>Mount</strong> <strong>Costigan</strong> deposit was briefly discussed in Fyffe and Pronk (1985) and was<br />
the subject of a M.Sc. thesis by Cox (1990).<br />
Most of the core drilled during the early exploration campaigns (i.e., those conducted by<br />
Amoco Ltd. and Lac Minerals) has been lost, and only a few of the smaller diameter, handsplit<br />
cores from the LCO series of holes are preserved at the Provincial Government core<br />
storage facility in Madran, northeast <strong>New</strong> Brunswick. However, the larger diameter (NQ) cores<br />
obtained by SLAM Exploration are stored at Madran and at the SLAM Exploration core shed<br />
in Beresford. <strong>The</strong> present report is based on the material collected from, and observations<br />
made using, these drill cores as well as on information compiled from the assessment data.<br />
REGIONAL GEOLOGY<br />
<strong>The</strong> <strong>Mount</strong> <strong>Costigan</strong> area is underlain by rocks that are part of the Chaleur Bay Synclinorium,<br />
which extends from the south shore of the Gaspé Peninsula (Québec) for approximately 250<br />
km to the southwest. <strong>The</strong> Chaleur Bay Synclinorium is divided into northern and southern<br />
parts by the Rocky Brook–Millstream Fault (Fig. 1, inset). North of this structure, the<br />
synclinorium contains sequences of Silurian clastic and carbonate sedimentary rocks, and<br />
felsic and mafic volcanic rocks, which are included in the Quinn Point, Dickie Cove, Petit<br />
Rocher, and Chaleurs groups (Irrinki 1990; Wilson and Kamo 2012). <strong>The</strong>se sequences are<br />
overlain by Early Devonian mafic and felsic volcanic and sedimentary rocks of the Dalhousie<br />
Group. Silurian rocks are largely absent to the south of the Rocky Brook–Millstream Fault,<br />
where the Chaleur Bay Synclinorium instead is underlain mainly by Early Devonian volcanic<br />
and sedimentary rocks of the Tobique Group (St. Peter 1978a, 1978b; Fyffe and Pronk 1985;<br />
Wilson 1990, 1992).<br />
<strong>The</strong> volcanic and sedimentary rocks of the Chaleur Bay Synclinorium are interpreted to have<br />
been deposited in a transtensional tectonic setting initiated by sinistral and dextral oblique<br />
convergence of the microcontinents of Ganderia (Miramichi Anticlinorium; Fig 1, inset) and<br />
Avalonia (located along the Bay of Fundy, southern <strong>New</strong> Brunswick) with the continental<br />
margin of Laurentia in the Silurian to Early Devonian, respectively (Dostal et al. 1989; van<br />
Staal and de Roo 1995; van Staal et al. 2009). This interpretation is supported by the overall<br />
bimodal nature of volcanism, although volumetrically significant volcanic rocks of intermediate<br />
composition occur locally. <strong>The</strong> observation that felsic rocks are most abundant near the base
o<br />
46 59’00”<br />
67 01’00”<br />
67 03’00”<br />
o<br />
o<br />
LCO-6<br />
NBTO-20<br />
NBTO-19<br />
NBTO-21<br />
<strong>Mount</strong> <strong>Costigan</strong><br />
671 m above<br />
sea level<br />
NBTO-18<br />
CM03-1<br />
LCO84-3<br />
A<br />
LCO84-1<br />
LCO84-5<br />
A’<br />
LCO84-2<br />
LCO84-4<br />
Area of<br />
inset map<br />
MC97-1<br />
NBTO-5<br />
o<br />
flat or 90 dip<br />
LCO-2<br />
MC97-2<br />
LCO-1<br />
CM03-3<br />
some volcanic<br />
fragments<br />
LCO-10<br />
NBTO-2<br />
4<br />
NBTO-1<br />
CM03-2<br />
LCO-3<br />
NBTO-4<br />
NBTO-3<br />
LCO-4<br />
NBTO -1 to -28: Amoco (1975–78)<br />
Porphyritic felsic flows<br />
LCO-1 to -10: Lac Minerals (1983)<br />
Felsic lithic-lapilli tuff<br />
NBTO-23<br />
NBTO-26<br />
NBTO-7<br />
CM03-1 to -3: SLAM Expl. (2003)<br />
NBTO-12<br />
LCO-8<br />
CM08-4 to -14: SLAM Expl. (2008)<br />
Felsic crystal tuff<br />
NBTO-28<br />
CM08-13<br />
CM03-1<br />
CM08-05<br />
NBTO-15<br />
NBTO-25<br />
Line of section,<br />
drillhole<br />
Grey to black siltstone<br />
and sandstone; locally<br />
fossiliferous<br />
NBTO-22<br />
CM08-8NBTO-14<br />
CM08-9<br />
CM08-10<br />
NBTO-9<br />
CM08-7<br />
NBTO-6<br />
CM08-4<br />
TNB79-4<br />
NBTO-10<br />
NBTO-11<br />
TNB79-1<br />
CM08-14<br />
CM08-6<br />
Mafic volcanic rocks<br />
TNB79-2<br />
Stream, road<br />
Area of mineralization<br />
125 m<br />
LCO-9<br />
NBTO-24<br />
NBTO-13<br />
NBTO-16<br />
TNB79-3<br />
NBTO-27<br />
o<br />
46 58’00”<br />
NBTO-17<br />
NBTO-8<br />
Figure 2. Geology map of the <strong>Mount</strong> <strong>Costigan</strong> deposit, with diamond-drillhole collars and traces, trenches, and limits of surface mineralization.<br />
Figure 1 shows the location of this figure; Figure 3 shows cross-section A–A'. (Geology adapted from Fyffe and Pronk 1985; Clark 2008.)
A’<br />
Zone of quartz–<br />
carbonate veining<br />
A<br />
CM08-9<br />
NBTO-9<br />
NBTO-6<br />
NBTO-17<br />
NBTO-10<br />
CM08-10<br />
NBT0-11<br />
CM03-1<br />
NBTO-25<br />
Projected<br />
from south<br />
NBTO-22<br />
Projected<br />
from north<br />
LCO84-2<br />
LCO84-1<br />
NBTO-5<br />
LCO84-3<br />
5<br />
LCO-9<br />
0 200 m<br />
Drillhole in plane of section<br />
Overburden Coarse lithic tuff<br />
Pyroclastic<br />
tuffs<br />
Core Zone (>4% Zn + Pb)<br />
Crystal–lithic tuff<br />
Drillhole projected<br />
Fine-grained clastic sedimentary rocks<br />
Rhyolitic flows<br />
Drillhole interval projected<br />
Limit of mineralization<br />
Fragmental rocks associated with<br />
massive flows (carapace/sole breccia)<br />
Figure 3. Cross-section A–A’ through the <strong>Mount</strong> <strong>Costigan</strong> deposit, looking north-northeasterly (modified from Clark 2008). Figure 2 shows the<br />
location of this cross-section.
6<br />
but give way upsection to dominantly mafic volcanic rocks is interpreted to reflect the<br />
transition from 1) initial rifting with low percentage partial melting of lower crust followed by<br />
magma generated from higher percentage partial melts, to 2) mafic magmas generated in the<br />
upper mantle.<br />
<strong>The</strong> Tobique Group is divided into two formations: 1) the <strong>Costigan</strong> <strong>Mount</strong>ain Formation, which<br />
hosts the <strong>Mount</strong> <strong>Costigan</strong> deposit and the Lewis Brook <strong>Zn–Pb–Ag</strong> occurrence (Fig. 1), and<br />
2) the gradationally overlying Wapske Formation (St. Peter 1978a). <strong>The</strong>se formations contain<br />
similar rock types but differ in their relative proportion of sedimentary and volcanic strata. <strong>The</strong><br />
<strong>Costigan</strong> <strong>Mount</strong>ain Formation comprises ~3000 m of dominantly felsic volcanic rock consisting<br />
of pink, light grey, or light green quartz–feldspar porphyry, rhyolitic ash-flow tuff, lapilli tuff and<br />
breccia, and flow-layered rhyolite. <strong>The</strong> felsic volcanic rocks are intercalated with lesser marine<br />
shale, siltstone, and quartzose to lithic sandstone, and subordinate mafic volcanic rocks. <strong>The</strong><br />
Wapske Formation comprises a 7900 m thick sequence of locally pillowed mafic lavas and<br />
related volcanic rocks interlayered with abundant marine sedimentary rocks (shale, siltstone,<br />
and quartzose to lithic sandstone) and minor felsic volcanic rocks<br />
As originally defined by St. Peter (1978a), an isochronous contact between the <strong>Costigan</strong><br />
<strong>Mount</strong>ain and Wapske formations was inferred, but later faunal evidence showed that they<br />
were only partly coeval: that is, they had a diachronous relationship (Han and Pickerill 1994).<br />
Mapping by Wilson (1990) indicates that the felsic volcanic rocks of the <strong>Costigan</strong> <strong>Mount</strong>ain<br />
Formation can be traced only as far north as Trousers Lake (Fig. 1). <strong>The</strong> current report places<br />
the contact between these two formations on the west side of the large felsic volcanic pile that<br />
hosts the <strong>Mount</strong> <strong>Costigan</strong> deposit, approximately 6 km west of the Tobique Group–Redstone<br />
<strong>Mount</strong>ain Granite contact. Assuming an average westerly dip of 35° for the Tobique Group,<br />
the contact is approximately 3.4 km stratigraphically above the base of the Tobique Group<br />
(Fig. 1).<br />
Age control on the Tobique Group is based on paleontological data that consistently yield an<br />
Early Devonian age (St Peter 1978a; Wilson 1990; Boucout and Wilson 1994). A U–Pb<br />
(zircon) age of 412.5 ± 2.0 Ma (Wilson et al. 2004) was obtained from a rhyolite located<br />
approximately 3.5 km along strike to the north-northwest of the <strong>Mount</strong> <strong>Costigan</strong> deposit (Fig.<br />
1). Silicified felsic lapilli tuff collected from trenches on the west side of the <strong>Mount</strong> <strong>Costigan</strong><br />
deposit yielded a K–Ar age of 373 ± 19 Ma (Fyffe and Pronk 1985). This younger age<br />
estimate likely reflects a later thermal resetting of the radiometric clock attributable to<br />
Devonian pluton emplacement.<br />
<strong>The</strong> felsic volcanic rocks hosting the <strong>Mount</strong> <strong>Costigan</strong> deposit are part of the <strong>Costigan</strong><br />
<strong>Mount</strong>ain Formation and therefore are considered to be among some of the oldest felsic<br />
volcanic rocks in the Tobique Group. Regional mapping suggests that the lowermost strata of<br />
the Tobique Group lie with faulted unconformity against Cambro–Ordovician rocks of the<br />
Miramichi Anticlinorium (Fig. 1). However, immediately east and for some distance south of<br />
the deposit, the contact relationship between the Tobique Group and the Cambro–Ordovician
7<br />
Figure 4. Samples of the Redstone <strong>Mount</strong>ain Granite, showing the porphyritic phase (left and<br />
right) and the microgranitic phase (centre). Pen is 14.5 cm long.<br />
rocks is obscured by the Redstone <strong>Mount</strong>ain Granite, which apparently sutures this contact<br />
(Fyffe and Pronk 1985).<br />
<strong>The</strong> Redstone <strong>Mount</strong>ain Granite is a pink to scarlet red, medium-grained, biotite–amphibole<br />
granite that has been traced some 15 km along the boundary between the Miramichi<br />
Anticlinorium and Chaleur Bay Synclinorium (Whalen 1993). However, within the intrusion<br />
there is significant variation in grain size. Work during this investigation suggests the<br />
occurrence of at least three distinct phases, but outcrop distribution is insufficient to delineate<br />
phase boundaries. <strong>The</strong> three phases are 1) a fine-grained red microgranite, 2) a fine-grained<br />
intermediate phase bordering mafic dikes, and 3) a quartz–feldspar porphyry<br />
(Fig. 4). Both<br />
the red microgranite and the quartz–feldspar porphyry contain a small percentage of<br />
ferromagnesian minerals (mostly biotite). Near the southern limit of the pluton, in the vicinity<br />
of Redstone <strong>Mount</strong>ain, the intrusion becomes coarser grained and contains a much higher<br />
percentage of ferromagnesian minerals.<br />
This intrusion has yielded a Rb–Sr age of 409 ± 25 Ma (Fyffe and Pronk 1985); however,<br />
apparent hornfelsing of the intrusion in proximity to the North Pole Stream Granite (417<br />
± 1 Ma) suggests an emplacement age of not younger than 417 Ma (Fyffe and Pronk 1985;<br />
Whalen 1993).
DEPOSIT STRATIGRAPHY<br />
8<br />
<strong>The</strong> <strong>Mount</strong> <strong>Costigan</strong> deposit is hosted by rocks of the Early Devonian <strong>Costigan</strong> <strong>Mount</strong>ain<br />
Formation (Fig. 1). <strong>The</strong> lower part of the stratigraphic section is dominated by mafic volcanic<br />
and marine sedimentary rocks, and the upper part, by felsic volcanic and very minor<br />
sedimentary rocks. <strong>The</strong>se strata strike roughly north–south and dip moderately (~45°) to the<br />
west, similar to adjacent parts of the Chaleur Bay Synclinorium (Fyffe and Pronk 1985; Wilson<br />
1990; Walker 2005). Results of this investigation and that of Clark (2008) suggest that the<br />
local deposit stratigraphy is much flatter than the general regional trend, with dips generally<br />
≤20°W (Fig. 3). <strong>The</strong> flatter stratigraphy in the immediate vicinity of the deposit could be the<br />
result of local block faulting. Alternatively, the shallower dips may be the result of interference<br />
of a moderate structural dip with steep paleotopographic variation such as would be expected<br />
with the emplacement of cryptodomes.<br />
<strong>The</strong> <strong>Mount</strong> <strong>Costigan</strong> deposit occurs within the felsic volcanic sequence (Fig. 2, 3) at and near<br />
the contact between a lower unit of felsic crystal tuff (chloritic) and overlying felsic lithic-lapilli<br />
tuff (Fyffe and Pronk 1985). According to Fyffe and Pronk (1985), these units are overlain by<br />
massive porphyritic rhyolite; a sample collected along strike from this stratigraphically higher<br />
rhyolite yielded the 412.5 ± 2.0 Ma age mentioned above. This simplified stratigraphic<br />
interpretation was based on a limited number of small-diameter drill cores and on limited<br />
outcrop distribution. However, Clark (2008) and the present investigation indicate a more<br />
complex volcanosedimentary stratigraphy, one marked by rapid facies changes and the<br />
absence of definitive marker horizons (Fig. 3).<br />
<strong>The</strong> host rocks at the <strong>Mount</strong> <strong>Costigan</strong> deposit consist of massive rhyolitic flows and<br />
pyroclastic tuffs. <strong>The</strong> rhyolitic flows are light to medium grey to black, locally bleached, and<br />
aphyric to very sparsely feldspar-phyric. <strong>The</strong>y commonly exhibit primary devitrification<br />
textures such as perlitic fractures (Fig. 5a) and spherulites (Fig. 5b) that range in size from<br />
Figure 5. Rhyolitic host rocks of<br />
the <strong>Mount</strong> <strong>Costigan</strong> deposit.<br />
a) Photomicrograph of perlitic<br />
fractures in feldspar-phyric rhyolite<br />
from diamond drillhole (DDH)<br />
CM08-8 at 78.7 m. Photograph was<br />
taken under plain polarized light.<br />
Field of view is 3 mm.<br />
Figure 5. b) Large spherulites<br />
developed in sparsely feldsparphyric<br />
rhyolite from DDH CM08-4 at<br />
151 m. Core diameter is ~4.7 cm.<br />
Figure 5. c) Grey, sparsely feldsparphyric,<br />
flow-layered rhyolite from<br />
DDH CM08-4 at 69 m. Core<br />
diameter is ~4.7 cm.<br />
9<br />
CM08-4<br />
a<br />
b<br />
c
CM08-4<br />
Granitoid<br />
clast<br />
10<br />
a<br />
b<br />
c<br />
Figure 6. Pyroclastic volcanic rocks<br />
intersected during drilling at the<br />
<strong>Mount</strong> <strong>Costigan</strong> deposit. a) Coarse<br />
lithic-lapilli tuff from DDH CM08-10<br />
at 11–18.5 m. Core diameter is<br />
4.7 cm.<br />
Figure 6. b) Lithic tuff with granitoid<br />
clast from DDH CM08-4 at 42 m.<br />
Core diameter is 4.7 cm.<br />
Figure 6. c) Rhyolitic flow with<br />
carapace breccia (bottom two runs)<br />
and overlying hyaloclastite (top run)<br />
from DDH CM08-10 at 196–199 m.<br />
Core diameter is 4.7 cm.
Figure 7. Sedimentary rocks<br />
and peperite from the <strong>Mount</strong><br />
<strong>Costigan</strong> area. a) Blue-grey<br />
siltstone–sandstone with<br />
volcanic debris from DDH<br />
CM08-4 at 192–194 m. Core<br />
diameter is 4.7 cm.<br />
Figure 7. b) Peperitic texture<br />
resulting from interaction<br />
between sparsely feldsparphyric<br />
rhyolite and siltstone–<br />
mudstone. Photograph is from<br />
DDH CM08-4 at 262 m. Core<br />
diameter is 4.7 cm.<br />
LITHOGEOCHEMISTRY<br />
11<br />
Whole-rock lithogeochemical data were obtained in order to ascertain primary rock types and<br />
to document the effects of mineralization-related alteration processes. Twenty samples<br />
(Table 1) were collected from SLAM Exploration drill cores from the <strong>Mount</strong> <strong>Costigan</strong> deposit,<br />
including 17 felsic volcanic, one mafic dyke, and two sedimentary samples. An additional<br />
seven samples of felsic volcanic rocks were collected from surface trenches at the deposit<br />
(Table 1). Fifteen core samples (six felsic and nine mafic volcanic) were collected from the<br />
Lewis Brook <strong>Zn–Pb–Ag</strong> occurrence (Table 2). This deposit is hosted by rocks that occur 1–1.5<br />
km stratigraphically higher than, and approximately 4 km south-southwest along strike from,<br />
the <strong>Mount</strong> <strong>Costigan</strong> deposit (Fig. 1). For comparison, Table 2 includes the average compositions<br />
of rhyolitic and basaltic rocks of the Wapske Formation to the north of the <strong>Mount</strong> <strong>Costigan</strong><br />
deposit (i.e., the River Dee rhyolite and River Dee basalt of Wilson 1992: see Fig. 1).<br />
a<br />
b
12<br />
Six samples were collected from various phases of the Redstone <strong>Mount</strong>ain Granite (Table 3);<br />
data for four samples of this granite from Whalen (1993) are also included in Table 3. It should<br />
be noted that one of the samples assigned to the Redstone <strong>Mount</strong>ain Granite by Whalen<br />
(1993; his sample G15-138) is not from this intrusion but more likely is from the North Pole<br />
Stream Granite and has been omitted from the geochemical variation diagrams in the current<br />
report. [Please note: Tables 1 to 3 are compiled at the end of this report, starting on p. 36.]<br />
<strong>Mount</strong> <strong>Costigan</strong> <strong>Deposit</strong><br />
Felsic Volcanic Rocks<br />
<strong>The</strong> host sequence at <strong>Mount</strong> <strong>Costigan</strong> is dominated by aphyric to very sparsely feldspar- phyric,<br />
high-silica (70–76% SiO2) rhyolite. Most of the rhyolite samples contain 7–11% total alkalis<br />
(Na2O + K2O) and plot in the rhyolite field on the total alkalis versus SiO2 diagram (Fig. 8a).<br />
However, in general the Na2O contents of these rocks are very low (at or below the analytical<br />
detection limit), and most of the samples contain 6–11% K2O (Fig. 8b). <strong>The</strong> more chloritic<br />
samples collected from <strong>Mount</strong> <strong>Costigan</strong> generally have lower silica (57–70% SiO2) and 7–12%<br />
alkalis, and they plot in the trachyte–trachydacite field (Fig. 8a). Given that most samples show<br />
evidence of extensive alkali mobility (Fig. 8c), classification of rock type should be based on<br />
immobile high-field-strength elements (HFSE) rather than on traditional alkali elements, which<br />
are known to be mobile under hydrothermal conditions and therefore are less reliable.<br />
On the Zr/TiO2 versus Nb/Y discrimination diagram, almost all <strong>Mount</strong> <strong>Costigan</strong> samples plot<br />
well within the rhyolite field and fall in a tight cluster that has Zr/TiO2 values between 0.1 and<br />
0.2, and Nb/Y values between 0.25 and 0.8 (Fig. 9a). <strong>The</strong> very tightly constrained Zr/TiO2<br />
values of the felsic rocks imply that all rocks were sourced from a single magma (Fig. 9b). In<br />
contrast, felsic volcanic samples from the Lewis Brook occurrence are slightly less evolved<br />
and plot in the rhyodacite–dacite field with a lower Zr/TiO2 (Fig. 9a). Data from the Redstone<br />
<strong>Mount</strong>ain Granite collected during this investigation and data compiled from Whalen (1993)<br />
show varied Zr/TiO2 values, with data falling on both the <strong>Mount</strong> <strong>Costigan</strong> and Lewis Brook<br />
arrays (Fig. 9b); however, the absolute Zr and TiO2 contents are closer to those of the Lewis<br />
Brook rocks. <strong>The</strong> Zr/Hf value, which is considered to be a reliable gauge of the degree of<br />
fractionation, indicates that samples from <strong>Mount</strong> <strong>Costigan</strong> have values >35, typical of most<br />
felsic rocks (Watson and Harrison 1983). In contrast, samples from the Lewis Brook occurrence<br />
and the Redstone <strong>Mount</strong>ain Granite have Zr/Hf values ranging from 20 to 34 (Fig. 9c),<br />
suggesting that both have undergone a higher degree of fractionation than the felsic rocks from<br />
the <strong>Mount</strong> <strong>Costigan</strong> deposit.<br />
<strong>The</strong> profiles of rare earth elements (REEs) for analyzed rocks in the <strong>Costigan</strong> <strong>Mount</strong>ain area<br />
are given on Figures 10a to 10f. REE profiles for samples of the <strong>Mount</strong> <strong>Costigan</strong> rhyolite are<br />
characterized by elevated light-REE (LREE) contents, negative Eu anomalies, and relatively<br />
flat heavy-REE (HREE) profiles, all of which are typical of felsic volcanic rocks ( Fig. 10a).<br />
<strong>The</strong> contents of base metals, granophile elements, and precious metals in felsic volcanic rocks<br />
from the <strong>Mount</strong> <strong>Costigan</strong> deposit are summarized as follows (see Table 1 for details).
a<br />
Na O + K O<br />
b<br />
KO<br />
c<br />
Na O + K O<br />
2 2<br />
2<br />
2 2<br />
14<br />
12<br />
10<br />
8<br />
6<br />
4<br />
2<br />
0<br />
14<br />
12<br />
10<br />
8<br />
6<br />
4<br />
2<br />
tephrite basaltic<br />
trachyandesite<br />
basanite<br />
trachybasalt<br />
picrobasalt<br />
basalt<br />
basaltic<br />
andesite<br />
phonotephrite<br />
basalt<br />
tephriphonolite<br />
andesite<br />
trachyandesite<br />
basaltic<br />
andesite<br />
phonolite<br />
dacite<br />
trachyte<br />
andesite<br />
trachydacite<br />
High-K calc-alkaline series<br />
Calc-alkaline series<br />
SiO 2<br />
dacite<br />
Arc tholeiite series<br />
rhyolite<br />
13<br />
0<br />
45 50 55 60 65 70 75 80 85<br />
14<br />
12<br />
10<br />
8<br />
6<br />
4<br />
2<br />
0<br />
40 45 50 55 60 65 70 75 80 85 90<br />
Na-metasomatism<br />
SiO 2<br />
Igneous<br />
spectrum<br />
0 20 40 60 80 100<br />
100 K O/(Na O + K O)<br />
2 2 2<br />
rhyolite<br />
K-metasomatism<br />
<strong>Mount</strong> <strong>Costigan</strong> <strong>Deposit</strong><br />
Felsic volcanic rocks (from surface)<br />
Felsic volcanic rocks (from drill core)<br />
Chloritic fragmental volcanic rocks<br />
Mafic dyke<br />
Sedimentary rocks<br />
Lewis Brook Occurrence<br />
Felsic volcanic rocks<br />
Mafic volcanic rocks<br />
River Dee felsic/mafic volcanic rocks<br />
(Wilson 1992)<br />
Redstone <strong>Mount</strong>ain Granite<br />
(this investigation)<br />
Redstone <strong>Mount</strong>ain Granite<br />
(Whalen 1993)<br />
Figure 8. Major-element<br />
lithogeochemical discrimination<br />
diagrams for rocks from the <strong>Mount</strong><br />
<strong>Costigan</strong>–Lewis Brook area.<br />
a) Na2O + K2Oversus SiO 2,<br />
with<br />
field boundaries from Le Bas et al.<br />
(1986). Values recalculated to<br />
100%-free LOI basis. b) K2O versus<br />
SiO 2,<br />
with field boundaries from Le<br />
Maitre et al. (1989). c) Na2O + K2O versus 100*K2O/(Na2O + K2O), with<br />
field boundaries from Hughes<br />
(1972).
TiO (wt %)<br />
Zr/TiO 2<br />
Zr (ppm)<br />
a<br />
2<br />
1<br />
0.1<br />
0.01<br />
3<br />
2<br />
1<br />
0<br />
Zr/Hf<br />
14<br />
0.001<br />
0.01 0.1 1 10<br />
b<br />
200<br />
100<br />
rhyodacite/dacite<br />
andesite<br />
andesite/basalt<br />
Mass<br />
gain<br />
rhyolite<br />
subalkaline basalt<br />
Mass loss<br />
Nb/Y<br />
comendite/<br />
pantellerite<br />
trachyandesite<br />
alkaline<br />
basalt<br />
phonolite<br />
trachyte<br />
Alteration array<br />
Alteration array<br />
0 100 200 300 400 500 600 700<br />
Zr (ppm)<br />
c<br />
600<br />
Figure 9. Trace-element<br />
lithogeochemical discrimination<br />
diagrams for rocks from the <strong>Mount</strong><br />
500<br />
<strong>Costigan</strong>–Lewis Brook area.<br />
a) Zr/TiO2 versus Nb/Y, with field<br />
400<br />
boundaries from Winchester and<br />
Floyd (1977). b) TiO2<br />
versus Zr.<br />
300<br />
c) Zr versus Zr/Hf.<br />
basanite/<br />
nephelinite<br />
Fractionation curve<br />
0<br />
20 30 40 50<br />
Fractionation curve<br />
<strong>Mount</strong> <strong>Costigan</strong> <strong>Deposit</strong><br />
Felsic volcanic rocks (from surface)<br />
Felsic volcanic rocks (from drill core)<br />
Chloritic fragmental volcanic rocks<br />
Mafic dyke<br />
Sedimentary rocks<br />
Lewis Brook Occurrence<br />
Felsic volcanic rocks<br />
Mafic volcanic rocks<br />
River Dee felsic/mafic volcanic rocks<br />
(Wilson 1992)<br />
Redstone <strong>Mount</strong>ain Granite<br />
(this investigation)<br />
Redstone <strong>Mount</strong>ain Granite<br />
(Whalen 1993)
sample/chondrite<br />
sample/chondrite<br />
sample/chondrite<br />
!<br />
!<br />
!<br />
1000<br />
100<br />
10<br />
1<br />
1000<br />
100<br />
10<br />
1<br />
1000<br />
100<br />
10<br />
1<br />
15<br />
1000<br />
a b<br />
La Ce Pr Nd Pm Sm Eu Gd Tb Dy Ho Er Tm Yb Lu La Ce Pr Nd Pm Sm Eu Gd Tb Dy Ho Er Tm Yb Lu<br />
La Ce Pr Nd Pm Sm Eu Gd Tb Dy Ho Er Tm Yb Lu<br />
La Ce Pr Nd Pm Sm Eu Gd Tb Dy Ho Er Tm Yb Lu<br />
Figure 10. Rare-earth-element data for rocks from the <strong>Mount</strong> <strong>Costigan</strong>–Lewis Brook area. a) <strong>Mount</strong><br />
<strong>Costigan</strong> felsic volcanic rocks. b) <strong>Mount</strong> <strong>Costigan</strong> mafic dyke. c) Lewis Brook felsic volcanic rocks.<br />
d) Lewis Brook mafic volcanic rocks. e) Redstone <strong>Mount</strong>ain Granite. f) <strong>Mount</strong> <strong>Costigan</strong> sedimentary<br />
rocks. Normalization factors in a) to e) are from Nakamura (1974); normalization factors in f) are for the<br />
North American Shale composite (NASC) from Gromet et al. (1984).<br />
sample/NASC<br />
sample/chondrite<br />
Base metals: Cu is 1 ppm to 143 ppm, Zn is 31 ppm to 7950 ppm, Pb is 7 ppm to 2980 ppm.<br />
Granophile elements: Sn is 1 ppm to 20.6 ppm, W is below the detection limit to 25 ppm,<br />
Sb is 1 ppm to 10.5 ppm, Mo is below the detection limit to 3 ppm.<br />
Precious metals: Au is below the detection limit to 90 ppb, Ag is below the detection limit to<br />
3.8 ppm.<br />
sample/chondrite<br />
100<br />
10<br />
1<br />
1000<br />
c d<br />
100<br />
10<br />
10<br />
e f<br />
1<br />
1<br />
0.1<br />
0.01<br />
La Ce Pr Nd Pm Sm Eu Gd Tb Dy Ho Er Tm Yb Lu<br />
La Ce Nd Sm Eu Gd Tb Dy Er Yb Lu
Mafic Dyke<br />
16<br />
One sample of a mafic dyke was collected from the SLAM Exploration drill cores at <strong>Mount</strong><br />
<strong>Costigan</strong>. This sample (CM08-8-48 m; Table 1) from drillhole 8 at a depth of 48 m plots in the<br />
basaltic trachyandesite field on the Na2O + K2O versus SiO2 diagram (Fig. 8a), and in the basalt<br />
field on the K2O versus SiO2 diagram (Fig. 8b). However, like most samples in this investigation,<br />
there is evidence of alkali-element mobility, specifically K2O gain and Na2O loss (Fig. 8c). In<br />
terms of HFSE composition, sample CM08-8-48 m plots in the subalkaline basalt field (Fig. 9a)<br />
and has a Zr/TiO2 value of ~0.01, similar to basalts from the Lewis Brook occurrence (Fig. 9a).<br />
<strong>The</strong> REE profile for this sample (Fig. 10b) is slightly LREE-enriched and has no significant Eu<br />
anomaly. This is similar to the Lewis Brook mafic volcanic rocks (Fig. 10d), except that the<br />
absolute REE content is somewhat higher in the <strong>Mount</strong> <strong>Costigan</strong> sample.<br />
Sedimentary Rocks<br />
<strong>The</strong> two samples of sedimentary rock from the <strong>Mount</strong> <strong>Costigan</strong> drill cores (CM08-4-222a,<br />
CM08-4-222b) have high K (up to 11%) and moderate SiO2 (57–59%) contents. <strong>The</strong> North<br />
American Shale Composite (NASC)-normalized REE data for both samples plot close to parity<br />
for all REEs (Fig. 10f). <strong>The</strong>se rocks have Zr/TiO2 values of ~0.02 (Fig. 9a, 9b), similar to<br />
compositions of sedimentary rocks from elsewhere in the Tobique Group (Walker 2005).<br />
Lewis Brook Occurrence<br />
Felsic Volcanic Rocks<br />
<strong>The</strong> felsic volcanic rocks from the Lewis Brook <strong>Zn–Pb–Ag</strong> vein system plot within the rhyolite<br />
field on major-element discrimination diagrams (Fig. 8a). With the exception of one<br />
anomalously low sample, these rocks have SiO2 contents of 70–75%, total alkali contents of<br />
8–9%, and K2O contents of 5–9% (Fig. 8a, 8b). Like the rhyolite from <strong>Mount</strong> <strong>Costigan</strong>, most<br />
Lewis Brook samples have alkali-element contents that lie outside the range of normal<br />
volcanic rocks, suggesting they have undergone hydrothermal alteration (Fig. 8c).<br />
<strong>The</strong> Lewis Brook felsic volcanic rocks have Zr/TiO2 values of ~0.08, consistent with a<br />
rhyodacitic composition (Fig. 9a) and similar to most samples from the Redstone <strong>Mount</strong>ain<br />
Granite (see below). <strong>The</strong> Zr contents of these rocks range between 92 ppm and 186 ppm,<br />
considerably lower than most rhyolite samples from the <strong>Mount</strong> <strong>Costigan</strong> deposit. Similarly, the<br />
TiO2 contents of the Lewis Brook rhyodacite (average 0.18%) are marginally lower than those<br />
of the <strong>Mount</strong> <strong>Costigan</strong> rhyolite, which average 0.29% (Fig. 9b).<br />
<strong>The</strong> Zr/Hf values of the Lewis Brook rhyodacite range between 26 and 34 and are similar to<br />
the range of Zr/Hf values from the Redstone <strong>Mount</strong>ain Granite (see below; Fig. 9c). <strong>The</strong>se<br />
ratios are lower than those of the <strong>Mount</strong> <strong>Costigan</strong> rhyolite and may represent a marginally<br />
more fractionated source magma. <strong>The</strong> Lewis Brook rhyodacite samples are divisible into two<br />
populations on the basis of REE content (Fig. 10c). <strong>The</strong> first population contains three samples<br />
that are LREE-enriched and have moderate negative Eu anomalies. <strong>The</strong> second population
17<br />
contains two samples that have flatter profiles (less LREE enrichment) and more prominent<br />
negative Eu anomalies (Fig. 10c).<br />
<strong>The</strong> contents of base metals, granophile elements, and precious metals in samples of the<br />
Lewis Brook rhyodacite are summarized as follows (see Table 2 for details).<br />
� Base metals: Cu is 4 ppm to 1452 ppm, Zn is 9 ppm to 30 062 ppm, Pb is 22 ppm to 770 ppm.<br />
� Granophile elements: W is at or below the detection limit, Sn is 3 ppm to 7 ppm, Mo is<br />
1.7 ppm to 6.9 ppm, Sb is 1.3 ppm to 3.9 ppm.<br />
� Precious metals: Au is below the detection limit to 211 ppb, Ag is at the detection limit to<br />
5.2 ppm.<br />
Mafic Volcanic Rocks<br />
Mafic volcanic rocks from the Lewis Brook <strong>Zn–Pb–Ag</strong> vein system have typical to slightly<br />
elevated (Na2O + K2O) contents of 6–10%, and SiO2 contents of 41–60%. <strong>The</strong>y plot across the<br />
basaltic trachyandesite and phonotephrite fields on the Na2O + K2O versus SiO2 diagram (Fig.<br />
8a). As with felsic volcanic rocks from the Lewis Brook occurrence, some of these mafic<br />
volcanic rocks show evidence (high K2O relative to Na2O) of alkali-element mobility (Fig. 8b, 8c).<br />
In terms of HFSE contents (Zr/TiO2 and Nb/Y), these samples plot near the boundary between<br />
the subalkaline basalt and andesite–basalt fields (Fig. 9a). <strong>The</strong> Zr/Y versus Zr values of these<br />
rocks are typical of within-plate basalts (Pearce and Norry 1979) and are consistent with those<br />
of mafic volcanic rocks elsewhere in the Tobique Group (Dostal et al. 1989; Wilson 1992;<br />
Walker 2005). Chondrite-normalized REE profiles for these rocks have gentle negative slopes<br />
and Eu/Eu* values of near unity: that is, they show no appreciable Eu anomaly (Fig. 10d). <strong>The</strong><br />
absence of a Eu anomaly suggests that the magma from which the basalt erupted did not<br />
undergo significant crystal fractionation of plagioclase.<br />
Redstone <strong>Mount</strong>ain Granite<br />
Samples of the Redstone <strong>Mount</strong>ain Granite contain 72–78% SiO2 and 6–9% total alkalis (Fig.<br />
8a), with K2O contents ranging from the detection limit to 5.5% (Fig. 8b). In contrast with the<br />
felsic volcanic rocks described above, the alkali-element contents of the Redstone <strong>Mount</strong>ain<br />
Granite fall near the spectrum of typical felsic igneous rocks, indicating that they have not<br />
undergone significant alkali-element metasomatism related to hydrothermal alteration (Fig. 8c).<br />
In terms of their HFSE content, samples of the Redstone <strong>Mount</strong>ain Granite show some<br />
variation. Three fall in the rhyolite field (Fig. 9a, 9b) and have Zr/TiO2 values of ~0.2,<br />
overlapping the majority of rhyolite samples from <strong>Mount</strong> <strong>Costigan</strong>; the remaining samples fall in<br />
the rhyodacite–dacite field (Fig. 9a, 9b) and have Zr/TiO2 values of ~0.08, overlapping the field<br />
of Lewis Brook samples. Most samples of Redstone <strong>Mount</strong>ain Granite have Zr/Hf values ≤35,<br />
similar to those of the Lewis Brook rhyodacite. <strong>The</strong>se data suggest that the Redstone <strong>Mount</strong>ain<br />
Granite is chemically more similar to rhyodacite from the stratigraphically higher Lewis Brook area<br />
than to rhyolite from <strong>Mount</strong> <strong>Costigan</strong>. <strong>The</strong> Redstone <strong>Mount</strong>ain Granite may have undergone a
18<br />
greater degree of fractionation than the source magma of the <strong>Mount</strong> <strong>Costigan</strong> rhyolite. REE<br />
profiles of the Redstone <strong>Mount</strong>ain Granite are LREE-enriched and display moderately<br />
negative Eu anomalies (Fig. 10e). Overall, REE profiles of the granite are similar to those of<br />
rhyolite from the <strong>Mount</strong> <strong>Costigan</strong> deposit and of the three LREE-enriched rhyodacite samples<br />
from the Lewis Brook occurrence (Fig. 10a, 10c).<br />
<strong>The</strong> contents of base metals and granophile elements in samples of the Redstone <strong>Mount</strong>ain<br />
Granite are summarized as follows (see Table 3 for details).<br />
� Base metals: Pb is low (several samples lie below the detection limit), Zn is relatively low<br />
(5–28 ppm), Cu content is very low (1–6 ppm).<br />
� Granophile elements: W is low (
19<br />
Results of mass change calculations are presented on Figures 11a to 11g. <strong>The</strong> majority of<br />
felsic volcanic rocks hosting the <strong>Mount</strong> <strong>Costigan</strong> deposit have undergone addition of K2O<br />
(+1 wt % to +6 wt %) and varied loss or gain of CaO (-0.02 wt % to +0.35 wt %). Most<br />
samples have gained MnO (0 wt % to +0.3 wt %). Some samples have undergone MgO loss<br />
with many more gaining MgO (-1 wt % to +3 wt %). Mass addition of MgO is associated with<br />
the more permeable fragmental units and with the margins of larger sulphide veins, and is<br />
coincident with the development of chlorite. All samples exhibit mass losses of Na2O (-2.0 wt<br />
% to -3.5 wt %), Al2O3 (0 wt % to -5 wt %), and SiO2 (0 wt % to -50 wt %). Although some<br />
samples show mass gain of Fe2O3 (total) , most exhibit mass loss with overall mass change<br />
ranging between +1 wt % and -1.8 wt %.<br />
All of the samples analyzed, regardless of their proximity to visible alteration or mineralization,<br />
have lost Na2O and gained K2O. Such widespread alteration is attributed to relatively low-<br />
temperature (
ΔCaO wt %<br />
ΔFe O wt %<br />
2 3<br />
ΔKOwt %<br />
ΔAl O wt %<br />
2<br />
2 3<br />
0.4<br />
0.3<br />
0.2<br />
0.1<br />
0.0<br />
-0.1<br />
1<br />
0<br />
-1<br />
-2<br />
6<br />
4<br />
2<br />
0<br />
-2<br />
-4<br />
10<br />
5<br />
0<br />
-5<br />
Calcite formation<br />
Pyrite<br />
precipitation<br />
K-feldspar<br />
(adularia)<br />
formation<br />
Fe-leaching<br />
-10<br />
-100 -50 0 50 100<br />
SiO 2<br />
20<br />
ΔMnO wt %<br />
0.4<br />
0.3<br />
0.2<br />
0.1<br />
0.0<br />
RDR = 0.05 wt % RDR = 0.05 wt %<br />
RDR = 2.68 wt %<br />
RDR = 4.02 wt %<br />
RDR = 12.57 wt %<br />
RDR = 75.6 wt %<br />
ΔMgO wt %<br />
ΔNa O wt %<br />
2<br />
-0.1<br />
3<br />
2<br />
1<br />
0<br />
-1<br />
-2<br />
1<br />
0<br />
-1<br />
-2<br />
-3<br />
Mn-carbonate<br />
formation<br />
a b<br />
c<br />
Chlorite<br />
formation<br />
Feldspardestructive<br />
alteration<br />
Si-leaching<br />
-4<br />
-100 -50 0 50 100<br />
SiO 2<br />
RDR = 1.17 wt %<br />
e f<br />
g<br />
RDR = 3.47 wt %<br />
<strong>Mount</strong> <strong>Costigan</strong> felsic volcanic rocks (from surface)<br />
<strong>Mount</strong> <strong>Costigan</strong> felsic volcanic rocks (from drill core)<br />
RDR<br />
River Dee rhyolite<br />
Figure 11. Graphic presentation of mass<br />
balance data for host rocks from the <strong>Mount</strong><br />
<strong>Costigan</strong> deposit. <strong>The</strong> diagrams show SiO2 on<br />
the x-axis plotted against a) CaO, b) MnO,<br />
c) Fe2O 3, d) MgO, e) K2O, f) Na2O, or g) Al2O3 on the y-axis.<br />
d
200 μm<br />
21<br />
Rhodochrosite<br />
(Mn-carbonate)<br />
Quartz.<br />
a<br />
Adularia<br />
(K-feldspar)<br />
Figure 12. Hydrothermal alteration in rock samples from the <strong>Mount</strong> <strong>Costigan</strong> deposit.<br />
a) Photomicrograph showing alteration minerals (adularia and rhodochrosite) in sample of felsic<br />
volcanic rock from DDH CM08-8 at 54 m. Field of view is ~350 μm.<br />
b) Backscatter electron microprobe<br />
image of hydrothermal alteration (adularia, rhodochrosite, and chlorite) in sample CM08-8-54 m.<br />
Microprobe data for sample points 1 to 5 are presented in Table 4.<br />
b
22<br />
Despite the abundance of quartz-veining associated with near-surface base metal<br />
mineralization, all but two samples have undergone SiO2 loss (0 wt % to -40 wt %). It is<br />
hypothesized that SiO2 was leached from the host rocks during ascent of base metal-bearing<br />
fluids and subsequently precipitated as quartz along with base metal sulphides upon cooling<br />
and possible mixing with seawater in shallower parts of the system.<br />
MINERALIZATION<br />
Base metal mineralization at <strong>Mount</strong> <strong>Costigan</strong> is epigenetic and hosted dominantly by<br />
heterolithic, matrix-supported felsic lapilli tuff containing fragments that range from 3 mm to<br />
>10 cm in long axis. Fragment content is varied, at 5–20 volume %; however, this<br />
percentage may be higher in some sections, as alteration may obscure primary textures<br />
(Fig. 13a–13c). Surface exposures, where these rocks are cut by numerous quartz veins,<br />
were referred to as ‘vent breccia’ by Fyffe and Pronk (1985). Less commonly, mineralization<br />
occurs as massive sulphide veins that transect rhyolitic flows and locally parallel flowlayering<br />
(Fig. 5c, 13a).<br />
According to earlier workers (Crevier 1984; Fyffe and Pronk 1985), the <strong>Mount</strong> <strong>Costigan</strong><br />
deposit contains a non-NI 43-101-compliant resource of 6–8 Mt of mineralized rock. Within<br />
this envelope of mineralization, a higher grade ‘Core Zone’ was identified (Clark 2008). This<br />
zone comes to surface along its entire length and in section is irregularly shaped (Fig. 3). It is<br />
a tabular body with a north–south strike length of ~150 m, an east–west thickness that ranges<br />
from 4 m to 36 m, and a depth that extends to 200 m. It is not clear what, if any, role structural<br />
breaks exert on the deposit orientation or on the mineralization in the Core Zone, as there is<br />
no evidence for north–south faulting. Furthermore, the absence of north–south-directed<br />
drilling precludes the identification of an east–west-oriented fault, should one be present.<br />
Although no formal tonnages or grade estimates have been published for the Core Zone, a<br />
non-NI 43-101-compliant resource of ~0.9 Mt grading 4–5% Zn + Pb was estimated by Clark<br />
(2008). Drill-core logging and petrographic examination indicate that the mineralogy of the<br />
<strong>Mount</strong> <strong>Costigan</strong> deposit is relatively simple and dominated by sphalerite and subordinate<br />
galena. Pyrite is present but not in significant amounts, and chalcopyrite occurs as a trace<br />
phase.<br />
Some results of the present investigation are consistent with those of earlier workers (Crevier<br />
1984; Fyffe and Pronk 1985; Cox 1990), who have described a roughly elliptical mineralized<br />
area with a short axis extending for ~200 m along a north-northeast to south-southwest line<br />
and a long axis extending ~340 m east–west, at a high angle to regional strike. Mineralization<br />
has been intersected at depths of up to 300 m below surface (Fig. 3). However, in contrast to<br />
previous interpretations of an eastward-plunging zone of mineralization (Fyffe and Pronk<br />
1985; Cox 1990), this investigation suggests that the zone of alteration and mineralization,<br />
although irregular, is more or less subvertical to a depth of 300 m. This irregularity is attributed<br />
to stratigraphic variations in primary permeability, which exert significant control on the<br />
distribution of sulphide mineralization (Fig. 3). Sedimentary units intercalated with the volcanic<br />
rocks are commonly barren and may have acted as barriers to mineralizing fluids during
Figure 13. Mineralization and<br />
alteration in drill core samples from<br />
the <strong>Mount</strong> <strong>Costigan</strong> deposit. a) Vein<br />
galena–sphalerite and minor pyrite<br />
cutting chlorite-altered rhyolite from<br />
DDH CM08-4 at 75 m.<br />
Figure 13. b) Chlorite–silica–<br />
carbonate-altered breccia with patchy<br />
sphalerite and galena from DDH<br />
CM08-4 at 24 m.<br />
Figure 13. c) Rhyolite-clast breccia<br />
with quartz and minor Fe-carbonate<br />
(siderite) cement from DDH CM08-8<br />
at 120 m.<br />
23<br />
Galena<br />
Galena<br />
Galena<br />
Sphalerite<br />
Fe-carbonate<br />
a<br />
Sphalerite<br />
CM08-4<br />
b<br />
c<br />
Sphalerite
24<br />
their egress to the seafloor. Base metal zoning at <strong>Mount</strong> <strong>Costigan</strong> exists only in terms of a<br />
higher grade (>4% Zn + Pb) Core Zone and a lower grade periphery.<br />
Sulphide mineralization occurs in two forms: 1) as finely disseminated grains (
W ppm<br />
30<br />
20<br />
10<br />
25<br />
0<br />
0 5 10 15 20<br />
Sn ppm<br />
Figure 14. a) Pb–Cu–Zn ternary diagram for assay data from the <strong>Mount</strong> <strong>Costigan</strong> deposit. b) W versus<br />
Sn diagram for data from the <strong>Mount</strong> <strong>Costigan</strong> deposit, Lewis Brook occurrence, and Redstone<br />
<strong>Mount</strong>ain Granite.<br />
also anomalous and range from 1 ppm to 15.1 ppm. Au contents range from below the<br />
detection limit to a maximum of 90 ppb, whereas Ag contents range from 0.8 ppm to 3.4 ppm<br />
(Table 1).<br />
SAMPLE ANALYSES<br />
Sulphur Isotope Analysis<br />
Cu %<br />
Pb % Zn %<br />
Part of this investigation involved collecting a limited number of samples for sulphur isotope<br />
analysis (Table 5). Sampling included mineral separates (sphalerite and galena) as well as<br />
bulk sulphide samples (pyrite + galena + sphalerite). <strong>The</strong> purpose of this work was to estimate<br />
the temperature of formation for mineralization and to determine what, if any, systematic<br />
sulphur zoning occurs in the <strong>Mount</strong> <strong>Costigan</strong> deposit.<br />
Although few samples were analyzed, the data show that S for bulk sulphur increases<br />
slightly with depth. In the near-surface samples (20.9 m, 73.0 m, and 111.5 m), bulk sulphur<br />
ranges between +9.2‰ and +9.72‰, consistent with sulphide in equilibrium with seawater,<br />
δ 34<br />
a<br />
<strong>Mount</strong> <strong>Costigan</strong> chloritic<br />
fragmental volcanic rocks<br />
<strong>Mount</strong> <strong>Costigan</strong> felsic volcanic<br />
rocks (from drill core)<br />
Lewis Brook felsic<br />
volcanic rocks<br />
Lewis Brook mafic<br />
volcanic rocks<br />
Redstone <strong>Mount</strong>ain Granite
26<br />
according to the global seawater curve for the Early Devonian (Fig. 15; Goodfellow et al.<br />
1993). Likewise, the δ 34 S values for sphalerite and galena separates (Table 5) are coincident<br />
with the global seawater curve and define the maxima and minima, respectively, of the bulk<br />
data. At depth (187.2 m), the δ 34 S for bulk sulphur is lower (7.38‰; Table 5) and falls off the<br />
global seawater curve (Fig. 15). This may be interpreted to suggest a greater magmatic<br />
component in mineralizing fluids deeper in the system; however, results of a single analysis<br />
preclude a conclusive determination. Similar δ 34 S values were reported for sulphide separates<br />
from the Shingle Gulch East deposit (URN 878) (Fig. 1; Walker 2005), located approximately<br />
10 km along strike to the north-northeast of the <strong>Mount</strong> <strong>Costigan</strong> deposit, and were interpreted<br />
to reflect the mixing of magmatic fluid (80%) with seawater (20%).<br />
Table 5. Sulphur isotope data for bulk sulphides, and for sphalerite and galena separates, from the<br />
<strong>Mount</strong> <strong>Costigan</strong> deposit.<br />
Sample Number Bulk Sulphides or Mineral Separates δ 34 S δ 34 Ssph–δ 34 Sga<br />
CM08-11-20.9-B bulk 9.72<br />
CM08-11-20.9-Ga galena 9.05<br />
CM08-11-20.9-Zn sphalerite 10.71 1.66<br />
CM08-4-73-B bulk 9.91<br />
CM08-4-73-Ga galena 7.57 2.49<br />
CM08-4-73-Zn sphalerite 10.06<br />
CM08-8-111.5-B bulk 9.20<br />
CM08-8-111.5-B bulk 9.58<br />
CM08-8-111.5-Ga galena 7.32 2.75<br />
CM08-8-111.5-Zn sphalerite 10.07<br />
CM08-4-178.4-B bulk 7.38<br />
CM08-4-178.4-Ga galena 5.92 0.78<br />
CM08-4-178.4-Zn sphalerite 6.70<br />
Note: Sulphur isotope analysis conducted by Alison Pye, Stable Isotope Laboratory, Memorial University of<br />
<strong>New</strong>foundland, St. John’s, <strong>New</strong>foundland and Labrador.<br />
Although no comprehensive set of bulk sulphur or δ 34 S data exists for Siluro–Devonian<br />
intrusions in the report area, similar Late Silurian to Early Devonian felsic intrusions in<br />
southwestern <strong>New</strong> Brunswick display a wide range of δ 34 S values (-7.1‰ to +13‰) and<br />
average +2.2‰ ± 0.5‰ (Yang and Lentz 2010). Assuming similar values for the Redstone<br />
<strong>Mount</strong>ain Granite, the moderately positive δ 34 S contents of bulk sulphur (+9.2‰ to +9.72‰) in<br />
the sulphides suggest that the fluids (or fluid) involved in the mineralizing system were not<br />
dominated by magmatic sulphur, contrary to what would be expected for a magmatically<br />
derived mineralized vent breccia system. <strong>The</strong> consistency with seawater sulphide values for<br />
the Early Devonian (i.e., the age of the host sequence) leads to the conclusion that<br />
mineralizing fluids interacted with seawater directly, or acquired sulphur from sulphide<br />
minerals that were deposited in equilibrium with seawater.
27<br />
Four pairs of coexisting galena and sphalerite grains were collected for δ 34 S isotopic analysis<br />
in order to calculate temperature of formation. Two of these pairs (from 73.0 m and 111.5 m)<br />
yielded temperatures of formation, based on the calculation of Grootenboer and Schwarcz<br />
(1969), of 242°C and 217°C, respectively, although a higher (≤294°C) temperature can be<br />
calculated using the equilibrium equations of other authors (Table 6). <strong>The</strong>se temperatures are<br />
consistent with mineralogical constraints on the temperature of formation presented later in<br />
this report. Two other sphalerite–galena pairs (from 20.9 m and 178.4 m) returned calculated<br />
temperatures of formation of 357°C and 647°C, respectively. <strong>The</strong>se temperatures are<br />
considerably higher than those calculated from the other samples and likely reflect sampling<br />
from sulphide pairs that were not coprecipitated (i.e., were not in isotopic equilibrium).<br />
Table 6. Temperatures of formation calculated from δ 34 S data for sphalerite and galena separates from<br />
the <strong>Mount</strong> <strong>Costigan</strong> deposit (see Table 5).<br />
∆ 34 S = 34 Ssph– 34 Sga<br />
Kajiwara and<br />
Krouse (1971)<br />
o C<br />
Czamanske and<br />
Rye (1974)<br />
o C<br />
Grootenboer and<br />
Schwarcz (1969)<br />
1.66 421 376 357<br />
2.49 294 257 242<br />
2.75 266 231 217<br />
0.78 740 674 647<br />
Radiogenic Lead Isotope Analysis<br />
Lead isotope studies can be effective tools for determining the various sources of Pb and<br />
relative contributions of these sources to mineralizing systems and host rocks. This is possible<br />
because Th and U behave similarly in the magmatic environment in that, during partial melting<br />
and fractional crystallization, both are concentrated in the fluid phase relative to the residuum<br />
(Faure 1986). However, in the realm of aqueous hydrothermal fluids, U is concentrated in the<br />
fluid phase, whereas Th is highly insoluble and remains in the residuum. Likewise, under<br />
oxidizing conditions, U is highly soluble and is easily fractionated from Th (Faure 1986).<br />
<strong>The</strong> <strong>Mount</strong> <strong>Costigan</strong> galena separates display high 207 Pb/ 204 Pb values and plot above the<br />
upper crust evolutionary curve of Zartman and Doe (1981) on a 207 Pb/ 204 Pb versus 206 Pb/ 204 Pb<br />
diagram (Fig. 16a), close to the fields of Avalonian basement (Ayuso and Bevier 1991) and<br />
Siluro–Devonian Ganderian plutons (Whalen et al. 1996). All but one of the galena separates<br />
from the Sewell Brook and Shingle Gulch deposits cluster around the <strong>Mount</strong> <strong>Costigan</strong><br />
samples, suggesting that Pb in all three deposits shares a common source. <strong>The</strong> array defined<br />
by the galena separates (n = 7) has a Spearman Rank Correlation coefficient (r’) of 0.86, a<br />
slope of 1.09, and an x-intercept of 4.18. In contrast to the galena separates, host rocks from<br />
the <strong>Mount</strong> <strong>Costigan</strong> deposit have lower 207 Pb/ 204 Pb values and plot between the orogene and<br />
mantle curves, overlapping the field of the Grenvillian basement (Ayuso and Bevier 1991).<br />
Host volcanic rocks from Sewell Brook and Shingle Gulch lie more or less along the same<br />
array as the <strong>Mount</strong> <strong>Costigan</strong> samples. <strong>The</strong> array defined by the host rock samples (n = 16)<br />
has an r’ value of 0.79 and falls on a line with a slope of 0.18 and an x-intercept of 1.23. This<br />
o C
Tertiary<br />
Cretaceous<br />
Jurassic<br />
Triassic<br />
Permian<br />
Pennsylvanian<br />
Mississippian<br />
Devonian<br />
Silurian<br />
Ordovician<br />
Cambrian<br />
Proterozoic<br />
U<br />
M<br />
L<br />
U<br />
M<br />
L<br />
U<br />
M<br />
L<br />
*<br />
0 +10 +20 +30 +40<br />
Galena<br />
28<br />
(Diagram modified from<br />
Goodfellow et al. 1993.)<br />
Sphalerite<br />
Bulk<br />
Stratified water column<br />
with anoxic waters<br />
<strong>Deposit</strong>ion time<br />
of the Tobique Group<br />
Range of bulk<br />
sulphur analyses<br />
δ 34 S (CDT)<br />
‰<br />
Marine Evaporites<br />
(Claypool et al. 1980)<br />
Barite, Selwyn Basin<br />
(Goodfellow and Jonasson 1984)<br />
Bulk = mixture of pyrite, galena, and sphalerite<br />
Pyrite, Selwyn Basin<br />
(Goodfellow and Jonasson 1984;<br />
Shanks et al. 1987)<br />
34<br />
Figure 15. Seawater sulphur isotope curve through time, showing the δ S contents of marine evaporites,<br />
34<br />
barite, and pyrite from the Selwyn Basin. Diagram indicates the approximate δ S contents of galena and<br />
sphalerite (red dots), and bulk sulphur (blue bar) from the Shingle Gulch East deposit.<br />
trend is interpreted to reflect mixing of orogenic and upper crustal Pb. <strong>The</strong> overlap with both<br />
Grenvillian and Avalonian basement fields might be explained by magma generation in<br />
Grenvillian rocks and subsequent crustal contamination by Avalonian rocks during the<br />
magma ascent.<br />
208 204 206 204<br />
On a Pb/ Pb versus Pb/ Pb diagram (Fig. 16b), galena separates from the <strong>Mount</strong><br />
<strong>Costigan</strong>, Shingle Gulch, and Sewell Brook deposits fall well above the orogene curve, close<br />
to the intersection of the fields of Avalonian and Grenvillian basement. <strong>The</strong> felsic and mafic<br />
volcanic and sedimentary rock samples plot along an array that begins below the upper crust<br />
evolutionary curve and extends above the curve where it overlaps the lower part of the field<br />
defined by the galena separates. All samples overlap, in part, the field of Grenvillian<br />
basement and the field of Humber Zone and Dunnage Zone plutons (Whalen et al. 1994).<br />
208 204<br />
However, the host rocks from <strong>Mount</strong> <strong>Costigan</strong> have lower Pb/ Pb values, at or below the<br />
field of Grenvillian basement, and some samples from the Shingle Gulch deposit have higher<br />
208 204<br />
Pb/ Pb values and plot in the fields of Avalonian basement and Gander Zone plutons.<br />
*
Pb/ Pb<br />
Pb/ Pb<br />
207 204<br />
208 204<br />
15.9<br />
15.8<br />
15.7<br />
15.6<br />
15.5<br />
15.4<br />
15.3<br />
39<br />
38<br />
37<br />
sedimentary<br />
felsic volcanic<br />
mafic volcanic<br />
mineralization<br />
upper crust<br />
Grenvillian<br />
basement<br />
lower crust<br />
orogene<br />
Grenvillian<br />
basement<br />
mantle<br />
100<br />
700<br />
1000<br />
0<br />
900<br />
mantle<br />
Field of Siluro–Devonian Gander<br />
Zone plutons (Whalen et al. 1996)<br />
18 206 204<br />
19<br />
100<br />
1000<br />
500<br />
Pb/ Pb<br />
300<br />
Avalonian<br />
basement<br />
200<br />
100<br />
400<br />
0<br />
Field of Humber Zone and Dunnage<br />
Zone plutons (Whalen et al. 1994)<br />
200<br />
18 206 204<br />
19<br />
100<br />
Pb/ Pb<br />
Shingle Gulch Sewell Brook<br />
0<br />
Field of Siluro–Devonian Gander<br />
Zone plutons (Whalen et al. 1996)<br />
Field of Humber Zone and Dunnage<br />
Zone plutons (Whalen et al. 1994)<br />
300<br />
39.25 39.70<br />
upper crust 200<br />
<strong>Mount</strong> <strong>Costigan</strong><br />
29<br />
600<br />
Avalonian<br />
basement<br />
400<br />
100<br />
orogene<br />
BMC sulphide standard<br />
Redstone <strong>Mount</strong>ain Granite<br />
Age along curve in<br />
100 Ma increments<br />
Figure 16. Radiogenic lead isotope diagrams for host rocks and mineralization from the <strong>Mount</strong><br />
207 204 206 204 208 204<br />
<strong>Costigan</strong>, Shingle Gulch, and Sewell Brook deposits. a) Pb/ Pb versus Pb/ Pb. b) Pb/ Pb<br />
206 204<br />
versus Pb/ Pb. Fields of Avalonian and Grenvillian basement are from Ayuso and Bevier (1991).<br />
Lead evolutionary curves are from Zartman and Doe (1981).<br />
0<br />
a<br />
b
30<br />
<strong>The</strong> lead isotope data presented herein suggest that the host volcanic rocks at <strong>Mount</strong><br />
<strong>Costigan</strong> are less radiogenic (i.e., have lower 207 Pb/ 204 Pb values) than most rocks from<br />
elsewhere in the Chaleur Bay Synclinorium, implying that their magmas were sourced from<br />
material similar to Grenvillian crust. Grenvillian basement is not known to underlie the Chaleur<br />
Bay Synclinorium; however, Late Ordovician to Early Silurian clastic and carbonate<br />
sedimentary rocks of the Matapedia Group, which conformably underlies the Chaleur Bay<br />
Synclinorium to the west and north of the Rocky Brook–Millstream Fault (Fig. 1, inset), were<br />
sourced from Laurentia and potentially contain a large component of Grenville-derived<br />
sediment. This Grenvillian detritus would have retained the 208 Pb/ 204 Pb value of the parent<br />
material but presumably would have lower 207 Pb/ 204 Pb values because of U loss during the<br />
weathering process (oxidation and aqueous transport). <strong>The</strong> array defined by the host rock<br />
data (Fig. 16a) may be interpreted to represent contamination of the source magmas by upper<br />
crustal material having Grenville-like lead isotope signatures. It is noteworthy that sedimentary<br />
rocks from stratigraphically higher units, such as the Shingle Gulch deposit, have higher<br />
uranogenic ( 207 Pb/ 204 Pb) and thorogenic ( 208 Pb/ 204 Pb) Pb contents. This trend can be<br />
explained by an increasing percentage of Avalon-sourced sedimentary input over time.<br />
<strong>The</strong> lead isotope data from sulphide mineralization contrast sharply with those of the host<br />
rocks. <strong>The</strong> more uranogenic (higher 207 Pb/ 204 Pb) Pb in galena separates is similar to values in<br />
Avalonian basement and/or Siluro–Devonian Ganderian plutons (Fig. 16a). For example, the<br />
Redstone <strong>Mount</strong>ain Granite has 207 Pb/ 204 Pb values similar to those in galena from the <strong>Mount</strong><br />
<strong>Costigan</strong> deposit. It is possible that the higher uranogenic Pb in sulphide minerals is due to<br />
addition of U from hydrothermal fluids. If the mineralizing hydrothermal fluids were sourced<br />
from a felsic magma such as the Redstone <strong>Mount</strong>ain Granite, then the fluid and any<br />
mineralization precipitated from it would have a higher 207 Pb/ 204 Pb value. In contrast, the<br />
208 Pb/ 204 Pb in sulphide minerals would be lower than that of the source intrusion, because the<br />
solubility of Th in hydrothermal fluid is lower than that of U. Consistency in the isotopic ratios<br />
displayed by mineralization from all three deposits implies that the Pb source was the same<br />
and suggests no indication of a mixed-source Pb.<br />
Given the much higher values of 208 Pb/ 204 207 204 206 204<br />
Pb, Pb/ Pb, and Pb/ Pb for the Redstone<br />
<strong>Mount</strong>ain Granite, it is unlikely that this intrusion was the source magma for the host volcanic<br />
rocks at <strong>Mount</strong> <strong>Costigan</strong>. However, no lead isotope data have been reported for the Lewis<br />
Brook area, so no comparison can be made with the Redstone <strong>Mount</strong>ain Granite.<br />
DISCUSSION<br />
<strong>The</strong> sulphide mineralogy at <strong>Mount</strong> <strong>Costigan</strong> is dominated by sphalerite and galena with a<br />
Zn:Pb ratio of ~2. In most mineralized intervals, pyrite is volumetrically subordinate to Zn and<br />
Pb sulphides, and chalcopyrite occurs only in trace amounts. <strong>The</strong> relatively light colour of<br />
sphalerite, which ranges from reddish brown to pale yellow, is attributed to a low Fe content<br />
and is consistent with the low concentration of pyrite in the system. In addition to containing<br />
Zn and Pb, many of the analyzed samples (Table 1) have anomalous concentrations of the<br />
granophile elements W, Sn, Sb, and Au. During petrographic analysis, neither Au nor primary
31<br />
W, Sn, Sb, and Au. During petrographic analysis, neither Au nor primary W, Sn, and Sb<br />
minerals were recognized. <strong>The</strong>refore, it is assumed that these elements occur as trace<br />
constituents in sulphide phases (sphalerite, galena, pyrite), although the microanalytical work<br />
necessary to confirm this has not been completed. <strong>The</strong> elevated granophile-element content<br />
is consistent with a felsic source.<br />
Copper is notable by its almost complete absence at the <strong>Mount</strong> <strong>Costigan</strong> deposit. Only a few tiny<br />
grains were identified in thin section, and ‘chalcopyrite disease’ (microscale inclusions of<br />
chalcopyrite in sphalerite) is all but absent. Although the genesis of chalcopyrite disease is still open<br />
to debate, the generally accepted hypothesis is that it results, not from exsolution, but instead<br />
from the interaction of early-formed sphalerite with later Cu-rich hydrothermal fluid (Barton and<br />
Bethke 1987). Consequently, assuming that mineralizing fluids have access to Cu in their source<br />
area, the absence of chalcopyrite disease is generally taken as evidence of low-temperature<br />
sphalerite formation, without subsequent interaction with higher temperature Cu-bearing fluids.<br />
Assuming 1) that the hydrothermal fluid responsible for generating the <strong>Mount</strong> <strong>Costigan</strong> deposit<br />
was Cl-rich (ΣCl = one molar), which is likely, given the shallow marine setting in which the<br />
host rocks were deposited, and 2) that a minimum concentration of 1 ppm of each ore metal is<br />
required in the fluid to form a deposit, then a fluid with a temperature of ≤200°C and a pH of<br />
Cordilleran Epithermal Au–Ag <strong>Deposit</strong><br />
Model (Panteleyev 1988)<br />
<strong>Mount</strong> <strong>Costigan</strong> <strong>Deposit</strong><br />
and Lewis Brook Occurrence<br />
Silica cap<br />
Clay alunite cap<br />
Argillic to Phyllic Zone:<br />
clays (illite, sericite at depth)<br />
4 km<br />
silica (banded<br />
and brecciated)<br />
Propylitic Zone: chlorite, illite,<br />
montmorillonite, carbonate, epidote<br />
<strong>Mount</strong> <strong>Costigan</strong> deposit:<br />
present erosional level<br />
boiling<br />
zone<br />
Lewis Brook <strong>Zn–Pb–Ag</strong><br />
occurrence<br />
quartz, adularia, pyrite, sericite,<br />
calcite, chlorite, rhodochrosite,<br />
fluorite, argentite, electrum<br />
precious<br />
metal<br />
zone<br />
boiling<br />
level<br />
quartz, pyrite, chlorite,<br />
hematite,<br />
fluorite, galena, sphalerite,<br />
chalcopyrite,<br />
argentite<br />
base<br />
metal<br />
zone<br />
350 m<br />
quartz, siderite, pyrite,<br />
pyrrhotite,<br />
arsenopyrite, fluorite,<br />
chalcopyrite,<br />
argentite<br />
<strong>Costigan</strong> <strong>Mount</strong>ain Formation<br />
silica, adularia,<br />
albite<br />
33<br />
circulated through permeable volcanic units toward a hydrothermal upflow zone (Fig. 15, 17),<br />
similar to those invoked for the formation of VMS deposits (Franklin 1995). As this fluid was<br />
heated to temperatures of up to 150°C and reacted with the host volcanic rocks, quartz was<br />
dissolved, and K-feldspar formed at the expense of plagioclase. Sulphide deposition occurred<br />
when seawater sulphate was reduced by interaction with upwelling magmatic fluid, and/or the<br />
pH changed by reaction with host rocks. This model requires that sulphur was sourced from<br />
shallowly circulating seawater, whereas metals (± minor sulphur) were transported in<br />
magmatic fluid, with sulphide precipitation occurring upon mixing of these two fluids in the<br />
subsurface. In contrast with typical VMS systems in which rapid fluid mixing and cooling result<br />
in the rapid precipitation of very fine-grained sulphide (Barnes 1979), the mineral kinetics of<br />
fluid mixing and sulphide precipitation at temperatures of ~200°C at <strong>Mount</strong> <strong>Costigan</strong> allowed<br />
for slower sulphide precipitation and resulted in the formation of relatively coarse-grained<br />
sulphides.<br />
It is possible that the intrusion from which the hypothesized metal-bearing magmatic fluid<br />
was sourced contained anomalously heavy sulphur (i.e., δ 34 S = +9.2‰ to +9.7‰). However,<br />
this model requires that both metals and sulphur (as bisulphide) are transported in the same<br />
fluid. In the neutral to moderately low-pH hydrothermal fluid hypothesized for <strong>Mount</strong><br />
<strong>Costigan</strong>, and assuming ΣS = 1 molal, such a fluid should contain significant Cu and Zn<br />
(Cu/Zn is ≥2 and ≤10) and very little Pb at the estimated maximum temperature of formation<br />
of 220°C (Lydon 1988). However, this is not consistent with the metal ratios exhibited at<br />
<strong>Mount</strong> <strong>Costigan</strong> (sphalerite and galena show a 2:1 ratio: Fig. 14a) or with the absence of Cu<br />
mineralization.<br />
Given the apparent stratigraphic control on the distribution of mineralization and alteration<br />
along with the limited development of cross-cutting hydrothermal breccia, it seems likely that,<br />
at the margins of the system, most fluid flow was focused laterally within permeable strata,<br />
whereas at depth in the central part of the system, fluids flowed vertically through existing<br />
fractures at confining pressures that were high enough to prevent boiling. In the central part of<br />
the system at shallow levels, abundant quartz ± carbonate veining and breccia-fill textures<br />
may mark the lower boundary of a boiling zone. In typical epithermal deposits in which a<br />
boiling zone is developed, precious metals (Au and Ag) accumulate above the boiling zone. At<br />
<strong>Mount</strong> <strong>Costigan</strong>, Au and Ag are encountered in the higher sections of the system, suggesting<br />
that part of the system may have been lost to erosion.<br />
<strong>The</strong> salient characteristics of the <strong>Mount</strong> <strong>Costigan</strong> deposit can be compared with those of the<br />
Cordilleran epithermal Au–Ag deposits (Panteleyev 1988). Although not a perfect match, the<br />
<strong>Mount</strong> <strong>Costigan</strong> deposit does share several attributes of this deposit type (Fig. 17). In<br />
particular, the mineral assemblage quartz–adularia–pyrite–sericite–calcite–chlorite–rhodochrosite<br />
–fluorite ± Au–Ag, which occurs at or immediately above the boiling zone in Panteleyev’s<br />
model, strongly resembles the shallower part of the <strong>Mount</strong> <strong>Costigan</strong> deposit. Also, the<br />
sphalerite–galena–pyrite–quartz–chlorite veins that are abundant below the boiling zone in his<br />
model are similar to the massive base metal veins at <strong>Mount</strong> <strong>Costigan</strong>.
34<br />
<strong>The</strong> Redstone <strong>Mount</strong>ain Granite is proposed as a likely source of the metals at <strong>Mount</strong><br />
<strong>Costigan</strong>. Although similar in HFSE contents (Fig. 9a–c) to volcanic rocks at the top of the<br />
<strong>Costigan</strong> <strong>Mount</strong>ain Formation (Lewis Brook area), the granite is characterized by very low<br />
contents of Zn, Pb, Cu, W, Mo, Sn, Sb, and Au compared with the felsic rocks hosting the<br />
deposit. Likewise, similarities in the uranogenic ( 207 Pb/ 204 Pb) Pb contents of the <strong>Mount</strong><br />
<strong>Costigan</strong> mineralization and Redstone <strong>Mount</strong>ain Granite suggest a possible genetic link (Fig.<br />
16). <strong>The</strong> anomalously low metal content of the granite may be due to metal sequestration into<br />
a fluid phase during cooling of the intrusion. This fluid phase was introduced into the host<br />
sequence, where it mixed with seawater convecting through the volcanic rocks, and<br />
precipitated sulphide mineralization at temperatures of ~200°C.<br />
Similar, high-level, metal-depleted intrusions within and coeval with the footwall succession of<br />
VMS deposits in the Bathurst Mining Camp of northeastern <strong>New</strong> Brunswick (Fig. 1, inset)<br />
have been interpreted to reflect depletion following separation of a metal-laden, depositgenerating<br />
fluid phase (McCutcheon and Walker 2008). At a shallower level in the system,<br />
where confining pressure was surpassed by an exsolving gas phase, the fluid would undergo<br />
phase separation (boiling). Boiling promotes sulphide saturation and a decrease in the<br />
solubility of carbonate phases. This explains the high-grade massive sulphide breccia cement<br />
as well as increased quartz–carbonate veining in the shallower parts of the deposit.<br />
CONCLUSIONS<br />
<strong>The</strong> <strong>Mount</strong> <strong>Costigan</strong> <strong>Zn–Pb–Ag</strong> sulphide deposit is hosted by intercalated heterolithic felsic<br />
lithic- and crystal–lithic-lapilli tuff, massive to flow-layered, aphyric to very sparsely feldsparphyric<br />
rhyolite, and minor intervals of siltstone and sandstone within the <strong>Costigan</strong> <strong>Mount</strong>ain<br />
Formation. Most of the fragmental textures observed at the deposit are pyroclastic in origin,<br />
rather than hydrothermal breccia as reported by previous authors (Fyffe and Pronk 1985; Cox<br />
1990).<strong>The</strong> deposit comprises epigenetic mineralization of base metal sulphides that formed<br />
within fragmental volcanic rock in a setting beneath the seafloor. Mineralization occurred at<br />
temperatures below 220°C and involved the interaction of shallowly circulating seawater and<br />
metal-rich, magmatically derived hydrothermal fluid. <strong>The</strong> deposit displays characteristics of<br />
both subsurface VMS- and Cordilleran-type epithermal Au–Ag systems.<br />
Overall, the mineralized zone is subvertical but highly irregular and strongly dependant on<br />
permeability of primary fragmental (pyroclastic) rocks. It has been intersected to depths of<br />
300 m. Pyroclastic rocks acted as conduits for later circulating hydrothermal fluids and were<br />
the locus for subsequent mineralization and local development of hydrothermal breccia. This<br />
interpretation is supported by the observation that units of unbrecciated sedimentary rock can<br />
be traced through the mineralized zone (Fig. 3). <strong>The</strong>se sedimentary units are generally<br />
unmineralized, although they may be locally cut by massive sulphide veins. <strong>The</strong> relative<br />
absence of mineralization in these units suggests that sedimentary beds may have acted as<br />
barriers to fluid migration and implies that, for the most part, mineralizing fluids remained<br />
below their boiling point and were channelled through zones (strata) of higher primary<br />
permeability/porosity.
35<br />
<strong>The</strong> consistency and range (from +7.4‰ to +9.7‰) in δ 34 S of bulk sulphide samples suggests<br />
that Early Devonian seawater was the most likely source of sulphur in this deposit; however,<br />
there is evidence at depth for a component of magmatic sulphur. <strong>The</strong> metal assemblage (Zn–<br />
Pb ± Sn, W, Ag, Au) was likely derived from a hydrothermal fluid generated during the cooling<br />
of a felsic magma, possibly from the Redstone <strong>Mount</strong>ain Granite. Although no direct link can<br />
be drawn, similarities in the uranogenic ( 207 Pb/ 204 Pb) Pb content of the <strong>Mount</strong> <strong>Costigan</strong><br />
mineralization and the Redstone <strong>Mount</strong>ain Granite suggest a possible link. Likewise, the<br />
atypically low metal content of the Redstone <strong>Mount</strong>ain Granite suggests that, at some point<br />
during its crystallization, its ore metals were effectively sequestered into an evolving<br />
hydrothermal fluid. Such a fluid may have contributed to the <strong>Mount</strong> <strong>Costigan</strong> and/or Lewis<br />
Brook mineralizing systems.<br />
Several lines of evidence, including sulphur isotope ratios of coexisting sulphide pairs, the<br />
presence of rhombohedral adularia, and the Zn–Pb-rich, Cu-poor nature of the mineralization,<br />
suggest formation at relatively low temperatures of below 220°C.<br />
Three distinct alteration types are recognized.<br />
� Zone 1 is the most distal alteration type and consists of low-temperature (
36<br />
Table 1. Lithogeochemical data for SLAM Exploration Ltd. drill cores and trenches at the <strong>Mount</strong> <strong>Costigan</strong> deposit.<br />
Detection<br />
Limit<br />
Sample<br />
Analytical<br />
Method<br />
CM08-4-<br />
73.8 m<br />
Grey flb<br />
rhy<br />
CM08-10-<br />
60 m<br />
Sparse fsparphyric<br />
rhy with<br />
chloritic<br />
fragments<br />
CM08-4-<br />
145.2 m<br />
Grey aphyric<br />
rhy<br />
CM08-4-<br />
209.8 m<br />
Sparse fspar-<br />
phyric rhy<br />
(grey)<br />
CM08-4-<br />
230.7 m<br />
Fspar-phyric<br />
rhy<br />
CM08-11-<br />
194.2 m<br />
Med. grey sparsely<br />
pink fspar-phyric rhy<br />
(minor ZnS veins)<br />
SiO2 0.01% FUS-ICP 60.35 57.39 62.19 74.44 65.52 73.2<br />
Al2O3 0.01% FUS-ICP 15.27 14.83 14.28 11.9 14.01 11.59<br />
Fe2O3 (total) 0.01% FUS-ICP 3.33 6.25 4.52 2.09 4.76 3.22<br />
MnO 0.001% FUS-ICP 0.158 0.256 0.24 0.112 0.309 0.124<br />
MgO 0.01% FUS-ICP 2.27 5.12 2.42 1 3.9 1.05<br />
CaO 0.01% FUS-ICP 0.21 0.22 0.41 0.14 0.15 0.1<br />
Na2O 0.01% FUS-ICP 0.19 0.18 0.2 0.17 0.15 0.17<br />
K2O 0.01% FUS-ICP 11.18 9.28 10.73 9.54 8.57 8.8<br />
TiO2 0.001% FUS-ICP 0.194 0.788 0.811 0.195 0.298 0.17<br />
P2O5 0.01% FUS-ICP < 0.01 0.14 0.14 < 0.01 0.03 0.02<br />
LOI 0.01% FUS-ICP 2.6 3.45 2.33 1.15 2.7 1.83<br />
Au 1 ppb INAA 90 < 2 22 20 22 24<br />
Ag 0.5 MULT INAA / TD-ICP 3.4 1 0.9 0.8 1.2 0.8<br />
As 1 INAA 8 15.2 45 21 39 23<br />
Ba 1 FUS-ICP 632 482 730 720 521 628<br />
Bi 0.1 FUS-MS 1.9 0.1 < 0.1 < 0.1 1.7 0.3<br />
Cd 0.5 TD-ICP 26.1 15.3 3.7 11.5 < 0.5 19.1<br />
Co 0.1 INAA 1.3 7 8.5 2.3 3.5 1.2<br />
Cr 0.5 INAA < 0.5 37 36.6 22.1 21.9 20.1<br />
Cs 0.1 FUS-MS 0.7 1.9 1.3 0.8 1 0.6<br />
Cu 1 TD-ICP 38 8 143 48 4 73<br />
Ga 1 FUS-MS 24 20 19 16 22 17<br />
Ge 0.5 FUS-MS 1.2 1.3 1.3 1.2 1.2 1.4<br />
Hf 0.1 FUS-MS 10.2 8.7 9 8.1 12.5 7.4<br />
Mo 2 FUS-MS < 2 < 2 < 2 2 3 3<br />
Nb 0.2 FUS-MS 28.1 23.1 17.9 22.9 31.4 18.7<br />
Ni 1 TD-ICP 1 11 6 2 8 3<br />
Pb 5 TD-ICP > 5000 2980 838 1790 1460 621<br />
Rb 1 FUS-MS 339 280 320 270 294 241<br />
S 0.001% TD-ICP 1.14 0.598 0.635 0.385 0.423 1.27<br />
Sb 0.1 INAA 7.6 3.3 5.1 3.2 4 5.2<br />
Sc 0.01 INAA 10.1 15 15.3 7.67 10.4 7.46<br />
Se 0.5 INAA < 0.5 < 3 < 0.5 < 0.5 5.9 < 0.5<br />
Sn 1 FUS-MS 11 14.2 8 5 6 8<br />
Sr 2 FUS-ICP 27 20 46 33 23 29<br />
Ta 0.01 FUS-MS 2.29 1.25 1.49 1.51 1.83 1.57<br />
Th 0.05 FUS-MS 26.9 17.2 18.8 20.8 21.7 19.2<br />
U 0.01 FUS-MS 6.73 4.38 5.25 5.42 5.87 5.24<br />
V 5 FUS-ICP < 5 75 81 8 20 10<br />
W 1 INAA 10 24.3 25 3 7 < 1<br />
Y 1 FUS-ICP 65 55.1 52 55 58 59<br />
Zn 1 INAA / TD-ICP 7950 4500 1340 4380 157 6710<br />
Zr 1 FUS-MS 365 371 385 295 513 280<br />
La 0.05 FUS-MS 47.8 55 31.5 55.6 37.7 67.1<br />
Ce 0.05 FUS-MS 109 111 63.9 108 78.4 132<br />
Pr 0.01 FUS-MS 13.6 11.1 7.98 12.6 9.71 14<br />
Nd 0.05 FUS-MS 50.4 41.6 30.4 48.1 40.8 49.7<br />
Sm 0.01 FUS-MS 11.9 8.89 6.96 10.6 10 11.9<br />
Eu 0.005 FUS-MS 2.47 1.38 0.873 1.12 1.21 1.78<br />
Gd 0.01 FUS-MS 10.9 8.79 6.98 10.2 9.47 11.6<br />
Tb 0.01 FUS-MS 2.07 1.44 1.3 1.79 1.67 1.98<br />
Dy 0.01 FUS-MS 12.4 8.39 8.39 10.7 10.6 11<br />
Ho 0.01 FUS-MS 2.59 1.63 1.84 2.18 2.39 2.17<br />
Er 0.01 FUS-MS 7.45 4.76 5.4 6.12 6.88 5.9<br />
Tl 0.05 FUS-MS 1.45 1.48 1.54 1.37 2.01 1.22<br />
Tm 0.005 FUS-MS 1.2 0.713 0.876 0.948 1.09 0.918<br />
Yb 0.01 FUS-MS 7.86 4.69 5.43 6.11 7.04 5.7<br />
Lu 0.002 FUS-MS 1.12 0.752 0.799 0.853 1 0.795<br />
Notes: 1. All detection limits are in ppm unless otherwise stated. All analyses were conducted by Activation Laboratories Ltd.<br />
2. FUS-ICP = metaborate/tetraborate fusion-inductively coupled plasma emission spectrometry, INAA = instrumental neutron activation analysis,<br />
FUS-MS = metaborate/tetraborate fusion-mass spectrometry, TD-ICP = total digestion-inductively coupled plasma mass spectrometry.<br />
3. rhy = rhyolite, flb = flow-banded, fspar = feldspar, xl = crystal.
Table 1 (cont’d). Lithogeochemical data for SLAM Exploration Ltd. drill cores and trenches at the <strong>Mount</strong> <strong>Costigan</strong> deposit.<br />
Sample<br />
CM08-4-<br />
264 m<br />
Rhy fragment<br />
from xl lithic<br />
tuff with<br />
alkali granite<br />
fragment<br />
CM08-4-<br />
90.7 m<br />
Sil-K fspar cement<br />
from rhy fragmental<br />
containing<br />
dissem’nated<br />
sulphides<br />
CM08-4-<br />
254.8 m<br />
Highly altered<br />
felsic<br />
fragmental<br />
37<br />
CM08-11-<br />
148.4 m<br />
Mottled/altered<br />
grey flb rhy<br />
very sparse<br />
fspars<br />
CM08-11-<br />
74.5 m<br />
Green-grey<br />
flb rhy with<br />
minor fspar<br />
phenocrysts<br />
CM08-12-<br />
175 m<br />
Fsparphyric<br />
rhy<br />
with minor<br />
sulphide<br />
CM08-12-<br />
252.2 m<br />
Massive<br />
grey rhy<br />
CM08-12-<br />
273.5 m<br />
Massive<br />
grey rhy<br />
with pink<br />
fspar<br />
phenocrysts<br />
SiO2 69.82 84.92 57.37 76.24 60.82 74.74 74.76 71.54<br />
Al2O3 11.82 5.96 16.12 11.34 17.35 11.9 11.35 12.4<br />
Fe2O3 (total) 3.31 2.07 3.17 1.71 4.31 1.88 1.94 2.62<br />
MnO 0.354 0.085 0.609 0.1 0.245 0.095 0.038 0.142<br />
MgO 4.18 0.6 6.33 0.52 2.07 0.46 0.34 1.12<br />
CaO 0.34 0.04 0.59 0.15 0.04 0.09 0.23 0.46<br />
Na2O 0.15 0.12 0.2 0.22 0.2 0.22 0.16 1.79<br />
K2O 7.02 4.1 11.37 8.98 12.09 9.69 9.57 7.17<br />
TiO2 0.444 0.088 0.389 0.149 0.245 0.168 0.169 0.42<br />
P2O5 0.06 < 0.01 0.05 0.01 0.02 0.02 0.02 0.07<br />
LOI 3.02 1.09 3.99 0.67 1.75 0.76 1.4 1.5<br />
Au 14 38 70 < 1 < 1 5 8 < 1<br />
Ag 0.8 1.2 1.8 < 0.5 0.5 < 0.5 < 0.5 < 0.5<br />
As 25.9 22.6 99 12 8 14 10 27<br />
Ba 365 231 350 904 836 856 843 705<br />
Bi 0.1 < 0.1 0.8 0.3 < 0.1 < 0.1 < 0.1 < 0.1<br />
Cd 3.1 19.4 < 0.5 < 0.5 1 1.3 2.2 < 0.5<br />
Co 9 2 3.9 < 0.1 1.3 1.2 1.2 3.1<br />
Cr 66 22 19.3 29.3 15.6 33.6 18.4 31.5<br />
Cs 1.7 0.7 2.4 1 1 1.2 0.6 0.5<br />
Cu 124 13 50 8 1 10 6 10<br />
Ga 15 8 21 16 23 18 13 18<br />
Ge 1.1 2.5 1.5 1.4 1.7 1.4 1 1.1<br />
Hf 7.1 4.3 14.5 7.9 12.6 8.3 8 8.3<br />
Mo < 2 < 2 < 2 < 2 2 < 2 < 2 < 2<br />
Nb 19.6 13.1 36 24.5 37.8 24.4 23.7 23.6<br />
Ni 29 9 4 2 2 2 1 5<br />
Pb 687 2810 61 121 201 162 94 7<br />
Rb 262 146 414 268 384 287 271 212<br />
S 0.621 0.572 0.977 0.162 0.145 0.232 1.02 0.558<br />
Sb 5.6 15.1 3.2 1.4 1.4 1.3 2 0.9<br />
Sc 10 3 13.5 6.94 12.8 8.02 6.47 12.5<br />
Se < 3 < 3 < 0.5 < 0.5 < 0.5 < 0.5 < 0.5 < 0.5<br />
Sn 11.3 6.5 6 7 13 6 5 8<br />
Sr 39 9 65 50 26 41 37 54<br />
Ta 1.08 0.68 2.11 1.6 2.48 1.63 1.46 1.41<br />
Th 12.1 8.14 24.6 20.8 32.5 21.3 19.2 18.4<br />
U 3.29 2.5 6.58 5.43 8.01 5.57 5.11 4.98<br />
V 49 < 5 23 < 5 8 < 5 < 5 24<br />
W 2.6 1.8 < 1 5 16 4 < 1 8<br />
Y 39.4 30 69 65 84 67 40 61<br />
Zn 1170 6240 191 214 216 772 809 31<br />
Zr 291 179 609 279 436 298 300 331<br />
La 51.3 20 83 63.9 92.1 73.8 59.9 63.3<br />
Ce 106 46.4 162 124 172 141 120 121<br />
Pr 10.2 4.64 19.1 14.3 21 16.4 13.7 14<br />
Nd 37.1 17.1 74.5 54.8 80.4 62.5 51.8 54.6<br />
Sm 7.06 3.69 15.3 11.5 16.3 13 10.4 11.5<br />
Eu 1.23 0.663 2.65 1.27 2.82 1.52 1.02 1.69<br />
Gd 6.75 3.43 13.2 11.1 15.2 12.5 8.82 11<br />
Tb 1.07 0.6 2.22 1.89 2.57 2.06 1.35 1.85<br />
Dy 6.26 3.71 13.4 11.6 14.9 12.1 7.42 10.9<br />
Ho 1.27 0.79 2.85 2.38 3.17 2.44 1.46 2.22<br />
Er 3.79 2.54 8.07 6.7 9.11 6.65 4.18 6.16<br />
Tl 1.59 0.83 2.79 1.37 2.01 1.34 1.33 1.01<br />
Tm 0.584 0.396 1.27 1.05 1.43 1.01 0.647 0.94<br />
Yb 4.01 2.7 8.12 6.59 9.27 6.59 4.37 6<br />
Lu 0.638 0.433 1.17 0.914 1.33 0.904 0.637 0.856<br />
Notes: 1. All detection limits are in ppm unless otherwise stated. All analyses were conducted by Activation Laboratories Ltd.<br />
2. FUS-ICP = metaborate/tetraborate fusion-inductively coupled plasma emission spectrometry, INAA = instrumental neutron activation analysis,<br />
FUS-MS = metaborate/tetraborate fusion-mass spectrometry, TD-ICP = total digestion-inductively coupled plasma mass spectrometry.<br />
3. rhy = rhyolite, flb = flow-banded, fspar = feldspar, xl = crystal.
Table 1 (cont’d). Lithogeochemical data for SLAM Exploration Ltd. drill cores and trenches at the <strong>Mount</strong> <strong>Costigan</strong> deposit.<br />
Sample<br />
CM08-13-<br />
22 m<br />
Felsic<br />
fragmental<br />
with chloritic<br />
clasts<br />
CM08-12-<br />
298.5 m<br />
Crystal–<br />
lithic<br />
tuff<br />
38<br />
CM08-12-<br />
175 m<br />
Grey<br />
massive<br />
rhyolite<br />
CM08-8-<br />
48 m<br />
Mafic<br />
dyke<br />
CM08-4-<br />
222b m<br />
Finegrained<br />
sandstone<br />
CM08-4-<br />
222a m<br />
Siltstone<br />
SiO2 62.18 72.83 73.64 49.77 56.81 59.34<br />
Al2O3 14.41 12.27 12.28 13.95 16.54 16.8<br />
(total)<br />
Fe2O3<br />
4.79 2.76 1.97 10.99 8.91 7.53<br />
MnO 0.37 0.191 0.093 1.473 0.385 0.376<br />
MgO 2.57 1.13 0.47 6.37 4.42 4.21<br />
CaO 0.04 0.37 0.08 1.41 0.89 0.82<br />
Na2O 0.15 1.62 0.24 0.12 0.65 0.88<br />
K2O 11.05 7.14 9.78 6.45 4.95 5.13<br />
TiO2 0.206 0.313 0.173 2.354 0.951 0.947<br />
P2O5 0.04 0.05 0.01 0.49 0.17 0.14<br />
LOI 2.94 1.27 0.92 5.34 4.85 4.03<br />
Au 13 < 2 < 2 15 < 2 4<br />
Ag 0.9 0.6 0.5 2.3 0.4 < 0.5<br />
As 246 5.7 20 159 73.5 22<br />
Ba 709 724 851 374 413 451<br />
Bi 0.4 < 0.1 < 0.1 0.1 0.2 0.3<br />
Cd 4.7 0.8 1.1 0.8 0.9 0.8<br />
Co 1.8 3 2 31 23 23.1<br />
Cr 12.2 22 21 22 174 159<br />
Cs 1.1 0.6 1.4 1.9 6.5 5.6<br />
Cu 4 4 12 12 31 34<br />
Ga 13 16 17 20 21 22<br />
Ge 1.4 1.2 1.3 2.2 1.7 1.8<br />
Hf 10.3 8.3 7.7 5.7 4.3 4.9<br />
Mo < 2 < 2 < 2 < 2 < 2 < 2<br />
Nb 27.8 23.4 25.2 20 18 17.7<br />
Ni 3 3 3 18 112 103<br />
Pb 147 221 166 320 209 213<br />
Rb 387 214 296 221 235 225<br />
S 2.06 0.028 0.182 0.716 1.09 0.164<br />
Sb 5.4 1 1.2 10.5 2.4 1.3<br />
Sc 8.74 9 8 31 22 22.3<br />
Se < 0.5 < 3 < 3 < 3 < 3 < 0.5<br />
Sn 3 13.8 17.8 11.5 9.8 4<br />
Sr 31 45 40 42 40 46<br />
Ta 1.84 1.39 1.49 0.98 0.92 1<br />
Th 23.8 17.8 19.4 7.47 9.85 10.9<br />
U 5.21 4.5 4.99 3.75 2.66 2.91<br />
V 6 24 6 338 158 147<br />
W < 1 2.1 2.4 9.2 1.1 4<br />
Y 67 50.4 70.2 49 36.7 33<br />
Zn 158 395 748 486 405 327<br />
Zr 375 329 275 258 183 209<br />
La 46 66.5 77.4 34.7 36.3 38.8<br />
Ce 109 134 153 78.8 79.2 78.1<br />
Pr 13.7 13 15 8.32 8.08 9.12<br />
Nd 54.8 47.1 55.2 33.8 31.2 36.3<br />
Sm 12.2 9.53 11.5 7.99 6.78 7.64<br />
Eu 1.09 1.6 1.47 2.5 1.71 1.68<br />
Gd 11.7 8.96 11.7 8.51 6.61 6.77<br />
Tb 2.11 1.43 1.85 1.36 1.08 1.14<br />
Dy 12.8 8.04 10.5 7.82 6.15 6.61<br />
Ho 2.64 1.56 2.08 1.48 1.2 1.32<br />
Er 7.36 4.57 5.99 4.15 3.47 3.64<br />
Tl 4.86 0.95 1.35 2.57 1.03 0.97<br />
Tm 1.15 0.69 0.89 0.61 0.515 0.543<br />
Yb 7.31 4.63 5.8 3.92 3.32 3.57<br />
Lu 1.01 0.745 0.916 0.605 0.51 0.485<br />
Notes: 1. All detection limits are in ppm unless otherwise stated. All analyses were conducted by Activation Laboratories Ltd.<br />
2. FUS-ICP = metaborate/tetraborate fusion-inductively coupled plasma emission spectrometry, INAA = instrumental neutron activation analysis,<br />
FUS-MS = metaborate/tetraborate fusion-mass spectrometry, TD-ICP = total digestion-inductively coupled plasma mass spectrometry.<br />
3. rhy = rhyolite, flb = flow-banded, fspar = feldspar, xl = crystal.
Table 1 (cont’d). Lithogeochemical data for SLAM Exploration Ltd. drill cores and trenches at the <strong>Mount</strong> <strong>Costigan</strong> deposit.<br />
Sample<br />
ET-1<br />
(surface)<br />
Crystal–<br />
lithic tuff<br />
ET-2<br />
(surface)<br />
Crystal–<br />
lithic tuff<br />
39<br />
ST-1A<br />
(surface)<br />
Crystal–<br />
lithic tuff<br />
ST-1B<br />
(surface)<br />
Crystal–<br />
lithic tuff<br />
ST-2<br />
(surface)<br />
Crystal–<br />
lithic tuff<br />
ST-3<br />
(surface)<br />
Crystal–<br />
lithic tuff<br />
ST-6<br />
(surface)<br />
Crystal–<br />
lithic tuff<br />
SiO2 72.7 69.9 72.5 77.2 80.1 79.6 67.3<br />
Al2O3 13 12.6 12.2 10.6 8.37 9.33 14.1<br />
Fe2O3 (total) 1.92 1.21 2.06 1.55 2.14 1.4 3.36<br />
MnO 0.4 0.31 0.18 0.09 0.15 0.12 0.23<br />
MgO 2.63 3.12 2.26 1.15 2.24 1.6 3.87<br />
CaO 0.05 0.06 0.05 0.04 0.05 0.04 0.03<br />
Na2O 0.1 0.1 0.14 0.1 0.08 0.09 0.13<br />
K2O 7.06 8.98 7.44 6.88 4.76 6.49 8.13<br />
TiO2 0.234 0.177 0.219 0.193 0.136 0.184 0.166<br />
P2O5 0.03 0.02 0.02 0.02 0.02 0.02 0.01<br />
LOI 1.9 1.7 1.6 1.25 1.5 1.05 2.05<br />
Au 5 < 2 < 2 5 20 14 39<br />
Ag 3.8 1.7 0.9 0.9 1.3 0.5 1.1<br />
As - - - - - - -<br />
Ba 634 591 597 703 399 501 474<br />
Bi - - - - - - -<br />
Cd - - - - - - -<br />
Co 4 1 -0.5 -0.5 -0.5 -0.5 -0.5<br />
Cr 16 10 9 11 13 21 9<br />
Cs 1 1 1 1 1 -0.5 -0.5<br />
Cu 19.3 7.6 4.8 9.9 33.7 18.3 21.1<br />
Ga - - - - - - -<br />
Ge - - - - - - -<br />
Hf 7.9 7.2 9.3 7.4 4.5 6.6 7.7<br />
Mo - - - - - - -<br />
Nb 33 23 22 23 17 17 25<br />
Ni 13 6 6 3 5 5 6<br />
Pb 1690 510 226 139 404 598 354<br />
Rb 282 320 316 241 168 240 258<br />
S - - - - - - -<br />
Sb 7.9 2.9 3.2 3.8 20.6 11.2 3.1<br />
Sc 9 8 12 10 7 8 9<br />
Se - - - - - - -<br />
Sn - - - - - - -<br />
Sr 22 30 22 19 12 17 19<br />
Ta 1.7 1.6 1.6 1.3 1.3 0.8 2.1<br />
Th 26.7 23.4 23.2 19 15 15 26.3<br />
U 7.5 6.8 6.5 5.6 5 4.3 7.3<br />
V 4 2 -2 2 6 5 3<br />
W 4 4 11 3 8 7 10<br />
Y 55 64 64 55 43 53 71<br />
Zn 321 264 149 125 110 59.1 130<br />
Zr 314 292 396 351 186 308 293<br />
La 50.1 48.1 75.5 41 67.4 73.7 96.4<br />
Ce 154 95 167 95 130 140 201<br />
Pr - - - - - - -<br />
Nd 41 45 68 38 55 60 91<br />
Sm 7.23 10.2 13.9 7.67 10.3 12 17<br />
Eu 1.2 1.6 2 1.3 1.3 1.8 2.3<br />
Gd - - - - - - -<br />
Tb 1.1 2 2 1.4 1.3 1.7 2.5<br />
Dy - - - - - - -<br />
Ho - - - - - - -<br />
Er - - - - - - -<br />
Tl - - - - - - -<br />
Tm - - - - - - -<br />
Yb 6.66 6.16 6.77 5.48 4.7 5.2 7.85<br />
Lu 1.07 1 1.1 0.88 0.74 0.81 1.23<br />
Notes: 1. All detection limits are in ppm unless otherwise stated. All analyses were conducted by Activation Laboratories Ltd.<br />
2. FUS-ICP = metaborate/tetraborate fusion-inductively coupled plasma emission spectrometry, INAA = instrumental neutron activation analysis,<br />
FUS-MS = metaborate/tetraborate fusion-mass spectrometry, TD-ICP = total digestion-inductively coupled plasma mass spectrometry.<br />
3. rhy = rhyolite, flb = flow-banded, fspar = feldspar, xl = crystal.
40<br />
Table 2. Lithogeochemical data for the Lewis Brook occurrence (<strong>Costigan</strong> <strong>Mount</strong>ain Formation), and average values<br />
for the River Dee rhyolite and River Dee basalt (Wapske Formation).<br />
Detection<br />
Limit<br />
Sample<br />
Analytical<br />
Method<br />
LB99-3-<br />
43 m<br />
LB99-3-<br />
82 m<br />
LB99-3-<br />
106 m<br />
LB99-3-<br />
108.5 m<br />
LB99-3-<br />
185.2 m<br />
LB99-3-<br />
79.5 m<br />
Rhyodacite Rhyodacite Rhyodacite Rhyodacite Rhyodacite Rhyodacite<br />
SiO2 0.01% XRF 69.8 74.5 74.8 69.3 71.5 64.8<br />
Al2O3 0.01% XRF 13.3 11.1 9.87 9.66 12.8 11<br />
Fe2O3 (total) 0.01% XRF 2.81 1.86 2.57 4.37 1.47 5.26<br />
MnO 0.001% XRF 0.06 0.04 0.05 0.07 0.06 0.04<br />
MgO 0.01% XRF 0.73 0.2 0.38 0.56 0.55 0.49<br />
CaO 0.01% XRF 1.09 0.27 0.39 1.26 1.12 0.7<br />
Na2O 0.01% XRF 2.78 0.16 0.29 0.6 0.1 1.23<br />
K2O 0.01% XRF 5.4 8.53 7.28 7.6 8.8 7.04<br />
TiO2 0.001% XRF 0.26 0.14 0.12 0.14 0.18 0.26<br />
P2O5 0.01% XRF 0.03 0.02 < 0.01 0.02 0.02 0.03<br />
LOI 0.01% XRF 2.89 1.75 2.29 3.65 2.94 4.74<br />
Au 1 ppb INAA 6 18 < 2 58 < 2 211<br />
Ag 0.5 INAA 0.6 1.3 < .5 2.4 < .5 5.2<br />
As 1 INAA 87.6 77.1 69.8 177 11.6 248<br />
Ba 1 INAA 740.6 877.2 798.9 810.4 801.3 784.6<br />
Bi 0.1 FUS-MS 6.8 1.4 0.5 2.8 < .5 4.2<br />
Cd 0.5 TD-ICP 0.5 3.8 16.4 48 < .2 98.3<br />
Co 0.1 INAA 10.1 3.7 2.2 4.4 2 7.8<br />
Cr 0.5 INAA 71 101 115 95 80 101<br />
Cs 0.1 INAA 2.1 1 0.8 0.9 2.9 1.3<br />
Cu 1 TD-ICP 70 35 206 556 4 1452<br />
Ga 1 FUS-MS 16.5 9 12.4 12.8 13.4 11.9<br />
Ge 0.5 FUS-MS - - - - - -<br />
Hf 0.1 INAA 7.6 4.3 3.8 3.8 4.7 5.7<br />
Mo 2 INAA 4.3 4.9 4.3 1.7 2.2 6.9<br />
Nb 0.2 FUS-MS 13.8 11 7.8 9.1 15.5 10.2<br />
Ni 1 INAA 10 5 2 5 5 4<br />
Pb 5 TD-ICP 120 667 132 770 22 547<br />
Rb 1 INAA 177.8 277.4 233.9 236.5 276.5 226.7<br />
Sb 0.1 INAA 1.8 1.9 1.3 2.5 1.5 3.9<br />
Sc 0.01 INAA 5.4 3.6 3.2 3.5 5.6 4.6<br />
Se 0.5 INAA < 3 < 3 < 3 < 3 < 3 < 3<br />
Sn 1 INAA 5 3 4 4 6 7<br />
Sr 2 FUS-ICP 52.4 69.9 43.2 57.9 76.6 66.9<br />
Ta 0.01 INAA 1.7 1.2 0.9 0.9 1.7 1<br />
Th 0.05 INAA 29.8 21.3 17.6 17.3 26.2 15.7<br />
U 0.01 INAA 11.6 7.9 6.1 5.8 9.2 6.5<br />
V 5 FUS-ICP 19 10 9 11 12 13<br />
W 1 INAA 2 2 2 2 2 2<br />
Y 1 FUS-ICP 42.8 29 26.3 25.4 44.2 38<br />
Zn 1 INAA 106 692 5225 11209 9 30062<br />
Zr 1 FUS-MS 223.5 123.4 104.8 115 130.6 191.4<br />
La 0.05 INAA 55.3 35.5 13.4 53 53.9 16.9<br />
Ce 0.05 INAA 89.4 62.4 24.3 113.5 88 31.8<br />
Pr 0.01 INAA 9.42 6.57 2.87 11.82 9.22 3.51<br />
Nd 0.05 INAA 39.6 25.4 12.6 44.3 36.6 14.5<br />
Sm 0.01 INAA 7 4.6 2.8 6.9 7.1 3<br />
Eu 0.005 INAA 0.84 0.47 0.29 0.68 0.99 0.43<br />
Gd 0.01 INAA 6.21 4.54 2.66 5.61 6.78 3.58<br />
Tb 0.01 INAA 1.1 0.76 0.57 0.85 1.19 0.73<br />
Dy 0.01 INAA 6.81 4.85 3.84 4.63 7.31 5.35<br />
Ho 0.01 INAA 1.42 1.02 0.85 0.9 1.42 1.27<br />
Er 0.01 INAA 4.39 3.09 2.65 2.65 4.26 4.05<br />
Tl 0.05 INAA 0.4 0.4 0.3 0.4 0.8 0.5<br />
Tm 0.005 INAA 0.66 0.51 0.37 0.45 0.66 0.65<br />
Yb 0.01 INAA 4.61 3.31 2.86 2.87 4.19 4.1<br />
Lu 0.002 INAA 0.75 0.52 0.49 0.45 0.75 0.74<br />
Notes: 1. All detection limits are in ppm unless otherwise stated. INAA, FUS-MS, TD-ICP, FUS-ICP analyses carried out by Acme Analytical. XRF<br />
analyses carried out by Lakefield Analytical.<br />
2. FUS-ICP = metaborate/tetraborate fusion-inductively coupled plasma emission spectrometry, INAA = instrumental neutron activation analysis,<br />
FUS-MS = metaborate/tetraborate fusion-mass spectrometry, TD-ICP = total digestion-inductively coupled plasma mass spectrometry, XRF = X-ray<br />
fluorescence.
Table 2 (cont’d). Lithogeochemical data for the Lewis Brook occurrence (<strong>Costigan</strong> <strong>Mount</strong>ain Formation), and<br />
average values for the River Dee rhyolite and River Dee basalt (Wapske Formation).<br />
Sample<br />
LB99-3-<br />
113.5 m<br />
LB99-3-<br />
119 m<br />
LB99-3-<br />
131 m<br />
LB99-3-<br />
138.5 m<br />
41<br />
LB99-3-<br />
155 m<br />
LB99-3-<br />
176.7 m<br />
LB99-3-<br />
186.8 m<br />
LB99-3-<br />
19.4 m<br />
LB99-3-<br />
41 m<br />
Basalt Basalt Basalt Basalt Basalt Basalt Basalt Basalt Basalt<br />
SiO2 44.7 45.3 45.6 44.3 45.4 41.8 44.2 59.4 59.9<br />
Al2O3 16.4 17 15.2 17 16.9 15.4 15.3 16.1 16.4<br />
Fe2O3 (total) 10.3 7.68 7.92 11.9 7.12 7.76 8.36 8.33 7.41<br />
MnO 0.49 0.23 0.3 0.42 0.19 0.34 0.22 0.11 0.09<br />
MgO 4.77 6.09 4.29 2.75 4.98 3.98 3.64 4.08 3.79<br />
CaO 2.46 7.57 5.04 1.1 7.14 7.43 6 0.93 1.16<br />
Na2O 0.96 2.96 1.65 1.97 2.47 0.08 1.85 1.97 1.39<br />
K2O 6.53 4.28 3.82 6.19 4.83 5.52 4.28 3.09 3.81<br />
TiO2 1.32 1.24 1.16 1.5 1.11 1.59 1.58 1.12 1.01<br />
P2O5 0.18 0.15 0.14 0.21 0.17 0.19 0.18 0.16 0.18<br />
LOI 9.35 7.13 14.2 11.8 9.35 13.4 14.2 4.6 5.07<br />
Au < 2 < 2 < 2 2 < 2 < 2 < 2 3 3<br />
Ag < .5 < .5 < .5 0.6 < .5 < .5 < .5 < .5 < .5<br />
As 49.5 8.6 36.9 77.6 21.5 157 13.4 13.8 29.3<br />
Ba 773.3 555.7 371.1 682 556.5 150.8 616.4 418.2 371.3<br />
Bi < .5 < .5 < .5 < .5 < .5 < .5 < .5 < .5 < .5<br />
Cd 4.3 < .2 < .2 10.4 < .2 0.2 < .2 < .2 < .2<br />
Co 32.3 32.1 27.2 32 29.7 32.2 27 26.5 21.9<br />
Cr 210 234 200 190 225 179 176 157 168<br />
Cs 8 4.7 9.2 7.1 7.6 6.9 8 7.3 7.2<br />
Cu 71 26 28 110 34 36 46 45 41<br />
Ga 26.7 16.8 14.1 38.8 16.2 20.8 18.3 21.7 21.3<br />
Ge - - - - - - - - -<br />
Hf 2.7 2.2 2.1 3.1 2.5 3.4 3.1 5.3 5.3<br />
Mo 1 0.6 1 1.3 0.6 1.4 1.2 0.6 0.8<br />
Nb 6.8 5.3 4.7 7.3 6.3 7.2 6.8 14.2 13.5<br />
Ni 63 71 58 72 72 50 41 78 90<br />
Pb 1582 10 10 3741 12 31 5 14 11<br />
Rb 217.7 167.9 158.3 204.6 206.5 281.9 195.3 134.1 167.2<br />
Sb 1.3 0.6 2.1 2.5 1 5.8 1.3 0.9 1.4<br />
Sc 30.3 28.3 28.3 29.9 27.8 31.5 31.4 24.4 21<br />
Se < 3 < 3 < 3 < 3 < 3 < 3 < 3 < 3 < 3<br />
Sn 2 1 2 8 2 2 2 3 4<br />
Sr 110.6 354.4 174.2 83.2 226.1 128.7 317.8 81.3 53.2<br />
Ta 0.5 0.2 0.2 0.4 0.4 0.4 0.4 1.1 0.9<br />
Th 3.5 2.2 1.7 3.2 2.6 3.2 3.7 9.8 11<br />
U 1.4 < .5 1.3 2 1.4 1.3 1.5 3.3 3.9<br />
V 207 182 173 211 169 229 248 160 132<br />
W 4 < 1 < 1 6 < 1 6 4 2 1<br />
Y 21.2 20 17.9 33.4 20.2 27 23.5 28.6 31.4<br />
Zn 1336 83 75 3707 67 79 66 85 88<br />
Zr 101 84.3 72.7 112.8 92.5 112.9 112.5 186.1 181.7<br />
La 16.2 13.6 12.5 22.9 14 18.4 13.6 29.7 38.9<br />
Ce 30.8 26.5 23.5 41.2 30.2 34.4 28.7 55.6 69<br />
Pr 3.7 3.07 2.76 4.67 3.32 4.09 3.49 6.39 8.06<br />
Nd 18 15.8 12.9 22.3 16.1 19.9 18 28.5 34.8<br />
Sm 3.6 3.5 3.1 4.8 3.5 4.3 3.5 5.3 6.9<br />
Eu 1.34 1.41 1.13 2.34 1.25 1.41 1.37 1.3 1.31<br />
Gd 3.95 3.62 3.21 5.07 3.74 4.45 4.26 4.98 6.01<br />
Tb 0.62 0.58 0.52 0.91 0.61 0.77 0.67 0.78 0.96<br />
Dy 4.06 3.67 3.36 6.13 3.96 4.61 4.4 5.17 5.41<br />
Ho 0.82 0.72 0.65 1.2 0.71 0.92 0.9 1.07 1.08<br />
Er 2.36 1.98 1.72 3.38 2.1 2.64 2.46 3.16 3.24<br />
Tl 0.5 0.4 0.3 0.6 0.4 0.4 1.4 0.3 0.5<br />
Tm 0.35 0.3 0.26 0.53 0.31 0.38 0.37 0.51 0.46<br />
Yb 2.09 1.76 1.62 3.22 1.97 2.45 2.38 3.11 3.12<br />
Lu 0.39 0.3 0.3 0.53 0.32 0.45 0.37 0.56 0.54<br />
Notes: 1. All detection limits are in ppm unless otherwise stated. INAA, FUS-MS, TD-ICP, FUS-ICP analyses carried out by Acme Analytical. XRF<br />
analyses carried out by Lakefield Analytical. See Wilson (1992) for analytical methods and detection limits.<br />
2. FUS-ICP = metaborate/tetraborate fusion-inductively coupled plasma emission spectrometry, INAA = instrumental neutron activation analysis,<br />
FUS-MS = metaborate/tetraborate fusion-mass spectrometry, TD-ICP = total digestion-inductively coupled plasma mass spectrometry, XRF = X-ray<br />
fluorescence.
Table 2 (cont’d). Lithogeochemical data for the Lewis Brook occurrence (<strong>Costigan</strong> <strong>Mount</strong>ain Formation), and<br />
average values for the River Dee rhyolite and River Dee basalt (Wapske Formation).<br />
Sample<br />
42<br />
River Dee Basalt<br />
(Wilson 1992) *<br />
River Dee Rhyolite<br />
(Wilson 1992) *<br />
n = 3 n = 6<br />
SiO2 51.11 75.61<br />
Al2O3 16.6 12.57<br />
(total)<br />
Fe2O3<br />
9.43 2.68<br />
MnO 0.19 0.05<br />
MgO 7.42 1.17<br />
CaO 8.73 0.05<br />
Na2O 3.68 3.47<br />
K2O 1.09 4.02<br />
TiO2 1.5 0.19<br />
P2O5 0.23 0.09<br />
LOI - -<br />
Au - -<br />
Ag<br />
As<br />
- -<br />
Ba 140 483<br />
Bi - -<br />
Cd - -<br />
Co - 4.3<br />
Cr 247 35<br />
Cs - -<br />
Cu 30 10<br />
Ga - -<br />
Ge 15 16<br />
Hf - 8.4<br />
Mo - -<br />
Nb 6 25<br />
Ni 80 9<br />
Pb - -<br />
Rb 40 142<br />
Sb - -<br />
Sc - 3.4<br />
Se - -<br />
Sn - -<br />
Sr 252 61<br />
Ta - 2<br />
Th - 22<br />
U - -<br />
V 247 -<br />
W - -<br />
Y - -<br />
Zn 86 43<br />
Zr 133 274<br />
La - 40<br />
Ce - 92.95<br />
Pr - -<br />
Nd - -<br />
Sm - 11.72<br />
Eu - 0.87<br />
Gd - -<br />
Tb - 1.99<br />
Dy - -<br />
Ho - -<br />
Er - -<br />
Tl - -<br />
Tm - -<br />
Yb - 6.26<br />
Lu - 0.97<br />
Notes: 1. All detection limits are in ppm unless otherwise stated. INAA, FUS-MS, TD-ICP, FUS-ICP analyses carried out by Acme Analytical. XRF<br />
analyses carried out by Lakefield Analytical. See Wilson (1992) for analytical methods and detection limits.<br />
2. FUS-ICP = metaborate/tetraborate fusion-inductively coupled plasma emission spectrometry, INAA = instrumental neutron activation analysis,<br />
FUS-MS = metaborate/tetraborate fusion-mass spectrometry, TD-ICP = total digestion-inductively coupled plasma mass spectrometry, XRF = X-ray<br />
fluorescence.
43<br />
Table 3. Lithogeochemical data for the Redstone <strong>Mount</strong>ain Granite collected during this investigation and compiled<br />
from previously published data of Whalen (1993).<br />
Detection<br />
Limit *<br />
Sample From This Investigation From Whalen (1993)<br />
Analytical<br />
Method<br />
RS-<br />
1<br />
RS-<br />
2<br />
RS-<br />
5<br />
RS-<br />
7<br />
RS-<br />
P<br />
RS-<br />
Renous<br />
G15-<br />
144 *<br />
G15-<br />
147 *<br />
G15-<br />
152 *<br />
G15-<br />
305 *<br />
SiO2 0.01 wt % FUS-ICP 72.82 76.33 78.38 71.75 74.67 75.23 73 75.1 72.8 75.7<br />
Al2O3 0.01 wt % FUS-ICP 13.35 11.51 12.12 13.57 12.23 12.2 13.75 12.35 13.7 12.5<br />
Fe2O3 0.01 wt % FUS-ICP 3.4 2.16 1.87 3.4 1.7 2.14 0.82 1.16 0.82 0.65<br />
MnO 0.001 wt % FUS-ICP 0.032 0.014 0.028 0.072 0.021 0.023 0.04 0.01 0.03 0.01<br />
MgO 0.01 wt % FUS-ICP 0.79 0.05 0.11 0.49 0.28 0.07 0.26 0.06 0.35 0.25<br />
CaO 0.01 wt % FUS-ICP 2.11 0.51 0.52 1.09 0.59 0.65 1.14 0.56 1.45 0.66<br />
Na2O 0.01 wt % FUS-ICP 5.08 3.42 6.38 5.15 2.79 3.64 3.98 4.13 3.75 4.29<br />
K2O 0.01 wt % FUS-ICP 1.06 4.41 0.1 2.07 5.4 4.57 4.82 4.69 4.48 4.13<br />
TiO2 0.001 wt % FUS-ICP 0.384 0.137 0.121 0.392 0.209 0.131 0.29 0.15 0.3 0.2<br />
P2O5 0.01 wt % FUS-ICP 0.05 0.01 < 0.01 0.14 0.03 < 0.01 0.05 0.02 0.06 0.04<br />
Total 0.01 FUS-ICP 99.93 99.05 100.3 99.28 98.72 99.24 - - - -<br />
Au 1 ppb INAA 1 < 1 < 1 < 1 < 1 < 1 11 0.3 < 0.3 < 0.3<br />
Ag 0.5<br />
MULT INAA<br />
/ TD-ICP<br />
< 0.5 < 0.5 < 0.5 < 0.5 < 0.5 < 0.5 - - - -<br />
As 1 INAA 18 7 26 15 17 13 0.3 < 0.2 0.5 1<br />
Ba 1 FUS-ICP 450 860 19 495 584 913 617 756 581 810<br />
Be 1 FUS-ICP 4 2 2 4 3 3<br />
Bi 0.1 FUS-MS 1 0.4 1 1.5 0.8 0.6 1 < 0.1 < 0.1 < 0.1<br />
Br 0.5 INAA < 0.5 < 0.5 < 0.5 < 0.5 < 0.5 1.2 0.9 1.1 < 0.3 0.6<br />
Cd 0.5 TD-ICP < 0.5 < 0.5 < 0.5 < 0.5 < 0.5 < 0.5 < 0.5 < 0.5 < 0.5 < 0.5<br />
Co 0.1 INAA 6.8 1.9 < 0.1 3.8 < 0.1 < 0.1 2.8 1.4 3.4 1.9<br />
Cr 0.5 INAA 29.7 10.4 18 14.4 21.2 16.2 2 1 3 3<br />
Cs 0.1 FUS-MS 1.1 1.6 0.2 0.4 1.4 0.5 5.2 0.7 2.7 1.1<br />
Cu 1 TD-ICP 2 2 2 3 1 6 2 1 3 1<br />
Ga 1 FUS-MS 19 17 22 19 15 21 18 17 18 16<br />
Ge 0.5 FUS-MS 1.9 2.3 1.9 2.3 2.2 2.3 - - - -<br />
Hf 0.1 FUS-MS 8 7.3 11.1 8.2 4.5 8.9 6.3 7.9 4.8 6.5<br />
Mo 2 FUS-MS < 2 < 2 < 2 < 2 < 2 < 2 < 0.5 < 0.5 < 0.5 3<br />
Nb 0.2 FUS-MS 13.9 19.2 33 18.2 11.3 26.1 15 25 14 22<br />
Ni 1 TD-ICP 15 4 4 5 4 3 2 2 6 1<br />
Pb 5 TD-ICP < 5 < 5 < 5 < 5 12 < 5 12 7 28 4<br />
Rb 1 FUS-MS 40 127 4 58 186 128 196 141 188 119<br />
S 0.001 wt % TD-ICP 0.007 0.003 0.004 0.005 0.003 0.004 - - - -<br />
Sb 0.1 INAA 0.1 0.2 < 0.1 0.1 < 0.1 < 0.1 0.3 0.2 0.2 0.3<br />
Sc 0.01 INAA 6.39 5.32 1.42 8.55 4.71 4.04 5.9 7.7 6.9 6.8<br />
Sn 1 FUS-MS 10 4 10 5 7 7 2.5 1.5 < 0.5 8.5<br />
Sr 2 FUS-ICP 256 66 59 147 117 81 87 56 108 89<br />
Ta 0.01 FUS-MS 1.33 1.63 2.58 1.48 1.45 2.06 1.2 1.6 1.3 1.5<br />
Th 0.05 FUS-MS 26 18.4 24 18.8 27.3 25.9 25 20.3 22 22<br />
U 0.01 FUS-MS 6 3.77 6.69 4.62 6.33 6.62 5.9 4.9 6.6 4.8<br />
V 5 FUS-ICP 27 < 5 < 5 13 12 < 5 15 2 20 15<br />
W 1 INAA < 1 < 1 < 1 < 1 < 1 < 1 3 0.8 1.5 2<br />
Y 1 FUS-ICP 48 39 73 47 34 79 48 69 47 65<br />
Zn 1<br />
INAA /<br />
TD-ICP<br />
12 11 17 28 17 10 25 10 24 5<br />
Zr 1 FUS-MS 305 243 324 352 134 265 204 232 147 168<br />
La 0.05 FUS-MS 51.9 41 57.6 58 38.8 88.1 64 74 43 64<br />
Ce 0.05 FUS-MS 102 94 138 124 78.6 156 103 136 85 114<br />
Pr 0.01 FUS-MS 11.5 9.39 14.8 13.5 8.54 20.1 - - 9.4 -<br />
Nd 0.05 FUS-MS 40.7 34.9 56.6 50.3 30.1 75.1 41 55.5 34.1 50<br />
Sm 0.01 FUS-MS 8.57 7.43 12.9 10.1 6.13 15.7 7 10.65 6.78 11.3<br />
Eu 0.005 FUS-MS 1.26 0.947 0.764 2.28 0.825 1.61 1.29 1.63 0.87 1.01<br />
Gd 0.01 FUS-MS 8.05 6.72 12.2 9.02 6.03 14.3 - - 6.48 -<br />
Tb 0.01 FUS-MS 1.44 1.17 2.31 1.48 1.01 2.49 1.35 1.8 1.07 1.8<br />
Dy 0.01 FUS-MS 8.4 7.2 14.3 8.88 6.53 15.2 - - 7.01 -<br />
Ho 0.01 FUS-MS 1.74 1.52 2.97 1.78 1.29 3.07 - - 1.5 -<br />
Er 0.01 FUS-MS 5.24 4.4 8.84 5.26 3.84 8.65 - - 4.2 -<br />
Tl 0.05 FUS-MS 0.18 0.44 < 0.05 0.28 1 0.59 < 1 < 1 7 < 1<br />
Tm 0.005 FUS-MS 0.83 0.696 1.4 0.808 0.641 1.34 - - 0.59 -<br />
Yb 0.01 FUS-MS 5.49 4.89 8.8 5.5 4.23 8.87 4.51 6.35 4.04 6.51<br />
Lu 0.002 FUS-MS 0.865 0.779 1.44 0.845 0.633 1.38 0.68 0.94 0.58 1.02<br />
Notes: 1. All detection limits are in ppm unless otherwise stated. All analyses were conducted by Activation Laboratories Ltd.<br />
2. FUS-ICP = metaborate/tetraborate fusion-inductively coupled plasma emission spectrometry, INAA = instrumental neutron activation analysis,<br />
FUS-MS = metaborate/tetraborate fusion-mass spectrometry, TD-ICP = total digestion-inductively coupled plasma mass spectrometry.<br />
* Compiled data: see Whalen (1993) for analytical methods and detection limits.
ACKNOWLEDGEMENTS<br />
44<br />
Thank you to SLAM Exploration Ltd. for providing access to confidential assessment data.<br />
Alison Pye at the Stable Isotope Laboratory, Memorial University of <strong>New</strong>foundland, conducted<br />
the sulphur isotope analyses. Douglas Hall at the University of <strong>New</strong> Brunswick, Fredericton,<br />
conducted the microprobe analyses. Cyndie Pitre is thanked for GIS work and Reg Wilson<br />
and Steve McCutcheon are thanked for numerous discussions of Early Devonian stratigraphy<br />
and metallogenesis. This manuscript benefitted greatly from thorough review by Reg Wilson.<br />
REFERENCES<br />
Ayuso, R.A., and Bevier, M.L. 1991. Regional differences in lead isotopic compositions of<br />
feldspar from plutonic rocks of the northern Appalachian <strong>Mount</strong>ains, U.S.A. and Canada:<br />
a geochemical method of terrane correlation. Tectonophysics, 10, p. 191–212.<br />
Barnes, H.L. 1979. Solubilities of ore minerals. In Geochemistry of Hydrothermal Ore <strong>Deposit</strong>s,<br />
2 nd edition. Edited by H.L. Barnes. John Wiley and Sons, <strong>New</strong> York, p. 404–460.<br />
Barrett, T.J., and MacLean, W.H. 1994. Chemostratigraphy and hydrothermal alteration in<br />
exploration for VHMS deposits in greenstones and younger volcanic rocks. In Alteration<br />
and Alteration Processes Associated with Ore-Forming Systems. Edited by D.R. Lentz,<br />
Geological Association of Canada, Short Course Notes, 11, p. 433–467.<br />
Barton, P.B. Jr., and Bethke, P.M. 1987. Chalcopyrite disease in sphalerite: pathology and<br />
epidemiology. American Mineralogist, 72, p. 451–467.<br />
Bjornson, B. 1975. Report of work on the Ogilvie (<strong>Costigan</strong> <strong>Mount</strong>ain) Group for Amoco<br />
Canada Petroleum Company Ltd. Mining Division. <strong>New</strong> Brunswick Department of Natural<br />
Resources; Lands, Minerals and Petroleum Division, Assessment Report 470298.<br />
Bjornson, B. 1976. Report of work on the Ogilvie (<strong>Costigan</strong> <strong>Mount</strong>ain) Group for Amoco<br />
Canada Petroleum Company Ltd. Mining Division. <strong>New</strong> Brunswick Department of Natural<br />
Resources; Lands, Minerals and Petroleum Division, Assessment Report 470390.<br />
Bjornson, B. 1977. Report of work on the <strong>Costigan</strong>–Ogilvie Group for Amoco Canada<br />
Petroleum Company Ltd. Mining Division. <strong>New</strong> Brunswick Department of Natural<br />
Resources; Lands, Minerals and Petroleum Division, Assessment Report 470448.<br />
Boucot, A.J., and Wilson, R.A. 1994. Origin and early radiation of terebratuloid brachiopods:<br />
thoughts provoked by Prorensselaeria and Nanothyris. Journal of Paleontology, 68, p.<br />
1002–1025.<br />
Clark, D. 2004. Report of work on the <strong>Mount</strong> <strong>Costigan</strong> Property for 2003 for SLAM Exploration<br />
Ltd. <strong>New</strong> Brunswick Department of Natural Resources; Lands, Minerals and Petroleum<br />
Division, Assessment Report 475748.<br />
Clark D. 2008. Report of work on the <strong>Costigan</strong> property. <strong>New</strong> Brunswick Department of<br />
Natural Resources; Lands, Minerals and Petroleum Division. Assessment Report 476661.<br />
Claypool, G.E., Holser, W.T., Kaplan, I.R., Sakai, H., and Zak, I. 1980. <strong>The</strong> age curves of<br />
sulfur and oxygen isotopes in marine sulfate and their mutual interpretation. Chemical<br />
Geology, 28, p. 199–260.<br />
Cox, N.D. 1990. Geology of the <strong>Mount</strong> <strong>Costigan</strong> Pb–Zn deposit, west-central <strong>New</strong> Brunswick.<br />
Unpublished M.Sc. thesis, University of Ottawa, Ontario, Canada, 176 p.
45<br />
Crevier, M. 1983. Report of work for the first year of the initial exploration period on the <strong>Mount</strong><br />
<strong>Costigan</strong> Property by Lac Minerals Ltd., for Amoco Canada Petroleum Company Ltd. <strong>New</strong><br />
Brunswick Department of Natural Resources; Lands, Minerals and Petroleum Division,<br />
Assessment Report 472943.<br />
Crevier, M. 1984. Report of work on the <strong>Mount</strong> <strong>Costigan</strong> claim Group for Lac Minerals Ltd.<br />
<strong>New</strong> Brunswick Department of Natural Resources; Lands, Minerals and Petroleum<br />
Division, Assessment Report 473035.<br />
Crevier, M. 1985. Report of work for the 3 rd year of the initial exploration period on the <strong>Mount</strong><br />
<strong>Costigan</strong> Property for Lac Minerals Ltd. <strong>New</strong> Brunswick Department of Natural<br />
Resources; Lands, Minerals and Petroleum Division, Assessment Report 473131.<br />
Crevier, M., and Gravel, L. 1983. Report of work on the <strong>Mount</strong> <strong>Costigan</strong> property for Lac<br />
Minerals Ltd. <strong>New</strong> Brunswick Department of Natural Resources; Lands, Minerals and<br />
Petroleum Division, Assessment Report 472980.<br />
Czamanske, G.K., and Rye, R.O. 1974. Experimentally determined sulfur isotope<br />
fractionations between sphalerite and galena in the temperature range 600 o to 275 o C.<br />
Economic Geology, 69, p. 17–25.<br />
Dong, G., and Morrison, G.W. 1995. Adularia in epithermal veins, Queensland: morphology,<br />
structural state and origin. Mineralium <strong>Deposit</strong>a, 30, p. 11–19.<br />
Dostal, J., Wilson, R.A., and Keppie, D. 1989. Geochemistry of Siluro–Devonian Tobique belt<br />
in northern and central <strong>New</strong> Brunswick (Canada). Canadian Journal of Earth Science, 26,<br />
p. 1282–1296.<br />
Faure, G. 1986. Principles of Isotope Geology. John Wiley and Sons Inc., <strong>New</strong> York, 589 p.<br />
Franklin, J.M. 1995. Volcanic-associated massive sulphide base metals. In Geology of<br />
Canadian Mineral <strong>Deposit</strong> Types. Edited by O.R. Eckstrand, W.D. Sinclair, and R.I.<br />
Thorpe. Geological Survey of Canada, Geology of Canada No. 8, p. 158–183.<br />
Fyffe, L.R., and Pronk, A. G. 1985. Bedrock and surficial geology—rock and till geochemistry<br />
in the Trousers Lake area, Victoria County, <strong>New</strong> Brunswick. Report of Investigations 20,<br />
Lands, Minerals and Petroleum Division; <strong>New</strong> Brunswick Department of Natural<br />
Resources, 74 p.<br />
Galley, A.G. 1995. Target vectoring using lithogeochemistry: applications to the exploration for<br />
volcanic hosted massive sulphide deposits. CIM Bulletin, 88, p. 15–27.<br />
Goodfellow, W.D., and Jonasson, I.R. 1984. Ocean stagnation and ventilation defined by δ 34 S<br />
secular trends for barite and pyrite, Selwyn Basin, Yukon. Geology, 12, p. 583–586.<br />
Goodfellow, W.D., Lydon, J.W., and Turner, R.J.W. 1993. Geology and genesis of stratiform<br />
sediment hosted (SEDEX) zinc-lead-silver sulphide deposits. In Mineral <strong>Deposit</strong><br />
Modelling. Edited by R.V. Kirkham, W.D. Sinclair, R.I. Thorpe, and J.M.S. Duke.<br />
Geological Association of Canada, Special Paper 40, p. 201–251.<br />
Gromet, L.P., Dymek, R.F., Haskin, L.A., and Korotev, R.L. 1984. <strong>The</strong> “North American Shale<br />
Composite:” its compilation, major and trace element characteristics. Geochimica et<br />
Cosmochimica Acta, 48, p. 2469–2482.<br />
Grootenboer, J., and Schwarcz, H.P. 1969. Experimentally determined sulfur isotope<br />
fractionation between sulfide minerals. Earth and Planetary Science Letters, 7,<br />
p. 162–166.
46<br />
Han, Y., and Pickerill, R.K. 1994. Palichnology of the Lower Devonian Wapske Formation,<br />
Perth-Andover–<strong>Mount</strong> Carleton region, northwestern <strong>New</strong> Brunswick, eastern Canada.<br />
Atlantic Geology, 30, p. 217–245.<br />
Hughes, C.J. 1972. Spilites, keratophyres and the igneous spectrum. Geology Magazine, 109,<br />
p. 513–527.<br />
Irrinki, R.R. 1990. Geology of the Charlo area; Restigouche County, <strong>New</strong> Brunswick. <strong>New</strong><br />
Brunswick Department of Natural Resources and Energy; Mineral Resources, Report of<br />
Investigation 24, 118 p.<br />
Kajiwara, Y., and Krouse, H.R.1971. Sulfur isotope partitioning in metallic sulfide systems.<br />
Canadian Journal of Earth Sciences, 8, p. 1397–1408.<br />
Lac Minerals. 1989. Report of work on the <strong>Mount</strong> <strong>Costigan</strong> claim Group for Lac Minerals Ltd.<br />
<strong>New</strong> Brunswick Department of Natural Resources; Lands, Minerals and Petroleum<br />
Division, Assessment Report 473621.<br />
Lavoie, C. 1982. Report of work on the <strong>Mount</strong> <strong>Costigan</strong> Project by Long Lac Explopration for<br />
Amoco Canada Petroleum Company Ltd. <strong>New</strong> Brunswick Department of Natural<br />
Resources; Lands, Minerals and Petroleum Division, Assessment Report 472881.<br />
Le Bas, M.J., Le Maitre, R.W., Streckeisen, A., and Zanettin, B. 1986. A chemical<br />
classification of volcanic rocks based on the total alkali-silica diagram. Journal of<br />
Petrology, 27, p. 745–750.<br />
Leitch, C.H.B., and Lentz, D.R. 1994. <strong>The</strong> Gresens approach to mass balance constraints of<br />
alteration systems: methods, pitfalls, examples. In Alteration and Alteration Processes<br />
Associated with Ore-Forming Systems. Edited by D.R. Lentz. Geological Association of<br />
Canada, Short Course Notes, 11, p. 161–192.<br />
Le Maitre, R.W., Bateman, P., Dudek, A., Keller, J., Lameyre Le Bas, M.J., Sabine, P.A.,<br />
Schmid, R., Sorensen, H., Streckeisen, A., Wolley, A.R., and Zanettin, B. 1989. A<br />
Classification of Igneous Rocks and Glossary of Terms. Blackwell, Oxford, 193 p.<br />
Lydon, J.W. 1988. Volcanogenic massive sulphide deposits, part 2: genetic models. Geoscience<br />
Canada, 11, p. 195–202. In Geoscience Canada Reprint Series 3. Edited by R.G. Roberts,<br />
and P.A. Sheahan, p. 155–181.<br />
MacLean, W.H. 1963. Report of work on the <strong>Mount</strong> <strong>Costigan</strong> Claim Group for <strong>Mount</strong> <strong>Costigan</strong><br />
Mines Ltd. <strong>New</strong> Brunswick Department of Natural Resources; Lands, Minerals and<br />
Petroleum Division, Assessment Report 470302.<br />
Maingot, P.J. 1974. Report on Ogilvie (<strong>Costigan</strong> <strong>Mount</strong>ain) Group, Tobique follow-up project,<br />
<strong>New</strong> Brunswick. Amoco Petroleum Company Ltd. <strong>New</strong> Brunswick Department of Natural<br />
Resources; Lands, Minerals and Petroleum Division, Assessment Report 470297.<br />
McCutcheon, S.R., and Walker, J.A. 2008. Volcanological constraints on the genesis of<br />
Brunswick-type VMS deposits in the Bathurst Mining Camp. Abstract, GAC/MAC Joint<br />
Annual Meeting, Quebec City, Quebec, Canada, p. 108.<br />
<strong>Mount</strong> <strong>Costigan</strong> Mines. 1955. Report of work on the <strong>Mount</strong> <strong>Costigan</strong> Claim Group for <strong>Mount</strong><br />
<strong>Costigan</strong> Mines Ltd. <strong>New</strong> Brunswick Department of Natural Resources; Lands, Minerals<br />
and Petroleum Division, Assessment Report 470300.<br />
Nakamura, N. 1974. Determination of REE, Ba, Fe, Mg, Na and K in carbonaceous and<br />
ordinary chondrites. Geochemica et Cosmochimica Acta, 38, p. 757–775.
47<br />
<strong>New</strong> Brunswick Department of Natural Resources (NBDNR). 2011. <strong>New</strong> Brunswick Mineral<br />
Occurrence database. >. Accessed<br />
October 2011.<br />
Panteleyev, A. 1988. A Canadian Cordilleran model for epithermal gold-silver deposits.<br />
Geoscience Canada, 11, p. 195–202. In Geoscience Canada Reprint Series 3. Edited by<br />
R.G. Roberts and P.A. Sheahan, p. 31–43.<br />
Pearce, J.A., and Norry, M.J. 1979. Petrogenetic implications of Ti, Zr, Y and Nb variations in<br />
volcanic rocks. Contributions to Mineralogy and Petrology, 69, p. 33–47.<br />
Riddell, J.E. 1971. Summary report on properties in the Gulquac River–<strong>Costigan</strong> <strong>Mount</strong>ain<br />
area for Silcan Mines Ltd. <strong>New</strong> Brunswick Department of Natural Resources; Lands,<br />
Minerals and Petroleum Division, Assessment Report 470303.<br />
Rose, D.G., and Johnson, S.C. 1990. <strong>New</strong> Brunswick computerized mineral occurrence<br />
database. <strong>New</strong> Brunswick Department of Natural Resources; Lands, Minerals and<br />
Petroleum Division, Mineral Resource Report 3, p. 69.<br />
St. Peter, C. 1978a. Geology of head of Wapske River. Map area J-13, NTS 21 J/14. Map<br />
Report 78-1. Including map at 1 inch:1/4 mile scale. <strong>New</strong> Brunswick Department of<br />
Natural Resources; Lands, Minerals and Petroleum Division, Map Plate 78-1.<br />
St. Peter, C. 1978b. Geology of parts of Restigouche, Victoria and Madawaska counties,<br />
northwestern <strong>New</strong> Brunswick, NTS 21 N/8, 21 N/9, 21 O/5, 21 O/11, 21 O/14. Report of<br />
Investigations 17, <strong>New</strong> Brunswick Department of Natural Resources and Energy; Mineral<br />
Resources Division, 69 p.<br />
Shanks, W.C., III, Woodruff, L.G., Jilson, G.A., Jennings, D.S., Modene, J.S., and Ryan, B.D.<br />
1987. Sulfur and lead isotope studies of stratiform <strong>Zn–Pb–Ag</strong> deposits, Anvil range,<br />
Yukon: basinal brine exhalation and anoxic bottom-water mixing. Economic Geology, 82,<br />
p. 600–634.<br />
Smith, E.A, and Fyffe, L.R. (compilers). 2006a. Bedrock geology of the Plaster Rock area<br />
(NTS 21 J/14), Victoria County, <strong>New</strong> Brunswick. <strong>New</strong> Brunswick Department of Natural<br />
Resources; Lands, Minerals and Petroleum Division, Map Plate 2006-15, 1:50,000 scale.<br />
Smith, E.A, and Fyffe, L.R. (compilers). 2006b. Bedrock geology of the Tuadock Lake map area<br />
(NTS 21 J/15), Victoria County, <strong>New</strong> Brunswick. <strong>New</strong> Brunswick Department of Natural<br />
Resources; Lands Minerals and Petroleum Division, Map Plate 2006-16, 1:50,000 scale.<br />
Taylor, M. 1995. Report of work on the <strong>Costigan</strong> Claim Group for Michael Taylor. <strong>New</strong><br />
Brunswick Department of Natural Resources; Lands, Minerals and Petroleum Division,<br />
Assessment Report 474671.<br />
Thompson A.J.B., and Thompson, J.F.H. 1996. Atlas of alteration: a field and petrographic<br />
guide to hydrothermal alteration minerals. Mineral <strong>Deposit</strong>s Division, Geological<br />
Association of Canada, ISBN 0-919216-59-5, p. 119.<br />
Turner, R.W. 1996a. Report of work on the <strong>Costigan</strong> project for Chapleau Resources. <strong>New</strong><br />
Brunswick Department of Natural Resources; Lands, Minerals and Petroleum Division,<br />
Assessment Report 474792.<br />
Turner, R.W. 1996b. Report of work on the <strong>Costigan</strong> project for Chapleau Resources. <strong>New</strong><br />
Brunswick Department of Natural Resources; Lands, Minerals and Petroleum Division,<br />
Assessment Report 474793.
48<br />
van Staal, C.R., and de Roo, J.A. 1995. Mid-Paleozoic tectonic evolution of the Canadian<br />
Appalachian <strong>Central</strong> Mobile Belt in northern <strong>New</strong> Brunswick, Canada: collision,<br />
extensional collapse and dextral transpression. In Current perspectives in the<br />
Appalachian–Caledonian Orogen. Edited by J.P. Hibbard, C.R. van Staal, and P.A.<br />
Cawood. Geological Association of Canada, Special Paper 41, p. 367–389.<br />
van Staal, C.R., Whalen, J.B., Valverde-Vaquero, P., Zagorevski, A., and Rogers, N. 2009.<br />
Pre-Carboniferous, episodic accretion-related, orogenesis along the Laurentian margin of<br />
the northern Appalachians. In Ancient Orogens and Modern Analogues. Edited by J.B.<br />
Murphy, J.D. Keppie, and A.J. Hynes. Geological Society, London, Special Publication<br />
327, p. 271–316.<br />
Walker, J.A. 2003. Base-metal deposits of the Siluro-Devonian Tobique–Chaleurs Belt, <strong>West</strong><br />
<strong>Central</strong> <strong>New</strong> Brunswick, Canada. In Abstracts Volume, I st Joint Meeting Northeastern<br />
Section, Geological Society of America, and the Atlantic Geoscience Society. Halifax<br />
Nova Scotia, 35, Issue 3, p. 19.<br />
Walker, J.A. 2005. Petrogenesis and tectonic setting of Devonian volcanic and related rocks<br />
and their control on mineralization at the Shingle Gulch East <strong>Zn–Pb–Ag</strong> sulfide deposit,<br />
northwest <strong>New</strong> Brunswick. Unpublished Ph.D. thesis, University of <strong>New</strong> Brunswick,<br />
Fredericton, 430 p.<br />
Walker, J.A. 2010. Stratigraphy and lithogeochemistry of Early Devonian volcano-sedimentary<br />
rocks hosting the Nash Creek <strong>Zn–Pb–Ag</strong> deposit northern <strong>New</strong> Brunswick. In Geological<br />
Investigations in <strong>New</strong> Brunswick for 2009. Edited by G.L. Martin. <strong>New</strong> Brunswick<br />
Department of Natural Resources; Lands, Minerals and Petroleum Division, Mineral<br />
Resources Report 2010-1, p. 52–97.<br />
Walker, R.T. 1998. Report of work on the <strong>Costigan</strong> Claim Group for Michael Taylor. <strong>New</strong><br />
Brunswick Department of Natural Resources; Lands, Minerals and Petroleum Division,<br />
Assessment Report 475097.<br />
Watson, E.B., and Harrison, T.M. 1983. Zircon saturation revisited: temperature and<br />
composition effects in a variety of crustal magma types. Earth and Planetary Science<br />
Letters, 64, p. 295–304.<br />
Whalen, J.B. 1993. Geology, petrography, and geochemistry of Appalachian granites in <strong>New</strong><br />
Brunswick and Gaspésie, Québec. Geological Survey of Canada Bulletin 436, p. 124.<br />
Whalen, J.B., Jenner, G.A., Hegner, E., Garipey, C., and Longstaffe, F.J. 1994. Geochemical<br />
and isotopic (Nd, O and Pb) constraints on granite sources in the Humber and Dunnage<br />
zones, Gaspésie, Québec, and <strong>New</strong> Brunswick: implications for tectonics and crustal<br />
structure. Canadian Journal of Earth Sciences, 31, p. 323–340.<br />
Whalen, J.B., Jenner, G.A., Longstaffe, F.J., and Hegner, E. 1996. Nature and evolution of the<br />
eastern margin of Iapetus: geochemical and isotopic constraints from Siluro–Devonian<br />
granitoid plutons in the <strong>New</strong> Brunswick Appalachians. Canadian Journal of Earth<br />
Sciences, 33, p. 140–155.<br />
Wilson, R.A. 1990. Geology of the Riley Brook area, <strong>New</strong> Brunswick, NTS 21 O/3E, part of 21<br />
O/2W. <strong>New</strong> Brunswick Department of Natural Resources; Lands, Mines and Petroleum<br />
Division, Map-Plate 90-162, 1:50,000 scale.
49<br />
Wilson, R.A. 1992. Petrographic features of Siluro–Devonian felsic volcanic rocks in the Riley<br />
Brook area, Tobique Zone, <strong>New</strong> Brunswick: implications for base-metal mineralization at<br />
Sewell Brook. Atlantic Geology, 28, p. 115–135.<br />
Wilson, R.A., and Kamo, S.L. 2012. <strong>The</strong> Salinic Orogeny in northern <strong>New</strong> Brunswick:<br />
geochronological constraints and implications for Silurian stratigraphic nomenclature.<br />
Canadian Journal of Earth Sciences, 49, p. 222–138.<br />
Wilson, R.A., Burden, E.T., Bertrand, R., Asselin, E., and McCracken, A.D. 2004. Stratigraphy<br />
and tectono-sedimentary evolution of the Late Ordovician to Middle Devonian Gaspé Belt<br />
in northern <strong>New</strong> Brunswick: evidence from the Restigouche area. Canadian Journal of<br />
Earth Sciences, 41, p. 527–551.<br />
Winchester, J.A., and Floyd, P.A. 1977. Geochemical discrimination of different magma series<br />
and their differentiation products using immobile elements. Chemical Geology, 20, p.<br />
325–343.<br />
Yang X.-M, and Lentz, D.R. 2010. Sulfur isotopic systematics of granitoids from southwestern<br />
<strong>New</strong> Brunswick, Canada: implications for magmatic–hydrothermal processes, redox<br />
conditions, and gold mineralization. Mineralium <strong>Deposit</strong>a, 45, p. 795–816.<br />
Zartman, R.E., and Doe, B.R. 1981. Plumbotectonics—the model. Tectonophysics, 75, p.<br />
135–162.