Universität Innsbruck: At a Glance 2024
Facts and Figures on the University of Innsbruck
Facts and Figures on the University of Innsbruck
- No tags were found...

You also want an ePaper? Increase the reach of your titles
YUMPU automatically turns print PDFs into web optimized ePapers that Google loves.
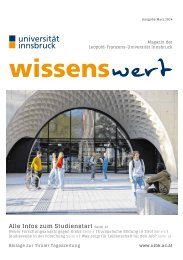
<strong>Universität</strong> <strong>Innsbruck</strong><br />
<strong>At</strong> a <strong>Glance</strong> <strong>2024</strong>
<strong>At</strong> a<br />
<strong>Glance</strong><br />
Students (total)<br />
27,583 (persons)<br />
International students 14,081 (51.0%)<br />
Graduates 4,312<br />
Programs 134<br />
Lectures<br />
Approx. 4,000/semester<br />
Staff (total)<br />
5,629 (persons)<br />
Academic<br />
3,982 (persons)<br />
Non-academic<br />
1,647 (persons)<br />
Publications 4,315<br />
Publications in Web of Science 1,492<br />
Co-authored with international scholars 68.6%<br />
Budget (total)<br />
406.6 million Euro<br />
Third-party funding and other revenue<br />
81.0 million Euro<br />
2<br />
2
Address- Foreword<br />
With this brochure I invite you to explore our university by<br />
the numbers. Without a doubt our students, faculty and<br />
staff continued to show strength and achieve excellence in<br />
teaching, learning and research.<br />
Significant progress and exceptional accomplishments have<br />
been made in key priority areas by our community. As an<br />
illustration, through collaborative efforts, we achieved<br />
the publication of approximately 1,500 articles in leading<br />
international journals (of which 81% are freely available<br />
online) and secured over 72 million euros in external<br />
funding in 2023. The high appeal to international students<br />
(51%) and a share of almost 69% of publications in Web<br />
of Science with international co-authors are a remarkable<br />
testament to our university’s international focus and<br />
recognition.<br />
An exciting first year lies behind the new Rectorate of the<br />
University of <strong>Innsbruck</strong>. We are convinced that together<br />
with all members of our university we will succeed in<br />
consolidating the role of our alma mater as one of the<br />
largest and best performing educational institutions in<br />
Austria.<br />
Univ.-Prof. Dr. Veronika Sexl<br />
Rector of the <strong>Universität</strong> <strong>Innsbruck</strong><br />
www.uibk.ac.at
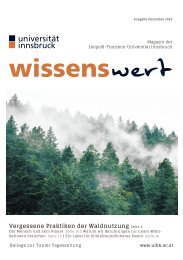
comment-53.6% 46.4%<br />
Total number of<br />
students 27,583<br />
WS 23/24<br />
Nationality of<br />
newly enrolled<br />
students<br />
■ Austria<br />
■ EU<br />
■ Other<br />
39.0%<br />
9.7%<br />
51.3%<br />
4<br />
4
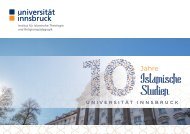
USER-FRI Number of students<br />
)!!!!<br />
(!!!!<br />
47.4%<br />
'!!!!<br />
38.6%<br />
&!!!!<br />
27,830<br />
%!!!!<br />
)!"!#<br />
(!"!#<br />
'!"!#<br />
61.0%<br />
51.0%<br />
&!"!#<br />
%!"!#<br />
27,583<br />
Internationality<br />
Percentage of newly enrolled international students<br />
Percentage of international students<br />
Total number of students<br />
Newly enrolled students<br />
$!!!!<br />
$!"!#<br />
4,583<br />
4,746<br />
!<br />
!"!#<br />
*+ *+ *+ *+ *+ *+ *+ *+ *+ *+ *+<br />
%!$&,$' %!$',$( %!$(,$) %!$),$- %!$-,$. %!$.,$/ %!$/,%! %!%!,%$ %!%$,%% %!%%,%& %!%&,%'<br />
WS 2013/14 WS 2023/24<br />
WS 21/22 WS 22/23 WS 23/24<br />
Total number of students 28,077 27,846 27,583<br />
Female students 15,020 14,888 14,771<br />
Male students 13,057 12,958 12,812<br />
Total number of international students 13,378 13,706 14,081<br />
Female international students 6,869 7,050 7,258<br />
Male international students 6,509 6,656 6,823<br />
Percentage of international students 47.6% 49.2% 51.0%<br />
Newly enrolled students 4,496 4,429 4,746
29,787<br />
Program<br />
enrollments<br />
Program enrollments<br />
Winter term 2023/24<br />
per Faculty<br />
(Bachelor, Master, Diploma, Doctorate)<br />
6<br />
6<br />
female male total<br />
Faculty of Architecture 962 959 1,921<br />
Faculty of Business and Management 1,725 2,125 3,850<br />
Faculty of Educational Sciences 1,173 257 1,430<br />
Faculty of Biology 1,249 691 1,941<br />
Faculty of Chemistry and Pharmacy 1,218 773 1,991<br />
Faculty of Geo- and <strong>At</strong>mospheric Sciences 641 817 1,459<br />
Faculty of Teacher Education 115 46 161<br />
Faculty of Mathematics, Computer Science and Physics 654 1,912 2,566<br />
Faculty of Psychology and Sport Science 1,552 1,127 2,679<br />
School of Social and Political Sciences 837 580 1,417<br />
Faculty of Engineering Sciences 228 1,139 1,367<br />
Faculty of Economics and Statistics 549 630 1,180<br />
Faculty of Catholic Theology 156 287 442<br />
Faculty of Language, Literature and Culture 1,558 407 1,965<br />
Faculty of Philosophy and History 1,233 910 2,143<br />
Faculty of Law 1,891 1,384 3,275<br />
Total 15,741 14,044 29,787
User-Gra Enrollments and Graduates<br />
4,312<br />
Graduates<br />
female male total<br />
165 133 298<br />
310 329 640<br />
209 29 238<br />
178 112 290<br />
193 128 321<br />
88 83 171<br />
27 13 40<br />
81 236 317<br />
344 203 547<br />
125 67 192<br />
43 161 204<br />
114 123 236<br />
17 21 38<br />
237 47 284<br />
120 78 198<br />
166 132 298<br />
2,417 1,895 4,312<br />
0 100 200 300 400 500 600<br />
Graduates<br />
Academic year 2022/23<br />
per faculty<br />
(Bachelor, Master, Diploma, Doctorate)<br />
female<br />
male
Degrees awarded<br />
2,308<br />
1,439<br />
305<br />
223<br />
8<br />
8<br />
2013 2023<br />
Bachelor<br />
Diploma<br />
Master<br />
PhD/Doctorate<br />
Degrees.<br />
The Bologna Process was designed to harmonize study<br />
programs and to promote student mobility throughout<br />
Europe. The most significant change was the conversion<br />
of the study programs to the three-cycle system Bachelor/<br />
Master/PhD.
graduati Degrees - Gender Ratio<br />
59%<br />
57%<br />
54% 62%<br />
Gender ratio<br />
of graduates<br />
in 2022/23<br />
41% 43%<br />
46% 38%<br />
Bachelor, Master, Diploma and<br />
Phd/Doctorate degrees awarded<br />
Bachelor Diploma Master PhD/Doctorate<br />
Percentage female graduation<br />
Percentage male graduation
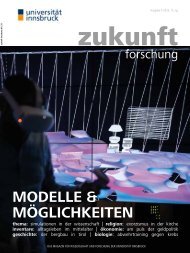
Long term<br />
development of budget<br />
328.8 Mio. EUR<br />
+ 54.8%<br />
212.4 Mio. EUR<br />
44.8 Mio. EUR<br />
77.7 Mio. EUR<br />
+ 73.5%<br />
2013 2023<br />
Global budget<br />
Third-party funding<br />
10<br />
10
COINS Budget<br />
Global budget 2023 Third-party funding 2023<br />
20.5<br />
28.4<br />
in EUR million<br />
3.7 1.3<br />
17.6<br />
in EUR million<br />
66.0<br />
Staff<br />
Overhead expenses<br />
214.0<br />
Other material expenses<br />
Depreciation<br />
55.2<br />
Staff<br />
Other material expenses<br />
Depreciation<br />
Overhead expenses<br />
2021 2022 2023 2023 2023<br />
in EUR million total total total Global budget Third-party<br />
funding and ffs<br />
Total expenses 333.2 366.1 406.6 328.8 77.7<br />
Staff 230.3 240.7 269.1 214.0 55.2<br />
Overhead expenses 47.5 51.7 67.3 66.0 1.3<br />
Other material expenses 35.3 52.4 46.0 28.4 17.6<br />
Depreciation 20.1 21.2 24.1 20.5 3.7<br />
Revenues 351.9 364.5 405.3 324.3 81.0
Long term development<br />
of third-party funding<br />
57.7 Mio. EUR<br />
31.5 Mio. EUR<br />
5.7 Mio. EUR 8.8 Mio. EUR<br />
3.5 Mio. EUR<br />
5.4 Mio. EUR<br />
2013 2023<br />
Third-party funding from public sector<br />
Companies<br />
Other third-party funding<br />
12<br />
12
Chart-Pi Third-party funding<br />
in EUR 2021 2022 2023<br />
Third-party funding from public sector 46,453,036 51,579,956 57,744,984<br />
Austrian Science Fund 18,192,877 20,152,163 22,524,411<br />
Federal and Provincial Governments, Municipalities and<br />
other public entities<br />
13,329,331 14,540,731 16,323,012<br />
European Union and other international organizations 8,869,201 9,767,847 10,419,530<br />
Austrian Research Promotion Agency 6,061,627 7,119,214 8,478,031<br />
Companies 4,811,435 6,130,241 8,772,946<br />
Other third-party funding 5,338,605 5,319,265 5,426,866<br />
Total 56,603,077 63,029,462 71,944,795
Long term development<br />
of publications<br />
4,315 / +17.5%<br />
3,673<br />
1,942<br />
1,331<br />
1,061<br />
196<br />
2,354 / +21.2%<br />
1,558 / +17.1%<br />
1,492 / +40.6%<br />
197 / +0.5%<br />
2013 2023<br />
14<br />
14<br />
Total publications<br />
Total journal publications<br />
Book chapters<br />
WoS journal publications<br />
Books
Open Access publications<br />
in Web of Science (WoS)<br />
54.1%<br />
56.7%<br />
58.9%<br />
60.1%<br />
63.8%<br />
67.0%<br />
70.1%<br />
76.2%<br />
80.9%<br />
80.1%<br />
80.9%<br />
68.6%<br />
of all Web of Science<br />
publications in 2023<br />
were co-authored with<br />
international scholars<br />
2013 2023<br />
Percentage of Open Access<br />
publications in Web of Science
comment-Staff<br />
5,629<br />
total<br />
2,349<br />
1,433<br />
763<br />
2,893<br />
1,647<br />
1,089<br />
20131 2012 2013 2014 2015 2016 2017 2018 2023<br />
Academic staff<br />
Non-academic staff<br />
Third-party funded staff<br />
2021 2022 2023 female male<br />
Total number of academic staff 3,966 3,992 3,982 1,677 2,315<br />
Professors 300 313 307 90 217<br />
Other academic staff 2,665 2,598 2,586 1,132 1,464<br />
Third-party funded staff 1,001 1,081 1,089 455 634<br />
Non-academic staff 1,607 1,590 1,647 997 650<br />
Total 5,573 5,582 5,629 2,674 2,965<br />
16<br />
16
User-plu Staff<br />
Professors per student<br />
Supervisory ratio<br />
improved by<br />
22%<br />
over the last 10 years.<br />
2013 2023<br />
Professors 365 464<br />
+28.5%<br />
Students 27,830 27,583<br />
Supervisory ratio 1:76 1:59<br />
100%<br />
-0.7%<br />
Development of number of professors in percent<br />
Development of number of students in percent<br />
2013 2023
Resources and<br />
infrastructure<br />
+58.1% = 406.6 Mio. EUR<br />
+24.1% = 5,606 staff<br />
+12.4% = 216,581 m 2<br />
100%<br />
-0.9% = 27,583 students<br />
2013 2023<br />
Budget<br />
Staff<br />
Usable area<br />
Students<br />
Development of the parameters<br />
“Budget”, “Staff”, “Usable area” and “Students”<br />
in comparison.<br />
18<br />
18
Infrastructure<br />
2013 2023<br />
Locations 4 7<br />
Usable area 192,636m² 216,581m²<br />
Research Institute for<br />
Limnology, Mondsee<br />
Mondsee<br />
Institute of Applied<br />
Sociology of Law<br />
and Criminology<br />
Wien<br />
Research Institute for Textile<br />
Chemistry<br />
and Textile Physics<br />
Dornbirn<br />
<strong>Innsbruck</strong><br />
Economy, Health and<br />
Sports Tourism<br />
Landeck<br />
Obergurgl<br />
Campus Lienz<br />
Lienz
Imprint<br />
Concept and coordination: Office of Public Relations, Research Information<br />
Unit | Graphics and design: Office of Public Relations | Photo credits:<br />
<strong>Universität</strong> <strong>Innsbruck</strong>, W9 Studios, Adobe Stock, innsbruckphoto.at |<br />
Print: Agentur Taurus, © BfÖ <strong>2024</strong><br />
<strong>Universität</strong> <strong>Innsbruck</strong><br />
Christoph-Probst-Platz, Innrain 52<br />
A-6020 <strong>Innsbruck</strong><br />
FACEBOOK INSTAGRA MASTODON YOUTUBE TIKTOK /uniinnsbruck<br />
#uniinnsbruck<br />
www.uibk.ac.at<br />
20