Canada's craton: A bottoms-up view - Geological Society of America
Canada's craton: A bottoms-up view - Geological Society of America
Canada's craton: A bottoms-up view - Geological Society of America

You also want an ePaper? Increase the reach of your titles
YUMPU automatically turns print PDFs into web optimized ePapers that Google loves.
PALEOGEOTHERMS AND THE THERMAL HISTORY<br />
OF CRATONS<br />
The cooling <strong>of</strong> the earth and the distribution <strong>of</strong> its heat<br />
sources have long been <strong>of</strong> interest (Pollack and Chapmen,<br />
1977; Verhoogen, 1956) but with few direct constraints. I examine<br />
the cooling history <strong>of</strong> <strong>craton</strong>s with a focus on the Archean<br />
Slave Province in Canada using available heat flow measurements,<br />
geochronological data, and pressure-temperature (P-T)<br />
data for xenoliths that cover a 300 km length <strong>of</strong> the province<br />
(Fig. 2). The P-T data are based on analyses from the same<br />
electron microprobe laboratory, eliminating interlaboratory<br />
inconsistency and enhancing precision.<br />
The P-T arrays <strong>of</strong> xenoliths from the Gahcho Kue, Grizzly,<br />
and Jericho pipes in the Slave Province are identical within<br />
error <strong>of</strong> the thermobarometers applied, despite the fact that<br />
these kimberlites vary in age by 500 m.y. (Fig. 3). I fit the P-T<br />
arrays to a “steady state” geotherm with input parameters <strong>of</strong><br />
(1) surface heat flow, heat generation, and crustal thickness<br />
measured in the central Slave Province (Mareschal et al., 2004);<br />
(2) crustal heat generation <strong>of</strong> 0.6 μWm −2 (Rudnick and Nyblade,<br />
1999; Russell et al., 2001); and (3) an empirical fit <strong>of</strong> change in<br />
thermal conductivity with depth (MacKenzie and Canil, 1999).<br />
The thermal structure <strong>of</strong> the Slave Province mantle has not<br />
changed significantly in the past 500 m.y. over a scale <strong>of</strong> ~300<br />
km (Fig. 3). The uniform thermal structure contrasts with the<br />
petrologic structure, which varies vertically and laterally across<br />
the province. In plan <strong>view</strong>, the Slave mantle structure consists<br />
<strong>of</strong> three NE-striking ribbons <strong>of</strong> lithosphere with different levels<br />
<strong>of</strong> depletion, as deduced by garnet geochemistry (Grütter et<br />
al., 1999), that parallel slight changes in the direction <strong>of</strong> seismic<br />
anisotropy (Davis et al., 2003b) (Fig. 2). The vertical distribution<br />
<strong>of</strong> mantle peridotite in the ~180–220-km-thick lithosphere<br />
66 N<br />
o<br />
63 N<br />
o<br />
Wopmay Fault<br />
Great Slave Lake<br />
Dry Bones<br />
114 W<br />
o<br />
114 W<br />
o<br />
Coronation Gulf<br />
Jericho<br />
110 W<br />
o<br />
Slave Craton<br />
Torrie<br />
110 W<br />
o<br />
Grizzly<br />
Gatcho<br />
Kue<br />
Taltson Arc<br />
Kilihigok<br />
Basin<br />
McDonald Fault<br />
100 km<br />
66 N<br />
o<br />
66 N<br />
o<br />
63 N<br />
o<br />
consists <strong>of</strong> a shallow, ultradepleted layer underlain by a deeper,<br />
more fertile layer (Griffin et al., 1999a; Kopylova and Russell,<br />
2000; Kopylova and Caro, 2004). The ultradepleted layer tapers<br />
to the southwest near Drybones Bay, where its base coincides<br />
with changes in seismic anisotropy over a narrow interval<br />
between 110 and 130 km depth (Carbno and Canil, 2002). This<br />
seismic discontinuity has been interpreted as the remnant <strong>of</strong> a<br />
lithospheric underthrust or “stack” (Bostock, 1998).<br />
Although Slave Province mantle can be considered to be in<br />
a thermal steady-state at the time <strong>of</strong> sampling by kimberlites<br />
over the past 550 m.y., this state reveals nothing <strong>of</strong> when this<br />
equilibrium was reached, which, given the thermal time constant<br />
for 200-km-thick lithosphere, is ~1–2 b.y. (Mareschal and<br />
Ja<strong>up</strong>art, 2006). Furthermore, the paleogeotherm gives no direct<br />
information on the mantle heat flow at the end <strong>of</strong> the Archean<br />
when the Slave Province is presumed to have “stabilized.” If<br />
the lithosphere was to remain strong and stabilize the <strong>craton</strong>,<br />
its initial temperature must have been below the steady-state<br />
regime, with basal heat flow the same as today (Mareschal and<br />
Ja<strong>up</strong>art, 2006), a condition made permissible if the lithospheric<br />
root formed by accretion <strong>of</strong> “cold” subducting plates.<br />
AGE OF CRATONIC MANTLE “ROOTS”<br />
The Re-Os isotopic system has been employed extensively<br />
to estimate the age <strong>of</strong> peridotitic mantle lithosphere (Pearson,<br />
1999). The Re/Os ratio <strong>of</strong> mantle residue decreases with melt<br />
extraction and over time evolves to low 187 Os/ 188 Os isotopic<br />
ratios. Some measure <strong>of</strong> the minimum age <strong>of</strong> the lithosphere<br />
can be made from 187 Os/ 188 Os by assuming all Re was lost on<br />
melting to produce a “Re depletion age” (T RD) <strong>of</strong> a sample.<br />
The T RD for kimberlite-borne mantle xenoliths from the<br />
Slave, Wyoming, and North Atlantic (Somerset Island) provinces<br />
Conductive mantle anomaly<br />
Proterozoic Basin<br />
Juvenile Basement<br />
Mesoarchean Basement<br />
Kimberlite pipes<br />
S-wave polarization<br />
Mantle Domain Boundary<br />
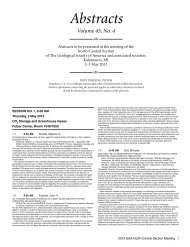
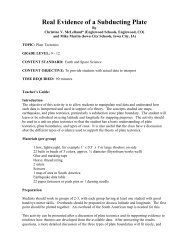
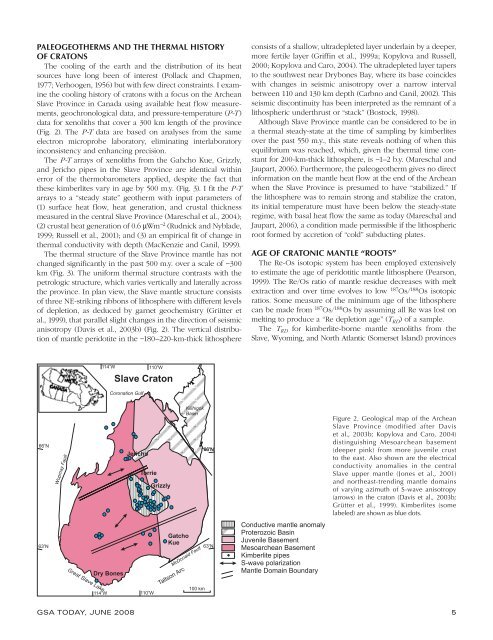
Figure 2. <strong>Geological</strong> map <strong>of</strong> the Archean<br />
Slave Province (modified after Davis<br />
et al., 2003b; Kopylova and Caro, 2004)<br />
distinguishing Mesoarchean basement<br />
(deeper pink) from more juvenile crust<br />
to the east. Also shown are the electrical<br />
conductivity anomalies in the central<br />
Slave <strong>up</strong>per mantle (Jones et al., 2001)<br />
and northeast-trending mantle domains<br />
<strong>of</strong> varying azimuth <strong>of</strong> S-wave anisotropy<br />
(arrows) in the <strong>craton</strong> (Davis et al., 2003b;<br />
Grütter et al., 1999). Kimberlites (some<br />
labeled) are shown as blue dots.<br />
GSA TODAY, JUNE 2008 5