Canada's craton: A bottoms-up view - Geological Society of America
Canada's craton: A bottoms-up view - Geological Society of America
Canada's craton: A bottoms-up view - Geological Society of America

You also want an ePaper? Increase the reach of your titles
YUMPU automatically turns print PDFs into web optimized ePapers that Google loves.
ulk <strong>of</strong> the lithosphere. Thus, the age <strong>of</strong><br />
the “root” formation may be younger<br />
than the age <strong>of</strong> the lithosphere that comprises<br />
the root. This hypothesis is consistent<br />
with U-Pb ages from lower crustal<br />
granulite xenoliths, which show that the<br />
Slave <strong>craton</strong> root cooled through the<br />
U-Pb blocking temperature <strong>of</strong> metamorphic<br />
rutile (~400 °C) to a present-day<br />
<strong>craton</strong>ic geotherm only by ca. 1.8 Ga,<br />
well after the Archean (Fig. 4). Similarly,<br />
1.9-Ga sedimentary basins on the Slave<br />
Province record subsidence on a thinner,<br />
root-free thermal lithosphere at that time<br />
(Grotzinger and Royden, 1990).<br />
Most intriguing is that the Re-Os ages<br />
<strong>of</strong> sulfides in kimberlite-borne diamonds<br />
sampled from the Slave Province, presumably<br />
hosted in the lithosphere, are ca. 3.5<br />
Ga (Aulbach et al., 2004; Westerlund et<br />
al., 2006) and pre-date the NeoArchean<br />
(2.8–2.55 Ga) formation and amalgamation<br />
<strong>of</strong> overlying crust by at least 0.5 b.y.<br />
A similar pattern is evident in the S<strong>up</strong>erior<br />
Province <strong>of</strong> Canada (Stachel et al.,<br />
2006) and in Kaapvaal <strong>of</strong> southern Africa<br />
(Richardson et al., 2001). In the mantle,<br />
sulfide is molten and potentially mobile,<br />
and Os has a low closure temperature<br />
in this phase (Brenan et al., 2000), calling<br />
into question the validity <strong>of</strong> diamond<br />
ages from sulfide and other inclusions<br />
(Navon, 1999). Nonetheless, if the ages<br />
are taken at face value, they show that<br />
the formation <strong>of</strong> mantle lithosphere predates<br />
its development into a <strong>craton</strong> “root”<br />
below Archean crust by 0.5–1.0 Ga.<br />
TECTONIC SETTING FOR<br />
CRATONIC LITHOSPHERE<br />
Mantle lithosphere is a residue <strong>of</strong> melt<br />
extraction from peridotite, which at<br />
pressures below ~3 GPa produces olivine<br />
at the expense <strong>of</strong> all other phases<br />
and increases its Mg/Fe with depletion.<br />
This attribute <strong>of</strong> the melting process is<br />
reflected geochemically in residual peridotites<br />
by increasing Mg/Si with increasing<br />
Mg/(Mg + Fe), as exhibited by<br />
peridotites sampled in modern ocean<br />
basins, ophiolites, orogenic massifs, or<br />
continental basalt-hosted xenoliths (Fig.<br />
5). Most <strong>craton</strong>ic lithosphere is distinct<br />
from the latter by being depleted in Fe<br />
(high Mg#) but having variable Mg/Si<br />
(Figs. 5B and 5C) (Boyd, 1989). The<br />
compositional spectrum <strong>of</strong> low Fe and<br />
high Si in <strong>craton</strong>ic peridotites is unattainable<br />
by melting <strong>of</strong> primitive mantle<br />
Mg/(Mg+Fe)<br />
0.95<br />
0.94<br />
0.93<br />
0.92<br />
0.91<br />
0.9<br />
0.89<br />
0.88<br />
0.87<br />
0.95<br />
0.94<br />
0.93<br />
0.92<br />
0.91<br />
0.9<br />
0.89<br />
0.88<br />
0.87<br />
0.95<br />
0.94<br />
0.93<br />
0.92<br />
0.91<br />
0.9<br />
0.89<br />
0.88<br />
0.87<br />
1.6<br />
A<br />
B<br />
C<br />
1.5<br />
1.4<br />
abyssal<br />
<strong>of</strong>f <strong>craton</strong> xeno<br />
Slave sper<br />
Slave gper<br />
Somerset sper<br />
Somerset gper<br />
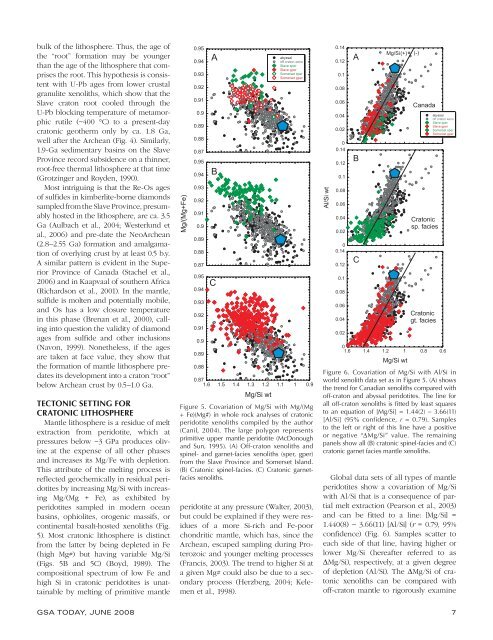
Global data sets <strong>of</strong> all types <strong>of</strong> mantle<br />
peridotites show a covariation <strong>of</strong> Mg/Si<br />
with Al/Si that is a consequence <strong>of</strong> partial<br />
melt extraction (Pearson et al., 2003)<br />
and can be fitted to a line: [Mg/Si] =<br />
1.440(8) − 3.66(11) [Al/Si] (r = 0.79, 95%<br />
confidence) (Fig. 6). Samples scatter to<br />
each side <strong>of</strong> that line, having higher or<br />
lower Mg/Si (hereafter referred to as<br />
ΔMg/Si), respectively, at a given degree<br />
<strong>of</strong> depletion (Al/Si). The ΔMg/Si <strong>of</strong> <strong>craton</strong>ic<br />
xenoliths can be compared with<br />
<strong>of</strong>f-<strong>craton</strong> mantle to rigorously examine<br />
GSA TODAY, JUNE 2008 7<br />
1.3<br />
1.2<br />
Mg/Si wt<br />
1.1<br />
1<br />
0.9<br />
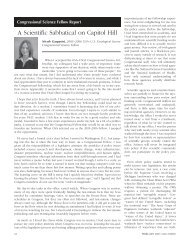
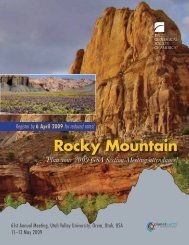
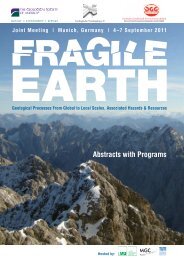
Figure 5. Covariation <strong>of</strong> Mg/Si with Mg/(Mg<br />
+ Fe)(Mg#) in whole rock analyses <strong>of</strong> <strong>craton</strong>ic<br />
peridotite xenoliths compiled by the author<br />
(Canil, 2004). The large polygon represents<br />
primitive <strong>up</strong>per mantle peridotite (McDonough<br />
and Sun, 1995). (A) Off-<strong>craton</strong> xenoliths and<br />
spinel- and garnet-facies xenoliths (sper, gper)<br />
from the Slave Province and Somerset Island.<br />
(B) Cratonic spinel-facies. (C) Cratonic garnetfacies<br />
xenoliths.<br />
peridotite at any pressure (Walter, 2003),<br />
but could be explained if they were residues<br />
<strong>of</strong> a more Si-rich and Fe-poor<br />
chondritic mantle, which has, since the<br />
Archean, escaped sampling during Proterozoic<br />
and younger melting processes<br />
(Francis, 2003). The trend to higher Si at<br />
a given Mg# could also be due to a secondary<br />
process (Herzberg, 2004; Kelemen<br />
et al., 1998).<br />
Al/Si wt<br />
0.14<br />
0.12<br />
0.1<br />
0.08<br />
0.06<br />
0.04<br />
0.02<br />
0<br />
0.14<br />
0.12<br />
0.1<br />
0.08<br />
0.06<br />
0.04<br />
0.02<br />
0<br />
0.14<br />
0.12<br />
0.1<br />
0.08<br />
0.06<br />
0.04<br />
0.02<br />
0<br />
1.6<br />
A<br />
B<br />
C<br />
1.4<br />
1.2<br />
Mg/Si(+) (-)<br />
1<br />
Mg/Si wt<br />
Canada<br />
Cratonic<br />
sp. facies<br />
Cratonic<br />
gt. facies<br />
0.8<br />
abyssal<br />
<strong>of</strong>f <strong>craton</strong> xeno<br />
Slave sper<br />
Slave gper<br />
Somerset sper<br />
Somerset gper<br />
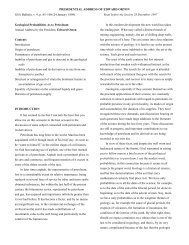
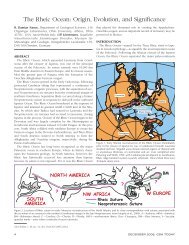
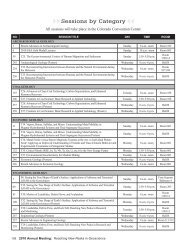
Figure 6. Covariation <strong>of</strong> Mg/Si with Al/Si in<br />
world xenolith data set as in Figure 5. (A) shows<br />
the trend for Canadian xenoliths compared with<br />
<strong>of</strong>f-<strong>craton</strong> and abyssal peridotites. The line for<br />
all <strong>of</strong>f-<strong>craton</strong> xenoliths is fitted by least squares<br />
to an equation <strong>of</strong> [Mg/Si] = 1.44(2) − 3.66(11)<br />
[Al/Si] (95% confidence, r = 0.79). Samples<br />
to the left or right <strong>of</strong> this line have a positive<br />
or negative “ΔMg/Si” value. The remaining<br />
panels show all (B) <strong>craton</strong>ic spinel-facies and (C)<br />
<strong>craton</strong>ic garnet facies mantle xenoliths.<br />
0.6