


Create successful ePaper yourself
Turn your PDF publications into a flip-book with our unique Google optimized e-Paper software.
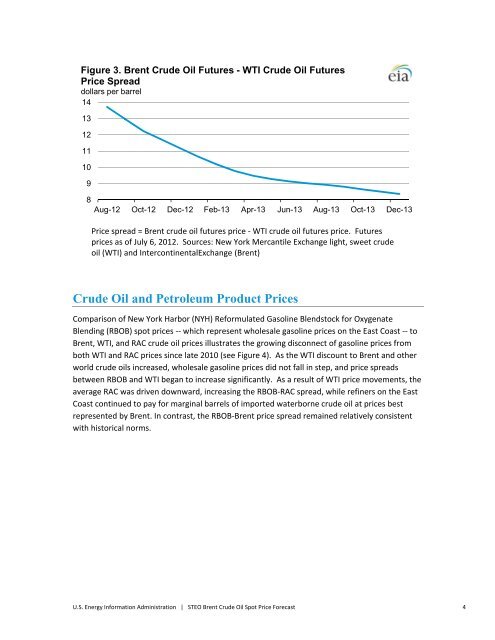
Figure 3. <strong>Brent</strong> <strong>Crude</strong> <strong>Oil</strong> Futures - WTI <strong>Crude</strong> <strong>Oil</strong> Futures<br />
<strong>Price</strong> Spread<br />
dollars per barrel<br />
14<br />
13<br />
12<br />
11<br />
10<br />
9<br />
8<br />
Aug-12 Oct-12 Dec-12 Feb-13 Apr-13 Jun-13 Aug-13 Oct-13 Dec-13<br />
<strong>Price</strong> spread = <strong>Brent</strong> crude oil futures price ‐ WTI crude oil futures price. Futures<br />
prices as of July 6, 2012. Sources: New York Mercantile Exchange light, sweet crude<br />
oil (WTI) and IntercontinentalExchange (<strong>Brent</strong>)<br />
<strong>Crude</strong> <strong>Oil</strong> and Petroleum Product <strong>Price</strong>s<br />
Comparison of New York Harbor (NYH) Reformulated Gasoline Blendstock for Oxygenate<br />
Blending (RBOB) spot prices ‐‐ which represent wholesale gasoline prices on the East Coast ‐‐ to<br />
<strong>Brent</strong>, WTI, and RAC crude oil prices illustrates the growing disconnect of gasoline prices from<br />
both WTI and RAC prices since late 2010 (see Figure 4). As the WTI discount to <strong>Brent</strong> and other<br />
world crude oils increased, wholesale gasoline prices did not fall in step, and price spreads<br />
between RBOB and WTI began to increase significantly. As a result of WTI price movements, the<br />
average RAC was driven downward, increasing the RBOB‐RAC spread, while refiners on the East<br />
Coast continued to pay for marginal barrels of imported waterborne crude oil at prices best<br />
represented by <strong>Brent</strong>. In contrast, the RBOB‐<strong>Brent</strong> price spread remained relatively consistent<br />
with historical norms.<br />
U.S. Energy Information Administration | STEO <strong>Brent</strong> <strong>Crude</strong> <strong>Oil</strong> <strong>Spot</strong> <strong>Price</strong> <strong>Forecast</strong> 4


