


You also want an ePaper? Increase the reach of your titles
YUMPU automatically turns print PDFs into web optimized ePapers that Google loves.
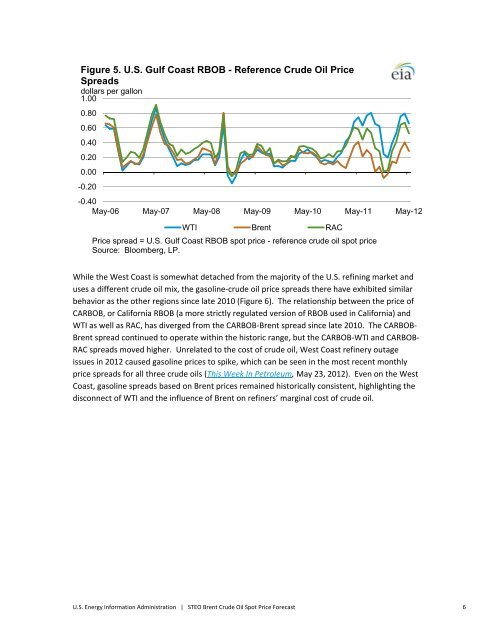
Figure 5. U.S. Gulf Coast RBOB - Reference <strong>Crude</strong> <strong>Oil</strong> <strong>Price</strong><br />
Spreads<br />
dollars per gallon<br />
1.00<br />
0.80<br />
0.60<br />
0.40<br />
0.20<br />
0.00<br />
-0.20<br />
-0.40<br />
May-06 May-07 May-08 May-09 May-10 May-11 May-12<br />
WTI <strong>Brent</strong> RAC<br />
<strong>Price</strong> spread = U.S. Gulf Coast RBOB spot price - reference crude oil spot price<br />
Source: Bloomberg, LP.<br />
While the West Coast is somewhat detached from the majority of the U.S. refining market and<br />
uses a different crude oil mix, the gasoline‐crude oil price spreads there have exhibited similar<br />
behavior as the other regions since late 2010 (Figure 6). The relationship between the price of<br />
CARBOB, or California RBOB (a more strictly regulated version of RBOB used in California) and<br />
WTI as well as RAC, has diverged from the CARBOB‐<strong>Brent</strong> spread since late 2010. The CARBOB‐<br />
<strong>Brent</strong> spread continued to operate within the historic range, but the CARBOB‐WTI and CARBOB‐<br />
RAC spreads moved higher. Unrelated to the cost of crude oil, West Coast refinery outage<br />
issues in 2012 caused gasoline prices to spike, which can be seen in the most recent monthly<br />
price spreads for all three crude oils (This Week In Petroleum, May 23, 2012). Even on the West<br />
Coast, gasoline spreads based on <strong>Brent</strong> prices remained historically consistent, highlighting the<br />
disconnect of WTI and the influence of <strong>Brent</strong> on refiners’ marginal cost of crude oil.<br />
U.S. Energy Information Administration | STEO <strong>Brent</strong> <strong>Crude</strong> <strong>Oil</strong> <strong>Spot</strong> <strong>Price</strong> <strong>Forecast</strong> 6


