forecast of ensemble power production by grid-connected
forecast of ensemble power production by grid-connected
forecast of ensemble power production by grid-connected

Create successful ePaper yourself
Turn your PDF publications into a flip-book with our unique Google optimized e-Paper software.
FORECAST OF ENSEMBLE POWER PRODUCTION BY GRID-CONNECTED PV SYSTEMS<br />
Elke Lorenz*, Detlev Heinemann*, Hashini Wickramarathne*, Hans Georg Beyer + , Stefan B<strong>of</strong>inger°<br />
* University <strong>of</strong> Oldenburg, Institute <strong>of</strong> Physics, Energy and Semiconductor Research Laboratory,<br />
Energy Meteorology Group, 26111 Oldenburg, Germany<br />
Email: elke.lorenz@uni-oldenburg.de, telephone: ++49 441 798 3545, fax: ++49 441 798 3326<br />
+ Hochschule Magdeburg-Stendal, FB Electrotechniques, Breitscheidstr.2 D-39114, Magdeburg, Germany<br />
° Meteocontrol GmbH, Spicherer Straße 48, D-86157 Augsburg, Germany<br />
ABSTRACT: The contribution <strong>of</strong> <strong>power</strong> <strong>production</strong> <strong>by</strong> PV systems to the electricity supply is constantly increasing. An<br />
efficient use <strong>of</strong> the fluctuating solar <strong>power</strong> <strong>production</strong> will highly benefit from <strong>forecast</strong> information on the expected <strong>power</strong><br />
<strong>production</strong>. This <strong>forecast</strong> information is necessary for the management <strong>of</strong> the electricity <strong>grid</strong>s and for solar energy trading.<br />
This paper will present and evaluate an approach to <strong>forecast</strong> regional PV <strong>power</strong> <strong>production</strong>.<br />
The <strong>forecast</strong> quality was investigated for single systems and for <strong>ensemble</strong>s <strong>of</strong> distributed PV systems. Due to spatial<br />
averaging effects the <strong>forecast</strong> for an <strong>ensemble</strong> <strong>of</strong> distributed systems shows higher quality than the <strong>forecast</strong> for single<br />
systems. Forecast errors are reduced to an RMSE <strong>of</strong> 0.05 Wh/Wp for an <strong>ensemble</strong> <strong>of</strong> the size <strong>of</strong> Germany compared to a<br />
RMSE <strong>of</strong> 0.13 Wh/Wp for single PV systems.<br />
Besides the <strong>forecast</strong> accuracy, also the specification <strong>of</strong> the <strong>forecast</strong> uncertainty is an important issue for an effective<br />
application. An approach to derive weather specific confidence intervals is presented that describe the maximum expected<br />
uncertainty <strong>of</strong> the <strong>forecast</strong>.<br />
Keywords: PV system, <strong>grid</strong>-<strong>connected</strong>, solar radiation, <strong>forecast</strong>ing<br />
1 INTRODUCTION<br />
Due to the strong increase <strong>of</strong> renewable energies the<br />
significance <strong>of</strong> the prediction <strong>of</strong> meteorological<br />
quantities such as wind velocity and solar irradiance is<br />
rising. Today, wind <strong>power</strong> prediction systems that<br />
improve the integration <strong>of</strong> wind energy into the<br />
electricity supply system are already available. Also the<br />
prediction <strong>of</strong> solar yields becomes more and more<br />
important for utilities with the increasing portion <strong>of</strong> solar<br />
energy sources. The Spanish feed-in law already includes<br />
incentives for correct prediction <strong>of</strong> solar yields for the<br />
next day.<br />
Forecast information on the expected <strong>power</strong> output is<br />
necessary for the management <strong>of</strong> electricity <strong>grid</strong>s and for<br />
solar energy trading.<br />
We present a <strong>forecast</strong>ing scheme to derive predictions <strong>of</strong><br />
PV <strong>power</strong> output based on irradiance <strong>forecast</strong>s up to 3<br />
days ahead provided <strong>by</strong> the European Center for Medium<br />
range Weather Forecasts (ECMWF). Additionally, the<br />
<strong>forecast</strong>ed values are provided with confidence intervals.<br />
The specification <strong>of</strong> the <strong>forecast</strong> accuracy is an important<br />
issue for an effective application.<br />
For the evaluation <strong>of</strong> the predicted PV system <strong>power</strong><br />
output a database <strong>of</strong> about 4500 operating PV systems in<br />
Germany is available. The <strong>forecast</strong> quality is investigated<br />
not only for single PV systems but also for <strong>ensemble</strong>s <strong>of</strong><br />
PV systems. The <strong>ensemble</strong> <strong>production</strong> <strong>of</strong> all PV systems<br />
contributing to a control area is <strong>of</strong> interest for the utility<br />
companies.<br />
This paper first presents the <strong>forecast</strong>ing scheme and the<br />
applied models. This is followed <strong>by</strong> a short introduction<br />
to the quality measures used for the evaluation <strong>of</strong> the<br />
<strong>forecast</strong>s. In the fist part <strong>of</strong> the evaluation we give<br />
information on the <strong>forecast</strong> quality for irradiance and PV<br />
<strong>power</strong> output at single sites. Following, we present and<br />
evaluate an approach to derive confidence intervals for<br />
the <strong>forecast</strong>s. Finally, we provide an evaluation <strong>of</strong> the<br />
<strong>forecast</strong> for <strong>ensemble</strong>s <strong>of</strong> PV systems.<br />
2 FORECASTING SCHEME<br />
2.1 Overview<br />
The prediction <strong>of</strong> the PV <strong>power</strong> <strong>production</strong> is based on<br />
irradiance <strong>forecast</strong>s up to 3 days ahead provided <strong>by</strong> the<br />
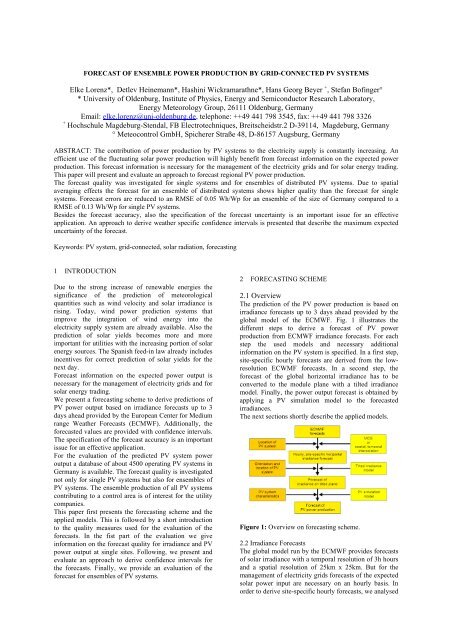
global model <strong>of</strong> the ECMWF. Fig. 1 illustrates the<br />
different steps to derive a <strong>forecast</strong> <strong>of</strong> PV <strong>power</strong><br />
<strong>production</strong> from ECMWF irradiance <strong>forecast</strong>s. For each<br />
step the used models and necessary additional<br />
information on the PV system is specified. In a first step,<br />
site-specific hourly <strong>forecast</strong>s are derived from the lowresolution<br />
ECWMF <strong>forecast</strong>s. In a second step, the<br />
<strong>forecast</strong> <strong>of</strong> the global horizontal irradiance has to be<br />
converted to the module plane with a tilted irradiance<br />
model. Finally, the <strong>power</strong> output <strong>forecast</strong> is obtained <strong>by</strong><br />
applying a PV simulation model to the <strong>forecast</strong>ed<br />
irradiances.<br />
The next sections shortly describe the applied models.<br />
Figure 1: Overview on <strong>forecast</strong>ing scheme.<br />
2.2 Irradiance Forecasts<br />
The global model run <strong>by</strong> the ECMWF provides <strong>forecast</strong>s<br />
<strong>of</strong> solar irradiance with a temporal resolution <strong>of</strong> 3h hours<br />
and a spatial resolution <strong>of</strong> 25km x 25km. But for the<br />
management <strong>of</strong> electricity <strong>grid</strong>s <strong>forecast</strong>s <strong>of</strong> the expected<br />
solar <strong>power</strong> input are necessary on an hourly basis. In<br />
order to derive site-specific hourly <strong>forecast</strong>s, we analysed
different spatial and temporal interpolation techniques to<br />
refine the ECMWF global model irradiance <strong>forecast</strong>s. An<br />
optimum adjustment <strong>of</strong> the temporal resolution was<br />
achieved <strong>by</strong> combination with a clear sky model to<br />
consider the typical diurnal course <strong>of</strong> irradiance [1]. As a<br />
second option, a Model Output Statistics (MOS) based<br />
<strong>forecast</strong>ing scheme for solar irradiance using ECMWF<br />
model output described <strong>by</strong> [2] is evaluated.<br />
2.3 Power Forecast<br />
The incoming irradiance is received on a tilted plane <strong>by</strong><br />
most PV systems. Hence, the <strong>forecast</strong>ed horizontal global<br />
irradiance has to be converted according to the<br />
orientation and declination <strong>of</strong> the modules for processing<br />
in the PV simulation model. Here, the anisotropic-all-sky<br />
model formulated <strong>by</strong> [3] is used.<br />
In order to derive the <strong>power</strong> output <strong>forecast</strong> a robust<br />
simulation model for MPP performance is applied to the<br />
<strong>forecast</strong>ed irradiance on the tilted plane, together with<br />
models <strong>of</strong> the efficiency characteristics <strong>of</strong> the inverter<br />
and the different system losses (see. [4]). The model<br />
returns the AC <strong>power</strong> fed to the <strong>grid</strong> as function <strong>of</strong> the<br />
incoming irradiance and the ambient temperature.<br />
Information on the ambient temperature is included as<br />
<strong>forecast</strong>ed values, for the <strong>forecast</strong>ing scheme using MOS.<br />
For the <strong>forecast</strong>s based on spatial and temporal<br />
interpolation to derive site-specific <strong>forecast</strong>s, measured<br />
temperature values from near<strong>by</strong> meteorological stations<br />
are integrated.<br />
3 QUALITY MEASURES<br />
For the evaluation <strong>of</strong> <strong>forecast</strong> quality two error<br />
measures were calculated. The mean values <strong>of</strong> the<br />
errors:<br />
1 N<br />
BIAS = ∑ ( x <strong>forecast</strong> i − x<br />
N i=<br />
1<br />
, measured,<br />
i<br />
and the root mean square error:<br />
1 N<br />
2<br />
RMSE = ( x − x ) ,<br />
∑ <strong>forecast</strong>,<br />
i measured,<br />
i<br />
N i=<br />
1<br />
with x=I for the evaluation <strong>of</strong> the prediction <strong>of</strong> the<br />
irradiance I, and x=P=Pac/Pnom for the <strong>power</strong> <strong>forecast</strong>.<br />
The normalisation <strong>of</strong> the ac <strong>power</strong> output Pac to the<br />
nominal <strong>power</strong> Pnom <strong>of</strong> the PV system allows for a better<br />
comparison <strong>of</strong> different PV systems.<br />
The error measures are calculated for hourly values. Only<br />
day values (xmeasured,i > 0) are considered for the<br />
calculation <strong>of</strong> BIAS and RMSE.<br />
Also relative values <strong>of</strong> the error measures (rRMSE,<br />
rBIAS) will be given in the following sections.<br />
Normalization is done with respect to mean ground<br />
measured irradiance or PV <strong>power</strong> <strong>production</strong> <strong>of</strong> the<br />
considered period.<br />
For comparison <strong>forecast</strong>s based on the assumption <strong>of</strong><br />
persistence are evaluated. The irradiance values <strong>of</strong> the<br />
current day are taken as <strong>forecast</strong> values for the next days<br />
at the same time. This very simple approach <strong>of</strong><br />
<strong>forecast</strong>ing is <strong>of</strong>ten used as a reference.<br />
4 ACCURACY OF IRRADIANCE FORECASTS<br />
A comparison <strong>of</strong> the two proposed approaches for<br />
<strong>forecast</strong>ing was performed <strong>by</strong> [1] using ground measured<br />
)<br />
,<br />
irradiance data <strong>of</strong> 18 stations <strong>of</strong> the German weather<br />
service (DWD) <strong>of</strong> the years 2003 and 2004. Both<br />
approaches show a similar <strong>forecast</strong> quality with a rRMSE<br />
<strong>of</strong> 35%-40% for the first <strong>forecast</strong> day, and perform much<br />
better than persistence with a rRMSE <strong>of</strong> about 60%. For<br />
the second and third <strong>forecast</strong> day errors are only slightly<br />
increasing to an rRMSE <strong>of</strong> 40% to 45% for the third<br />
<strong>forecast</strong> day.<br />
For clear sky days the <strong>forecast</strong> quality is much better.<br />
Best results are achieved with the interpolation technique<br />
combined with a clear sky model, the rRMSE ranges<br />
from 15% for the first <strong>forecast</strong> day to 20% for the third<br />
<strong>forecast</strong> day. The respective errors for the MOS system<br />
are about 5%-10% higher.<br />
5 ACCURACY OF POWER FORECAST FOR SINGLE<br />
PV SYSTEMS<br />
For the evaluation <strong>of</strong> the <strong>forecast</strong> <strong>of</strong> the <strong>power</strong> output a<br />
database <strong>of</strong> about 4500 operating PV systems in<br />
Germany is available. The <strong>forecast</strong> for these systems was<br />
processed using the MOS irradiance <strong>forecast</strong>s. For a<br />
detailed analysis <strong>of</strong> the <strong>forecast</strong>s based on the<br />
interpolation technique an <strong>ensemble</strong> <strong>of</strong> 11 PV Systems<br />
distributed over an area <strong>of</strong> 200km x 120km in Southern<br />
Germany was evaluated for April and July 2006 <strong>by</strong> [5].<br />
These two months with different meteorological<br />
conditions were chosen in order to investigate the<br />
influence <strong>of</strong> weather conditions on the <strong>forecast</strong> accuracy.<br />
A validation <strong>of</strong> the <strong>forecast</strong> quality for predictions up to<br />
24 hours for the year 2005 using the database <strong>of</strong> 4500<br />
systems resulted in a RMSE von 0,13 Wh/Wp and a<br />
BIAS <strong>of</strong> 0,006 Wh/Wp. Fig. 2 shows the accuracy <strong>of</strong> the<br />
<strong>forecast</strong> over the year in comparison to persistence. The<br />
figure illustrates the considerable improvement compared<br />
to persistence.<br />
Figure 2: RMSE <strong>of</strong> hourly PV <strong>power</strong> <strong>production</strong> in<br />
Wh/Wp , red: <strong>forecast</strong>, blue: persistence. The mean value<br />
<strong>of</strong> all systems is denoted as solid line.<br />
To illustrate the <strong>forecast</strong> accuracy, time series <strong>of</strong><br />
predicted <strong>power</strong> output in comparison to measured <strong>power</strong><br />
output are given for 7 days in April 2006 in Fig. 3, and<br />
for 7 days in July 2006 in Fig. 4 for a system <strong>of</strong> the<br />
<strong>ensemble</strong> in Southern Germany. In Fig. 4 also confidence
intervals are displayed that will be further discussed in<br />
the next section.<br />
The figures shows that there is a good agreement<br />
between <strong>forecast</strong> and measurement for clear sky days<br />
with only minor underestimation <strong>of</strong> the actual <strong>power</strong><br />
output. For cloudy days significant deviations between<br />
<strong>forecast</strong> and measurement may occur. For overcast<br />
situations a considerable overestimation <strong>of</strong> the <strong>power</strong><br />
output can be observed (see Fig.3, 17 th April).<br />
Furthermore, the strong variation <strong>of</strong> the <strong>power</strong><br />
<strong>production</strong> for days with variable clouds is not correctly<br />
modelled <strong>by</strong> the <strong>forecast</strong>.<br />
Figure 3: Predicted <strong>power</strong> output compared to<br />
measured <strong>power</strong> output for seven days in Aril 2006 for a<br />
PV system in Southern Germany.<br />
A quantitative evaluation <strong>of</strong> the <strong>power</strong> <strong>forecast</strong> for the<br />
small <strong>ensemble</strong> <strong>of</strong> 11 PV systems resulted in a rRSME <strong>of</strong><br />
49% (absolute RMSE=0.12Wh/Wp) for April where<br />
cloudy situations were predominant. For July with<br />
mostly clear sky days for this region a lower rRMSE <strong>of</strong><br />
30% (absolute RMSE=0.10 Wh/Wp) is found.<br />
This analysis was complemented with the evaluation <strong>of</strong><br />
predictions <strong>of</strong> irradiance on the tilted plane at the PV<br />
system sites, and an analysis <strong>of</strong> global horizontal<br />
irradiance <strong>forecast</strong>s for meteorological stations located in<br />
the same region. The errors <strong>of</strong> the PV <strong>power</strong> <strong>forecast</strong> are<br />
very closely related to the errors <strong>of</strong> the tilted irradiance<br />
<strong>forecast</strong>, and the RMSE values are similar. This holds<br />
only if the PV system parameters used for the simulation<br />
have a good quality, which was the case for the evaluated<br />
systems.<br />
The quality <strong>of</strong> the global horizontal irradiance <strong>forecast</strong><br />
with a rRMSE <strong>of</strong> 44% for April and a rRMSE <strong>of</strong> 28% for<br />
July is slightly better than the quality <strong>of</strong> the tilted<br />
irradiance and PV <strong>power</strong> <strong>forecast</strong>. Forecast errors are<br />
amplified <strong>by</strong> conversion <strong>of</strong> the irradiance on the tilted<br />
plane. But, given correct parameters to characterize the<br />
PV systems, the accuracy <strong>of</strong> the global horizontal<br />
irradiance <strong>forecast</strong> is still the determining factor for the<br />
quality <strong>of</strong> the <strong>power</strong> <strong>forecast</strong>.<br />
6 CONFIDENCE INTERVALS<br />
The specification <strong>of</strong> the <strong>forecast</strong> accuracy is an important<br />
issue for an effective application <strong>of</strong> the <strong>forecast</strong>s.<br />
Therefore, confidence intervals are provided that indicate<br />
the range in which the actual value is expected to appear<br />
with a quantified probability (see illustration in Fig. 4).<br />
To derive the limits <strong>of</strong> the confidence intervals, a model<br />
for the distribution <strong>of</strong> the scatter <strong>of</strong> the actual value<br />
around the <strong>forecast</strong> is needed. As the range <strong>of</strong> possible<br />
values is limited <strong>by</strong> zero and the <strong>power</strong> output at clear<br />
sky conditions, a natural choice for a respective<br />
distribution model is the beta distribution, already<br />
applied in the context <strong>of</strong> wind <strong>power</strong> <strong>forecast</strong>s [6]. This<br />
model is applied to the small <strong>ensemble</strong> <strong>of</strong> 11 Southern<br />
German PV systems.<br />
Figure 4: Predicted <strong>power</strong> output with confidence<br />
intervals compared to measured <strong>power</strong> output for seven<br />
days in July 2006 for a PV system in Southern Germany.<br />
Basis for the determination <strong>of</strong> the confidence intervals is<br />
the knowledge <strong>of</strong> the situation-specific RMSE <strong>of</strong> the<br />
<strong>forecast</strong>. Together with the <strong>forecast</strong>ed value itself it may<br />
define the beta distribution for the expected actual<br />
values.<br />
These specific RMSE values are determined with<br />
dependence on sun elevation and cloud situation<br />
(homogeneous or scatter) using BIAS-corrected <strong>forecast</strong><br />
values.<br />
For this analysis only a limited number <strong>of</strong> measurements<br />
was available. Therefore, only three different classes <strong>of</strong><br />
cloud situations are distinguished: clear sky, overcast,<br />
and broken clouds. The characterization <strong>of</strong> the classes<br />
was based on the mean clear sky index and the standard<br />
deviation <strong>of</strong> the clear sky index <strong>of</strong> the <strong>forecast</strong> field <strong>of</strong> all<br />
11 PV systems. The clear sky index k* is a measure <strong>of</strong><br />
cloudiness, defined as the ratio <strong>of</strong> global irradiance to<br />
clear sky irradiance.<br />
Given the beta distribution, the limits <strong>of</strong> the confidence<br />
interval can be directly calculated. Here, we choose a<br />
confidence level <strong>of</strong> 90%. Fig. 5 shows an example for the<br />
derived confidence intervals for April and sun elevations<br />
between 40 o and 50 o for the three different classes <strong>of</strong><br />
cloud situations. The figure illustrates that the confidence<br />
intervals provide a reasonable estimate for the expected<br />
maximum deviation <strong>of</strong> the measured from the predicted<br />
values. However, a considerable number <strong>of</strong> values also is<br />
found outside the confidence intervals. A quantitative<br />
evaluation revealed, that only about 80%- 85% <strong>of</strong> the<br />
measured values are found within the confidence<br />
intervals for each class instead <strong>of</strong> the expected 90%.<br />
Reasons for this insufficiency may be found in the fact,<br />
that the choice <strong>of</strong> only two parameters (mean value and<br />
spatial standard deviation the clear sky index k*) to<br />
derive the RMSE data is insufficient, especially taking<br />
into account that the systems analyzed show different
orientations and thus different responses to the cloud<br />
situation. Further analysis has to deal either with system<br />
specific RMSE values or the analysis <strong>of</strong> <strong>ensemble</strong> values<br />
and judge about the applicability <strong>of</strong> the distribution<br />
model on that bases.<br />
Figure 5: Measured <strong>power</strong> output over predicted <strong>power</strong><br />
output with confidence intervals for 11 PV systems in<br />
Southern Germany. The predicted values are BIAS-<br />
corrected for each class separately.<br />
Fig. 5 also illustrates that the different <strong>forecast</strong> quality<br />
for different meteorological situations is modeled well <strong>by</strong><br />
the proposed approach. For clear sky situations the<br />
confidence intervals are chosen very narrow, the <strong>forecast</strong><br />
is very reliable. On days with variable clouds large<br />
deviations are to be expected for <strong>forecast</strong>s with an hourly<br />
resolution for single PV sites.<br />
7 QUALITY OF FORECAST FOR ENSEMBLES OF<br />
PV SYSTEMS<br />
For the management <strong>of</strong> electricity <strong>grid</strong>s and solar energy<br />
trading the <strong>ensemble</strong> <strong>production</strong> <strong>of</strong> all PV systems<br />
contributing to a control area is relevant.<br />
7.1 Reduction <strong>of</strong> <strong>forecast</strong> errors for <strong>ensemble</strong>s <strong>of</strong> PV<br />
systems<br />
Due to spatial averaging effects the <strong>forecast</strong> for an<br />
<strong>ensemble</strong> <strong>of</strong> distributed systems shows higher accuracy<br />
than the <strong>forecast</strong> for single systems. Fig. 6 shows a time<br />
series <strong>of</strong> the <strong>power</strong> <strong>production</strong> <strong>of</strong> the small <strong>ensemble</strong> <strong>of</strong><br />
11 PV systems for seven days in July and the respective<br />
<strong>forecast</strong>s. Spatial averaging effects cause a smoother<br />
course <strong>of</strong> the curve <strong>of</strong> <strong>power</strong> <strong>production</strong> than for single<br />
systems (see Fig. 4) and the deviations between <strong>forecast</strong><br />
and measurement are smaller.<br />
For the <strong>ensemble</strong> <strong>of</strong> 11 PV systems <strong>forecast</strong> errors are<br />
reduced to a rRMSE <strong>of</strong> 39% (absolute<br />
RMSE=0.09Wh/Wp) for April and to a rRMSE <strong>of</strong> 22%<br />
(absolute RMSE=0.06) for July when considering the<br />
<strong>power</strong> <strong>production</strong> <strong>of</strong> the complete <strong>ensemble</strong>. This<br />
corresponds to an error reduction factor<br />
r=RMSE <strong>ensemble</strong>/RMSE single <strong>of</strong> about 0.7.<br />
For the large <strong>ensemble</strong> <strong>of</strong> about 4500 PV systems the<br />
evaluation <strong>of</strong> the <strong>ensemble</strong> <strong>power</strong> <strong>production</strong> <strong>forecast</strong><br />
resulted in a RMSE <strong>of</strong> 0.052Wh/Wp, which corresponds<br />
to an error reduction factor <strong>of</strong> 0.4 for the complete year<br />
and the region <strong>of</strong> Germany.<br />
Figure 6: Predicted <strong>power</strong> output compared to measured<br />
<strong>power</strong> output for seven days in July 2006 for an<br />
<strong>ensemble</strong> <strong>of</strong> PV systems in Southern Germany.<br />
7.2 Correlation <strong>of</strong> <strong>forecast</strong> errors<br />
The reduction <strong>of</strong> errors when considering an <strong>ensemble</strong> <strong>of</strong><br />
PV systems instead <strong>of</strong> a single system is determined <strong>by</strong><br />
the correlation <strong>of</strong> <strong>forecast</strong> errors <strong>of</strong> the systems that are<br />
part <strong>of</strong> the <strong>ensemble</strong>.<br />
Figure 7: Correlation coefficient <strong>of</strong> <strong>forecast</strong> errors <strong>of</strong><br />
two systems over the distance between the systems. The<br />
blue dots represent measured values; the red dots give the<br />
model curve.<br />
The correlation coefficient <strong>of</strong> the <strong>forecast</strong> errors <strong>of</strong> two<br />
systems depends <strong>of</strong> the distance between the systems, as<br />
illustrated in Fig. 7. Here the correlation coefficient<br />
between two systems is displayed over the distance<br />
between the systems for the large German <strong>ensemble</strong>. The<br />
dependence <strong>of</strong> the correlation <strong>of</strong> the <strong>forecast</strong> errors on<br />
the distance <strong>of</strong> two systems can be modelled with an<br />
exponential function. The red line in Fig. 7 shows the<br />
model curve.<br />
This model in combination with a statistical approach to<br />
derive the expected errors <strong>of</strong> mean values allows for the<br />
estimation <strong>of</strong> <strong>forecast</strong>s errors for arbitrary scenarios <strong>of</strong><br />
<strong>ensemble</strong>s <strong>of</strong> PV systems.<br />
7.3 Evaluation <strong>of</strong> irradiance <strong>forecast</strong>s for distributed<br />
systems depending on the number <strong>of</strong> systems and the size<br />
<strong>of</strong> the region<br />
A detailed analysis on the reduction <strong>of</strong> <strong>forecast</strong> errors,<br />
when considering <strong>ensemble</strong>s <strong>of</strong> distributed systems, was<br />
performed <strong>by</strong> [5] using measured irradiance data <strong>of</strong> about
100 meteorological stations in Germany. As the accuracy<br />
<strong>of</strong> the PV <strong>power</strong> <strong>production</strong> <strong>forecast</strong> is mainly<br />
determined <strong>by</strong> the accuracy <strong>of</strong> the irradiance <strong>forecast</strong>s,<br />
the result <strong>of</strong> this investigation also gives information<br />
about the quality <strong>of</strong> PV <strong>power</strong> <strong>forecast</strong>s for <strong>ensemble</strong>s <strong>of</strong><br />
distributed systems.<br />
[5] investigated the dependency <strong>of</strong> the <strong>forecast</strong> quality on<br />
the number <strong>of</strong> systems and the size <strong>of</strong> the region, where<br />
the systems are distributed. The distribution <strong>of</strong> the<br />
meteorological stations and the position and size <strong>of</strong><br />
investigated regions is shown in Fig. 8. The evaluation<br />
was performed for the month April and July 2006. For<br />
April, where cloudy situations were predominant, a<br />
RMSE <strong>of</strong> 160 W/m 2 is found for single stations, when<br />
evaluating the complete <strong>ensemble</strong>. In July 2006 with<br />
mainly sunny days a considerable smaller RMSE <strong>of</strong> 110<br />
W/ m 2 is obtained.<br />
Figure 8: Distribution <strong>of</strong> the meteorological stations and<br />
position and size <strong>of</strong> the regions used for the evaluation.<br />
As described in the previous sections, for mean<br />
irradiance values for an <strong>ensemble</strong> <strong>of</strong> stations the<br />
accuracy is increasing. Fig. 9 shows the rRMSE <strong>of</strong> the<br />
<strong>forecast</strong> <strong>of</strong> the mean irradiance <strong>of</strong> the <strong>ensemble</strong> over the<br />
number <strong>of</strong> considered stations for region 6 (Germany).<br />
The subsets <strong>of</strong> stations were chosen manually to cover<br />
the complete region with a mostly uniform distribution.<br />
Already for a small number <strong>of</strong> sites a large reduction <strong>of</strong><br />
the <strong>forecast</strong> errors is achieved. With increasing number<br />
<strong>of</strong> sites and decreasing distance between the stations the<br />
correlation between the <strong>forecast</strong> errors is increasing (see<br />
Fig. 7). Consequently, the additional reduction <strong>of</strong><br />
<strong>forecast</strong> errors when adding further sites to the <strong>ensemble</strong><br />
is decreasing.<br />
In Fig. 10 the reduction factor RMSE <strong>ensemble</strong>/RMME single<br />
is displayed over the size <strong>of</strong> the region. Form each region<br />
20 uniformly distributed stations were chosen to<br />
calculate the reduction factor. For small regions <strong>of</strong> about<br />
200km x 200km a reduction factor <strong>of</strong> about 0.6- 0.7 is<br />
found, for a region <strong>of</strong> the size <strong>of</strong> Germany a reduction<br />
factor <strong>of</strong> about 0.4-0.5 is obtained. This in accordance<br />
with the results for the <strong>power</strong> <strong>forecast</strong>.<br />
Figure 9: rRMSE <strong>of</strong> the <strong>forecast</strong> <strong>of</strong> the mean irradiance<br />
<strong>of</strong> an <strong>ensemble</strong> <strong>of</strong> stations in dependence on the number<br />
<strong>of</strong> stations.<br />
Figure 10: Error reduction factor<br />
RMSE <strong>ensemble</strong>/RMAE single for regions with increasing size<br />
(see Fig. 8).<br />
8 RESULTS AND CONCLUSIONS<br />
An approach to <strong>forecast</strong> regional PV <strong>power</strong> <strong>production</strong><br />
was presented based on refined ECMWF irradiance<br />
<strong>forecast</strong>s in combination with a PV simulation model.<br />
The evaluation for hourly irradiance <strong>forecast</strong>s for single<br />
sites resulted in an overall rRMSE <strong>of</strong> about 35%-40%.<br />
This leads to a RMSE <strong>of</strong> about 0,13 Wh/Wp for the<br />
<strong>power</strong> <strong>forecast</strong> for single systems. The <strong>forecast</strong> quality<br />
depends on the meteorological situation: Situations with<br />
inhomogeneous clouds generally are difficult to <strong>forecast</strong><br />
and show a lower accuracy than <strong>forecast</strong>s for clear sky<br />
days.<br />
The specification <strong>of</strong> the <strong>forecast</strong> accuracy is an important<br />
issue for an effective application. An approach to derive<br />
weather specific confidence intervals was proposed and<br />
evaluated. The derived confidence intervals provide a<br />
reasonable estimate for the expected maximum deviation
<strong>of</strong> the measured from the predicted values for different<br />
meteorological situations.<br />
Due to spatial averaging effects the <strong>forecast</strong> for an<br />
<strong>ensemble</strong> <strong>of</strong> distributed systems shows higher quality<br />
than the <strong>forecast</strong> for single systems. The increase <strong>of</strong> the<br />
<strong>forecast</strong> quality essentially depends on the size <strong>of</strong> the<br />
region, where the PV systems are distributed. For a<br />
region <strong>of</strong> the size <strong>of</strong> Germany the <strong>forecast</strong> errors are<br />
reduced <strong>by</strong> a factor <strong>of</strong> about 0.4-0.5. This corresponds to<br />
an absolute RMSE <strong>of</strong> 0.05 Wh/Wp.<br />
The proposed approach to <strong>forecast</strong> <strong>power</strong> <strong>production</strong> <strong>of</strong><br />
PV systems including confidence intervals can contribute<br />
to a successful integration <strong>of</strong> this fluctuating energy<br />
source to the electricity <strong>grid</strong>.<br />
8 REFERENCES<br />
[1] Girodo M. (2006): Solarstrahlungsvorhersage auf der<br />
Basis numerischer Wettermodelle, PhD thesis, Oldenburg<br />
University 2006.<br />
[2] B<strong>of</strong>inger S., Heilscher G. (2006): Solar electricity<br />
<strong>forecast</strong>- approaches and first results, 21 th PV<br />
conference, 4 th -8 th September 2006, Dresden.<br />
[3] Klucher, T.M. (1979): Evaluation <strong>of</strong> models to<br />
predict insolation on tilted surfaces. Solar Energy 23,<br />
111-114.<br />
[4] Drews A., H.G. Beyer, U. Rindelhardt (2007) Quality<br />
<strong>of</strong> performance assessment <strong>of</strong> PV plants based on<br />
irradiance maps, submitted to Solar Energy, 4.2007<br />
[5] Wickramarathne H. (2007): Evaluation <strong>of</strong> Forecast <strong>of</strong><br />
Power Production with Distributed PV-Systems, Master<br />
Thesis, Postgraduate Programme Renewable Energy,<br />
Oldenburg University.<br />
[6] Luig A., B<strong>of</strong>inger S., Beyer H.G. (2001): Analysis <strong>of</strong><br />
confidence intervals for the prediction <strong>of</strong> the regional<br />
wind <strong>power</strong> output, 2001 European Wind Energy<br />
Conference, Copenhagen, 2-6. 7.