Anemia and iron, zinc, copper and magnesium deficiency in ...
Anemia and iron, zinc, copper and magnesium deficiency in ...
Anemia and iron, zinc, copper and magnesium deficiency in ...

Create successful ePaper yourself
Turn your PDF publications into a flip-book with our unique Google optimized e-Paper software.
Ar t í c u l o orig<strong>in</strong>Al<br />
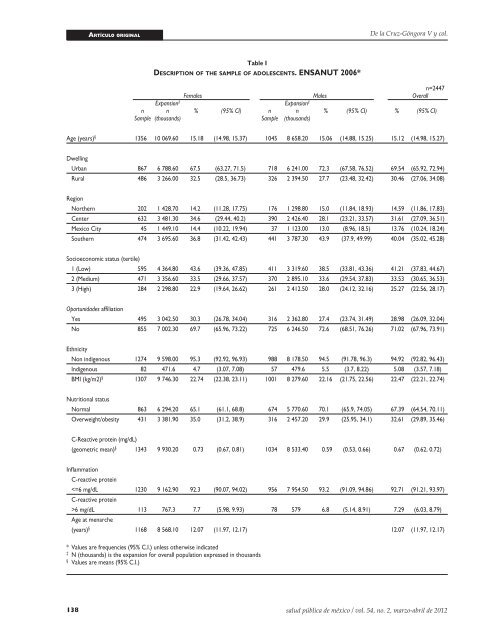
Table I<br />
Description o f t h e s a m p l e o f a D o l e s c e n t s. ensanUt 2006*<br />
De la Cruz-Góngora V y col.<br />
n=2447<br />
Females Males Overall<br />
Expansion ‡ Expansion ‡<br />
n n % (95% CI) n n % (95% CI) % (95% CI)<br />
Sample (thous<strong>and</strong>s) Sample (thous<strong>and</strong>s)<br />
Age (years) § 1356 10 069.60 15.18 (14.98, 15.37) 1045 8 658.20 15.06 (14.88, 15.25) 15.12 (14.98, 15.27)<br />
Dwell<strong>in</strong>g<br />
Urban 867 6 788.60 67.5 (63.27, 71.5) 718 6 241.00 72.3 (67.58, 76.52) 69.54 (65.92, 72.94)<br />
Rural 486 3 266.00 32.5 (28.5, 36.73) 326 2 394.50 27.7 (23.48, 32.42) 30.46 (27.06, 34.08)<br />
Region<br />
Northern 202 1 428.70 14.2 (11.28, 17.75) 176 1 298.80 15.0 (11.84, 18.93) 14.59 (11.86, 17.83)<br />
Center 632 3 481.30 34.6 (29.44, 40.2) 390 2 426.40 28.1 (23.21, 33.57) 31.61 (27.09, 36.51)<br />
Mexico City 45 1 449.10 14.4 (10.22, 19.94) 37 1 123.00 13.0 (8.96, 18.5) 13.76 (10.24, 18.24)<br />
Southern 474 3 695.60 36.8 (31.42, 42.43) 441 3 787.30 43.9 (37.9, 49.99) 40.04 (35.02, 45.28)<br />
Socioeconomic status (tertile)<br />
1 (Low) 595 4 364.80 43.6 (39.36, 47.85) 411 3 319.60 38.5 (33.81, 43.36) 41.21 (37.83, 44.67)<br />
2 (Medium) 471 3 356.60 33.5 (29.66, 37.57) 370 2 895.10 33.6 (29.54, 37.83) 33.53 (30.65, 36.53)<br />
3 (High) 284 2 298.80 22.9 (19.64, 26.62) 261 2 412.50 28.0 (24.12, 32.16) 25.27 (22.56, 28.17)<br />
Oportunidades affiliation<br />
Yes 495 3 042.50 30.3 (26.78, 34.04) 316 2 362.80 27.4 (23.74, 31.49) 28.98 (26.09, 32.04)<br />
No 855 7 002.30 69.7 (65.96, 73.22) 725 6 246.50 72.6 (68.51, 76.26) 71.02 (67.96, 73.91)<br />
Ethnicity<br />
Non <strong>in</strong>digenous 1274 9 598.00 95.3 (92.92, 96.93) 988 8 178.50 94.5 (91.78, 96.3) 94.92 (92.82, 96.43)<br />
Indigenous 82 471.6 4.7 (3.07, 7.08) 57 479.6 5.5 (3.7, 8.22) 5.08 (3.57, 7.18)<br />
BMI (kg/m2) § 1307 9 746.30 22.74 (22.38, 23.11) 1001 8 279.60 22.16 (21.75, 22.56) 22.47 (22.21, 22.74)<br />
Nutritional status<br />
Normal 863 6 294.20 65.1 (61.1, 68.8) 674 5 770.60 70.1 (65.9, 74.05) 67.39 (64.54, 70.11)<br />
Overweight/obesity 431 3 381.90 35.0 (31.2, 38.9) 316 2 457.20 29.9 (25.95, 34.1) 32.61 (29.89, 35.46)<br />
C-Reactive prote<strong>in</strong> (mg/dL)<br />
(geometric mean) § 1343 9 930.20 0.73 (0.67, 0.81) 1034 8 533.40 0.59 (0.53, 0.66) 0.67 (0.62, 0.72)<br />
Inflammation<br />
C-reactive prote<strong>in</strong><br />
6 mg/dL<br />
Age at menarche<br />
113 767.3 7.7 (5.98, 9.93) 78 579 6.8 (5.14, 8.91) 7.29 (6.03, 8.79)<br />
(years) § 1168 8 568.10 12.07 (11.97, 12.17) 12.07 (11.97, 12.17)<br />
* Values are frequencies (95% C.I.) unless otherwise <strong>in</strong>dicated<br />
‡ N (thous<strong>and</strong>s) is the expansion for overall population expressed <strong>in</strong> thous<strong>and</strong>s<br />
§ Values are means (95% C.I.)<br />
138 salud pública de méxico / vol. 54, no. 2, marzo-abril de 2012