Anemia and iron, zinc, copper and magnesium deficiency in ...
Anemia and iron, zinc, copper and magnesium deficiency in ...
Anemia and iron, zinc, copper and magnesium deficiency in ...

You also want an ePaper? Increase the reach of your titles
YUMPU automatically turns print PDFs into web optimized ePapers that Google loves.
M<strong>in</strong>eral <strong>deficiency</strong> <strong>in</strong> Mexican adolescents Ar t í c u l o orig<strong>in</strong>Al<br />
salud pública de méxico / vol. 54, no. 2, marzo-abril de 2012<br />
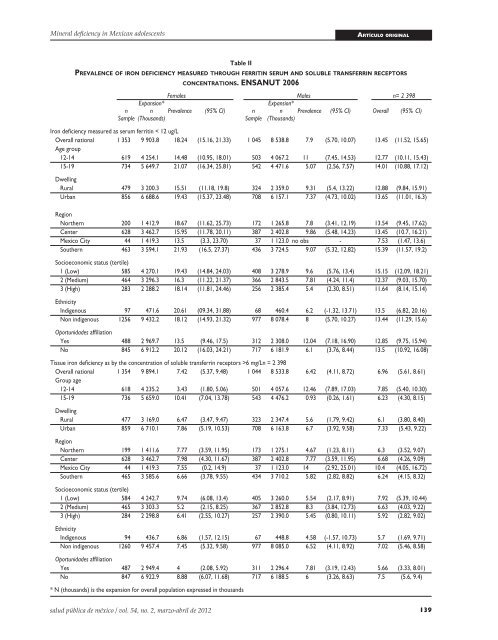
Table II<br />
pr e v a l e n c e o f i r o n D e f i c i e n c y m e a s U r e D t h r o U g h f e r r i t i n s e r U m a n D s o l U b l e t r a n s f e r r i n r e c e p t o r s<br />
c o n c e n t r a t i o n s. ensanUt 2006<br />
Females Males n= 2 398<br />
Expansion* Expansion*<br />
n n Prevalence (95% CI) n n Prevalence (95% CI) Overall (95% CI)<br />
Sample (Thous<strong>and</strong>s) Sample (Thous<strong>and</strong>s)<br />
Iron <strong>deficiency</strong> measured as serum ferrit<strong>in</strong> < 12 ug/L<br />
Overall national 1 353 9 903.8 18.24 (15.16, 21.33) 1 045 8 538.8 7.9 (5.70, 10.07) 13.45 (11.52, 15.65)<br />
Age group<br />
12-14 619 4 254.1 14.48 (10.95, 18.01) 503 4 067.2 11 (7.45, 14.53) 12.77 (10.11, 15.43)<br />
15-19 734 5 649.7 21.07 (16.34, 25.81) 542 4 471.6 5.07 (2.56, 7.57) 14.01 (10.88, 17.12)<br />
Dwell<strong>in</strong>g<br />
Rural 479 3 200.3 15.51 (11.18, 19.8) 324 2 359.0 9.31 (5.4, 13.22) 12.88 (9.84, 15.91)<br />
Urban 856 6 688.6 19.43 (15.37, 23.48) 708 6 157.1 7.37 (4.73, 10.02) 13.65 (11.01, 16.3)<br />
Region<br />
Northern 200 1 412.9 18.67 (11.62, 25.73) 172 1 265.8 7.8 (3.41, 12.19) 13.54 (9.45, 17.62)<br />
Center 628 3 462.7 15.95 (11.78, 20.11) 387 2 402.8 9.86 (5.48, 14.23) 13.45 (10.7, 16.21)<br />
Mexico City 44 1 419.3 13.5 (3.3, 23.70) 37 1 123.0 no obs - 7.53 (1.47, 13.6)<br />
Southern 463 3 594.1 21.93 (16.5, 27.37) 436 3 724.5 9.07 (5.32, 12.82) 15.39 (11.57, 19.2)<br />
Socioeconomic status (tertile)<br />
1 (Low) 585 4 270.1 19.43 (14.84, 24.03) 408 3 278.9 9.6 (5.76, 13.4) 15.15 (12.09, 18.21)<br />
2 (Medium) 464 3 296.3 16.3 (11.22, 21.37) 366 2 843.5 7.81 (4.24, 11.4) 12.37 (9.03, 15.70)<br />
3 (High) 283 2 288.2 18.14 (11.81, 24.46) 256 2 385.4 5.4 (2.30, 8.51) 11.64 (8.14, 15.14)<br />
Ethnicity<br />
Indigenous 97 471.6 20.61 (09.34, 31.88) 68 460.4 6.2 (-1.32, 13.71) 13.5 (6.82, 20.16)<br />
Non <strong>in</strong>digenous 1256 9 432.2 18.12 (14.93, 21.32) 977 8 078.4 8 (5.70, 10.27) 13.44 (11.29, 15.6)<br />
Oportunidades affiliation<br />
Yes 488 2 969.7 13.5 (9.46, 17.5) 312 2 308.0 12.04 (7.18, 16.90) 12.85 (9.75, 15.94)<br />
No 845 6 912.2 20.12 (16.03, 24.21) 717 6 181.9 6.1 (3.76, 8.44) 13.5 (10.92, 16.08)<br />
Tissue <strong>iron</strong> <strong>deficiency</strong> as by the concentration of soluble transferr<strong>in</strong> receptors >6 mg/L n = 2 398<br />
Overall national 1 354 9 894.1 7.42 (5.37, 9.48) 1 044 8 533.8 6.42 (4.11, 8.72) 6.96 (5.61, 8.61)<br />
Group age<br />
12-14 618 4 235.2 3.43 (1.80, 5.06) 501 4 057.6 12.46 (7.89, 17.03) 7.85 (5.40, 10.30)<br />
15-19 736 5 659.0 10.41 (7.04, 13.78) 543 4 476.2 0.93 (0.26, 1.61) 6.23 (4.30, 8.15)<br />
Dwell<strong>in</strong>g<br />
Rural 477 3 169.0 6.47 (3.47, 9.47) 323 2 347.4 5.6 (1.79, 9.42) 6.1 (3.80, 8.40)<br />
Urban 859 6 710.1 7.86 (5.19, 10.53) 708 6 163.8 6.7 (3.92, 9.58) 7.33 (5.43, 9.22)<br />
Region<br />
Northern 199 1 411.6 7.77 (3.59, 11.95) 173 1 275.1 4.67 (1.23, 8.11) 6.3 (3.52, 9.07)<br />
Center 628 3 462.7 7.98 (4.30, 11.67) 387 2 402.8 7.77 (3.59, 11.95) 6.68 (4.26, 9.09)<br />
Mexico City 44 1 419.3 7.55 (0.2, 14.9) 37 1 123.0 14 (2.92, 25.01) 10.4 (4.05, 16.72)<br />
Southern 465 3 585.6 6.66 (3.78, 9.55) 434 3 710.2 5.82 (2.82, 8.82) 6.24 (4.15, 8.32)<br />
Socioeconomic status (tertile)<br />
1 (Low) 584 4 242.7 9.74 (6.08, 13.4) 405 3 260.0 5.54 (2.17, 8.91) 7.92 (5.39, 10.44)<br />
2 (Medium) 465 3 303.3 5.2 (2.15, 8.25) 367 2 852.8 8.3 (3.84, 12.73) 6.63 (4.03, 9.22)<br />
3 (High) 284 2 298.8 6.41 (2.55, 10.27) 257 2 390.0 5.45 (0.80, 10.11) 5.92 (2.82, 9.02)<br />
Ethnicity<br />
Indigenous 94 436.7 6.86 (1.57, 12.15) 67 448.8 4.58 (-1.57, 10.73) 5.7 (1.69, 9.71)<br />
Non <strong>in</strong>digenous 1260 9 457.4 7.45 (5.32, 9.58) 977 8 085.0 6.52 (4.11, 8.92) 7.02 (5.46, 8.58)<br />
Oportunidades affiliation<br />
Yes 487 2 949.4 4 (2.08, 5.92) 311 2 296.4 7.81 (3.19, 12.43) 5.66 (3.33, 8.01)<br />
No 847 6 922.9 8.88 (6.07, 11.68) 717 6 188.5 6 (3.26, 8.63) 7.5 (5.6, 9.4)<br />
* N (thous<strong>and</strong>s) is the expansion for overall population expressed <strong>in</strong> thous<strong>and</strong>s<br />
139