Analytical Bias in a Quality Control Scheme - Clinical Chemistry
Analytical Bias in a Quality Control Scheme - Clinical Chemistry
Analytical Bias in a Quality Control Scheme - Clinical Chemistry
You also want an ePaper? Increase the reach of your titles
YUMPU automatically turns print PDFs into web optimized ePapers that Google loves.
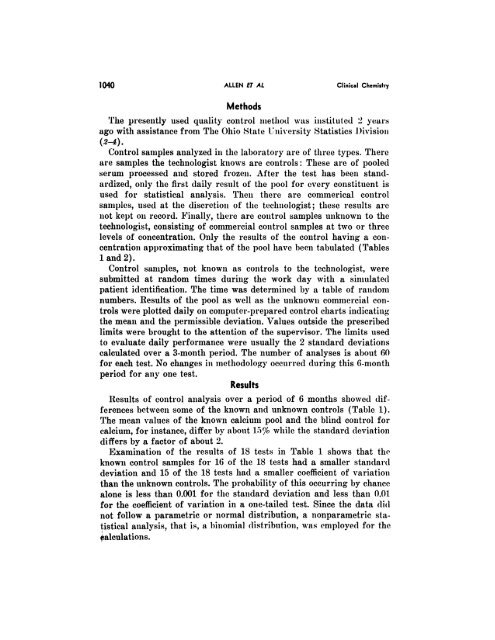
1040 ALLEN fT AL Cl<strong>in</strong>ical <strong>Chemistry</strong><br />
Methods<br />
The presently used quality control method was <strong>in</strong>stituted 2 years<br />
ago with assistance from The Ohio State I. lilversity Statistics l)ivisioii<br />
(2-4).<br />
<strong>Control</strong> samples analyzed <strong>in</strong> the laboratory are of three types. There<br />
are samples the technologist knows are controls: These are of pooled<br />
serum processed and stored frozen. After the test has beeii standardized,<br />
only the first daily result of the 1)001 for every constituent is<br />
used for statistical analysis. Tilell there are coni<strong>in</strong>erical control<br />
samples, used at the discretion of the technologist; these results are<br />
not kept on record. F<strong>in</strong>ally, there are control samples unknown to the<br />
technologist, consist<strong>in</strong>g of commercial control samples at two or three<br />
levels of concentration. Oniy the results of the control hav<strong>in</strong>g a concentration<br />
approximat<strong>in</strong>g that of the pool have been tabulated (Tables<br />
land 2).<br />
<strong>Control</strong> samples, not known as controls to tile technologist, were<br />
submitted at randoni times dur<strong>in</strong>g the work day with a sillluiated<br />
patient ielentilication. The time was determ<strong>in</strong>ed by a table of ratidom<br />
numbers. Results of the pool as well as the unknown commercial controls<br />
were plotted daily on conlputer-prepared control charts <strong>in</strong>dicat<strong>in</strong>g<br />
the mean and tile permissible deviation. Values outside the prescribed<br />
limits were brought to the attention of the supervisor. The limits used<br />
to evaluate daily performance were usually the 2 standard deviations<br />
calculated over a 3-month period. The number of analyses is about fit)<br />
for each test. No changes iii methodology occurred dur<strong>in</strong>g this -niontii<br />
period for any one test.<br />
Results<br />
Results of control analysis over a period of 6 months showed differences<br />
between sonic of tile known and unknown controls (Tal)le 1).<br />
rflle mean values of the known calcium pool and tile bl<strong>in</strong>d control for<br />
calcium, for <strong>in</strong>stance,differ by about 1% while the standard deviation<br />
differsby a factor of about 2.<br />
1xanumation of time results of 18 tests <strong>in</strong> Table 1 shows that the<br />
known control samples for 16 of the 18 tests had a smaller standard<br />
deviation and 15 of tile 18 tests had a smaller coefficient of variation<br />
than the unknown controls. The prohalility of this occurr<strong>in</strong>g by cilance<br />
alone is less than 0.001 for the standard deviation and less than 0.01<br />
for the coefficient of variation <strong>in</strong> a one-tailed test. S<strong>in</strong>ce the data did<br />
not follow a parametric or normal distribution, a nonparametric statistical<br />
analysis, that is, a b<strong>in</strong>omial distribution, was employed for the<br />
calculations.


