Analytical Bias in a Quality Control Scheme - Clinical Chemistry
Analytical Bias in a Quality Control Scheme - Clinical Chemistry
Analytical Bias in a Quality Control Scheme - Clinical Chemistry

Create successful ePaper yourself
Turn your PDF publications into a flip-book with our unique Google optimized e-Paper software.
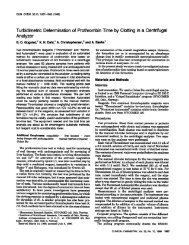
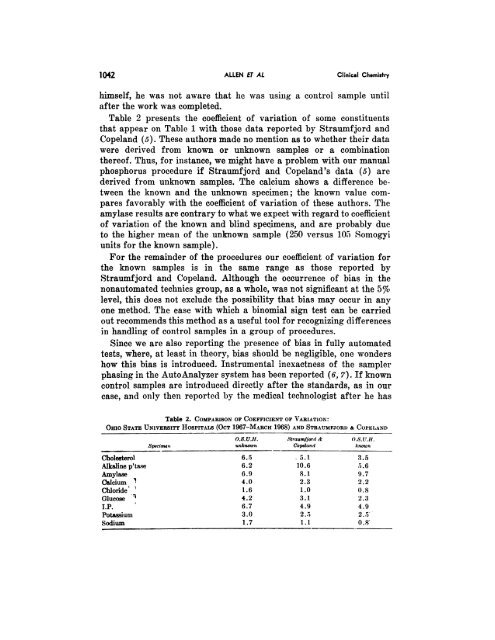
1042 ALLEN fT AL Cl<strong>in</strong>ical <strong>Chemistry</strong><br />
himself, he was not aware that lie was us<strong>in</strong>g a control sample until<br />
after the work was completed.<br />
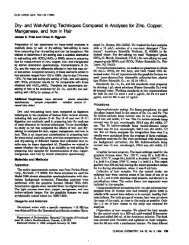
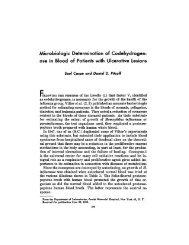
Table 2 presents the coefficient of variation of’ some constituents<br />
that appear on Table 1 with those data reported by Straumfjord and<br />
Copeland (5). These authors made no mention as to whether their data<br />
were derived from known or unknown samples or a comb<strong>in</strong>ation<br />
thereof. Thus, for <strong>in</strong>stance, we might have a problem with our manual<br />
phosphorus procedure if Straumfjord and Copeland’s data (5) are<br />
derived from unknown samples. The calcium shows a difference between<br />
the known and the unknown specimen; the known value compares<br />
favoi’ably with the coefficient of variation of these authors. The<br />
amylase results are contrary to what we expect with regard to coefficient<br />
of variation of the known and bl<strong>in</strong>d specimens, and are probably due<br />
to the higher mean of the unknown sample (250 versus l0 Somogyi<br />
units for the known sample).<br />
For the rema<strong>in</strong>der of the procedures our coefficient of variation for<br />
the known samples is <strong>in</strong> the same range as those reported by<br />
Straumfjord and Copeland. Although the occurrence of bias <strong>in</strong> the<br />
imonautomated tecl<strong>in</strong>ics group, as a whole, was not significant at the 5%<br />
level, this does not exclude the possibility that bias may occur <strong>in</strong> any<br />
one method. The ease with which a b<strong>in</strong>omial sign test can be carried<br />
out recommends this method as a useful tool for recogniz<strong>in</strong>g differences<br />
<strong>in</strong> handl<strong>in</strong>g of control samples <strong>in</strong> a group of procedures.<br />
S<strong>in</strong>ce we are also report<strong>in</strong>g the presence of bias <strong>in</strong> fully automated<br />
tests, where, at least <strong>in</strong> theory, bias should be negligible, one wonders<br />
how this bias is <strong>in</strong>troduced. Instrumental <strong>in</strong>exactness of the sampler<br />
phas<strong>in</strong>g <strong>in</strong> the AutoAnalyzer system has been reported (6, 7). If known<br />
control samples are <strong>in</strong>troduced directly after the standards, as <strong>in</strong> our<br />
case, arid only then reported by the medical technologist after he has<br />
Table 2. CoMPARISON OF COEFFICIENT OF \ARIATION:<br />
OHIO STATE U NIVERSITY IIosPcrus<br />
(OcT 1967-MARCH 1968) AND STRAUMFJO RI) & Cul’EJ.AND<br />
Specimen<br />
O.S.U.I!. Slraumfjord&<br />
uaknown - Copeland<br />
Cholesterol 6.5 .5. 1 3.5<br />
Alkal<strong>in</strong>e p’tase 6.2 10.6 5.6<br />
Amylase<br />
6.9 8.1<br />
9.7<br />
Calcium<br />
4.0 2.3<br />
2.2<br />
Chloride’<br />
1.6 1.0<br />
0.8<br />
Glucose<br />
4.2 3.1<br />
2.3<br />
I.P.<br />
6.7 4.9<br />
49<br />
Potassium 3.0 2.5 2.5<br />
Sodium 1.7 1.1 - 0.8<br />
().S.U.II.<br />
known