Intensification Of Low Energy Nuclear Reactions ... - LENR-CANR
Intensification Of Low Energy Nuclear Reactions ... - LENR-CANR
Intensification Of Low Energy Nuclear Reactions ... - LENR-CANR

You also want an ePaper? Increase the reach of your titles
YUMPU automatically turns print PDFs into web optimized ePapers that Google loves.
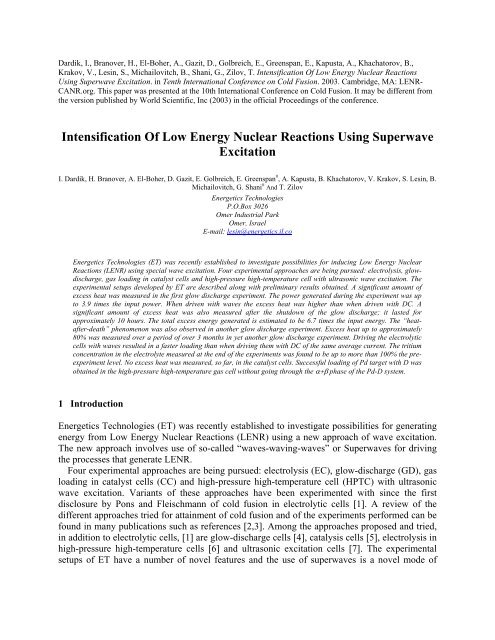
Dardik, I., Branover, H., El-Boher, A., Gazit, D., Golbreich, E., Greenspan, E., Kapusta, A., Khachatorov, B.,<br />
Krakov, V., Lesin, S., Michailovitch, B., Shani, G., Zilov, T. <strong>Intensification</strong> <strong>Of</strong> <strong>Low</strong> <strong>Energy</strong> <strong>Nuclear</strong> <strong>Reactions</strong><br />
Using Superwave Excitation. in Tenth International Conference on Cold Fusion. 2003. Cambridge, MA: <strong>LENR</strong>-<br />
<strong>CANR</strong>.org. This paper was presented at the 10th International Conference on Cold Fusion. It may be different from<br />
the version published by World Scientific, Inc (2003) in the official Proceedings of the conference.<br />
<strong>Intensification</strong> <strong>Of</strong> <strong>Low</strong> <strong>Energy</strong> <strong>Nuclear</strong> <strong>Reactions</strong> Using Superwave<br />
Excitation<br />
I. Dardik, H. Branover, A. El-Boher, D. Gazit, E. Golbreich, E. Greenspan # , A. Kapusta, B. Khachatorov, V. Krakov, S. Lesin, B.<br />
Michailovitch, G. Shani # And T. Zilov<br />
Energetics Technologies<br />
P.O.Box 3026<br />
Omer Industrial Park<br />
Omer, Israel<br />
E-mail: lesin@energetics.il.co<br />
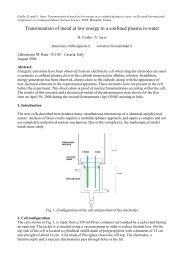
Energetics Technologies (ET) was recently established to investigate possibilities for inducing <strong>Low</strong> <strong>Energy</strong> <strong>Nuclear</strong><br />
<strong>Reactions</strong> (<strong>LENR</strong>) using special wave excitation. Four experimental approaches are being pursued: electrolysis, glowdischarge,<br />
gas loading in catalyst cells and high-pressure high-temperature cell with ultrasonic wave excitation. The<br />
experimental setups developed by ET are described along with preliminary results obtained. A significant amount of<br />
excess heat was measured in the first glow discharge experiment. The power generated during the experiment was up<br />
to 3.9 times the input power. When driven with waves the excess heat was higher than when driven with DC. A<br />
significant amount of excess heat was also measured after the shutdown of the glow discharge; it lasted for<br />
approximately 10 hours. The total excess energy generated is estimated to be 6.7 times the input energy. The “heatafter-death”<br />
phenomenon was also observed in another glow discharge experiment. Excess heat up to approximately<br />
80% was measured over a period of over 3 months in yet another glow discharge experiment. Driving the electrolytic<br />
cells with waves resulted in a faster loading than when driving them with DC of the same average current. The tritium<br />
concentration in the electrolyte measured at the end of the experiments was found to be up to more than 100% the preexperiment<br />
level. No excess heat was measured, so far, in the catalyst cells. Successful loading of Pd target with D was<br />
obtained in the high-pressure high-temperature gas cell without going through the α+β phase of the Pd-D system.<br />
1 Introduction<br />
Energetics Technologies (ET) was recently established to investigate possibilities for generating<br />
energy from <strong>Low</strong> <strong>Energy</strong> <strong>Nuclear</strong> <strong>Reactions</strong> (<strong>LENR</strong>) using a new approach of wave excitation.<br />
The new approach involves use of so-called “waves-waving-waves” or Superwaves for driving<br />
the processes that generate <strong>LENR</strong>.<br />
Four experimental approaches are being pursued: electrolysis (EC), glow-discharge (GD), gas<br />
loading in catalyst cells (CC) and high-pressure high-temperature cell (HPTC) with ultrasonic<br />
wave excitation. Variants of these approaches have been experimented with since the first<br />
disclosure by Pons and Fleischmann of cold fusion in electrolytic cells [1]. A review of the<br />
different approaches tried for attainment of cold fusion and of the experiments performed can be<br />
found in many publications such as references [2,3]. Among the approaches proposed and tried,<br />
in addition to electrolytic cells, [1] are glow-discharge cells [4], catalysis cells [5], electrolysis in<br />
high-pressure high-temperature cells [6] and ultrasonic excitation cells [7]. The experimental<br />
setups of ET have a number of novel features and the use of superwaves is a novel mode of
operation. A number of experiments, such as that reported in [8], used much simpler modulation,<br />
in the form of square waves, to drive electrolytic cell experiments.<br />
The purpose of this paper is to describe the experimental systems designed and constructed by<br />
ET and to report upon preliminary results obtained.<br />
2 Superwaves<br />
The idea of Superwaves for enhancing the probability of <strong>LENR</strong> was first proposed by Dr. Irving<br />
I. Dardik. The waves waving waves are a special modulation of several waves of different<br />
frequency and amplitude.<br />
Figure 1 illustrates the type of Superwaves being used in the ET experiments. This wave<br />
has a fundamental mode, F0(t), on top of which two higher frequency modes – F1(t) and F2(t), are<br />
superimposed. An illustration of a more realistic wave used in the ET experiments is given in<br />
Figure 8 below.<br />
Figure 1. Double amplitude modulated Superwave<br />
3 Glow Discharge Cells<br />
The general layout of the GD cell designed at ET is shown in Figure 2 while a photograph of the<br />
cell is shown in Figure 3. The GD cell is made of a stainless steel cylinder. The inner surface of<br />
the stainless steel cylinder is coated with palladium using vapor deposition. In several cells a<br />
cylindrical Pd foil is inserted into the cell instead of the Pd coated film. The Pd surface<br />
constitutes one electrode, and a wire in the center of the cell constitutes the other electrode. The<br />
central wire is made of thoriated tungsten. Deuterium gas fills the volume of the cylinder. The<br />
pressure of the deuterium gas is in the range 5 to 100 torr before the initiation of the glow<br />
discharge. The body of the cylinder is constructed such that cooling water would extract the heat<br />
input to the glow discharge along with any amount of excess heat generated by <strong>LENR</strong>.
Figure 2 A simplified cross section of the glow-discharge cell<br />
A positive voltage between 300 and 1000 volts is applied to the central wire while the GD cell<br />
outer cylinder is maintained at ground potential. The small amount of thorium included in the<br />
central wire electrode is slightly radioactive, thus facilitating the establishment of the discharge<br />
throughout the gas volume. The ions created are forced by the electric potential towards the cell<br />
outer cylindrical wall and impinge upon the Pd target with a relatively high kinetic energy.<br />
Figure 3 A view of the glow-discharge cell. The channels between the spiraling fins are for coolant flow<br />
A dedicated computer drives the GD cells and collects, stores and analyzes the experimental<br />
data. A LabVIEW program was developed for this purpose. The following types of<br />
measurements are taken, on line, during the GD experiments: instantaneous input voltage and
electric current, water inlet and outlet temperature, water mass flow rate, gas pressure in the cell,<br />
the ambient, gas and cell wall temperatures, and the gas flow rate. The output power is<br />
proportional to the water mass flow rate times the water outlet minus inlet temperatures. The<br />
input power is calculated as the product of the instantaneous voltage and current at a rate of<br />
50,000 scans per second. The computer also time averages the input power and integrates the<br />
instantaneous power to give the accumulated amount of energy invested in the GD cell. The<br />
computer power and energy calculations were checked against a precision power meter and<br />
found to be accurate.<br />
Figure 4 shows the evolution of input and output power in the first GD experiment, ETG-1.<br />
This glow discharge experiment started with 500 volts and 1.54 milliamps DC for an input power<br />
of 0.77 watts. After 2000 seconds of operation, the DC power stabilized and the output power<br />
was 2.77 watts. A Superwave was then applied. The input power Pin increased to 0.95 watts and<br />
Pout increased to 3.685 watts giving Pout/Pin of 3.88.<br />
Figure 5 shows the evolution of input energy, output energy and excess energy in the ETG-1<br />
experiment described above. The ratio of total energy removed from the cell to total energy<br />
invested in the cell in this experiment was 6.72.<br />
Power, W<br />
4<br />
3.5<br />
3<br />
2.5<br />
2<br />
1.5<br />
1<br />
0.5<br />
0<br />
DC<br />
Waves<br />
Waves<br />
Shut Down<br />
Pin<br />
Pout<br />
0 2 4 6 8 10 12<br />
Time, h<br />
Figure 4 Evolution of input and output power in the ETG-1 experiment<br />
The glow discharge was turned off for the weekend. Heat continued to be emitted from the cell<br />
for some 10 hours thereafter. The cell would not restart after the weekend. It was found that the<br />
entire palladium film deposited on the inner surface of the stainless steel cylindrical body of the<br />
GD cell had flaked off and accumulated at the bottom of the horizontal cylinder.
Ener gy,kJ<br />
80<br />
70<br />
60<br />
50<br />
40<br />
30<br />
20<br />
10<br />
0<br />
Ein<br />
Eout<br />
Ex ( Excess <strong>Energy</strong> = Eout - Ein )<br />
0 2 4 6 8 10 12 14<br />
Time,h<br />
Figure 5 Evolution of input and output energy in the ETG-1 experiment<br />
In the second experiment, ETG-2, a 100 micron thick palladium foil was used for the cathode.<br />
Figure 6 shows the evolution of Superwave input power used to drive the cell and of the output<br />
power. The cell operated for approximately two days. The peak Pin/Pout ratio was 1.8. The total<br />
energy input and output was, respectively, 125 kJ and 205 k J giving an excess energy of 64%.<br />
No heat after death was observed. Upon opening the cell after the experiment, it was observed<br />
that the palladium foil had black spots on its surface facing the glow discharge.<br />
In a later experiment using a different Pd foil excess heat was measured continuously for a<br />
period of over 3 months at a level between 20% and 80%.<br />
No excess heat has been measured in approximately twenty other GD experiments. A<br />
significant fraction of these other experiments encountered technical problems. All the problems<br />
encountered have been solved and the GD cell and its setup have been improved.<br />
Figure 6 Evolution of input and output power in the ETG-2 experiment
4 Electrolytic Cells<br />
Figure 7 shows the overall layout of the electrolytic cells designed and constructed by ET. The<br />
cathode is 8 cm long (6 cm in effective length), 0.7 cm wide and 50 or 100 microns thick Pd foil.<br />
Two platinum foils of similar dimensions are used for the anode. They are located 5 mm from<br />
each side of the cathode. The cathode-anode assembly is immersed in an electrolyte made of 0.1<br />
to 1M LiOD in D2O. The electrolyte and the cathode-anode are inside a cell made from two<br />
nested aluminum cylinders with alumina powder thermal insulation in between the cylinders<br />
(Figure 7). The cell is immersed in a constant temperature water bath. Several sensors monitor<br />
the temperature in different locations in the cell. The cell has an external recombiner.<br />
Presently there are five electrolytic cells working in parallel; three cells in one water bath, and<br />
two in another water bath. A dedicated computer drives all the cells. The same computer also<br />
collects, stores and analyzes the experimental data. Temperatures readings are done at a rate of<br />
0.3 scans per second, whereas voltage and current readings are taken at a rate of 50,000 scans per<br />
second. The cathode resistance was measured to infer the level of D loading. A LabVIEW<br />
program was developed to perform all these functions. A typical Superwave generated by this<br />
computer control system is given in Figure 8.<br />
Figure 7 Schematic layout of the ET electrolytic cells
Figure 8 A typical Superwave used for driving the ET electrolytic cell<br />
A couple of dozen Pd foils have been experimented with so far. Dr. Vittorio Violante of the<br />
Frascatti research center in Italy provided several of the foils. The foils were degreased and<br />
annealed before use. So far, only few of the cells generated excess heat. The excess heat was<br />
low; typically 15%. However, application of the Superwave was found to significantly accelerate<br />
the deuterium loading-rate into the Pd cathode, as illustrated in the two different experiments<br />
shown in Figure 9.
5<br />
Catalyst Cells<br />
Figure 9 Effect of Superwaves on the rate of deuterium loading into the palladium cathode<br />
Figure<br />
10 shows a schematic layout of the catalyst cells designed and constructed by ET while<br />
Figure 11 shows the mechanism used for the Superwave excitation of these cells.<br />
The catalyst cell is a cylindrical vessel of stainless-steel 0.4 liter in volume. The vessel flange<br />
is equipped with two 1/4" tube fittings for connection to a gas manifold, vacuum pump and<br />
pressure transducer. A high-temperature O-ring is used for sealing. A thermocouple well is<br />
welded to the flange and immersed in the cell. Three thermocouples are inserted into the well –
one is connected to a temperature controller and the others measure the temperature gradient<br />
along the axis of the cell. Three gas pipelines – for H2, D2 and He, are connected to the manifold.<br />
A high sensitivity pressure regulator controls the gas pressure.<br />
T<br />
PT<br />
PG<br />
D2 or H2<br />
HIGH-TEMPERATURE<br />
REACTOR<br />
CATALYST<br />
FURNACE<br />
Range of main parameters:<br />
Weight of Catalyst: 70-100g<br />
Temperature: 150 – 300ºC<br />
Pressure: up to 5bar<br />
Gas Flow Rate: 1-2cc/min<br />
Figure 10 A schematic layout of the ET catalyst cell<br />
A special long stroke piston system is used to generate modulated<br />
pressure in the catalyst cell.<br />
The<br />
pressure modulations are designed to be of a Superwave form. The experiment computer<br />
controls<br />
the pressure modulation as well as the temperature control and power regulation. A<br />
specially designed tubular furnace having a maximum capacity of 500 W supplies the power.<br />
The measurements of voltage, current, pressure and temperature are performed, stored and<br />
analyzed by 'Agilent' HP - 34970A data-logger that is governed by the experiment computer<br />
using a LabVIEW software developed by ET.<br />
Figure 11 A schematic layout of the ET catalyst cell gas pressure modulation mechanism
The catalyst cell system is designed to measure the power input required to obtain a given<br />
steady<br />
state temperature. That is, the test for excess heat is based on a comparison of the power<br />
consumption<br />
of an external heater required for keeping the same cell temperature when the tested<br />
catalyst is in contact with D2 versus when it is in contact with H2. The latter is used as a<br />
reference. The difference between the power levels required for maintaining the same steady<br />
state temperature is proportional to the excess heat.<br />
Experiments with the catalyst cells have just been started; there are no results to report upon<br />
yet.<br />
6 High<br />
Pressure High Temperature Cell<br />
s in a broad range of pressures – up to 10 MPa, and<br />
mperatures – up to 350 o This cell is designed to carry out experiment<br />
te<br />
C, as well as with stimulation by ultrasound waves and by ultrasound<br />
induced cavitations. Two basic modes of operation are planned for this cell -- gas loading<br />
experiments as well as electrolytic experiments.<br />
Figure 12 shows a cross section of the high-pressure high-temperature cell (HPTC) for gas<br />
loading experiments. The cell is made of two 30 cm thick steel hemispheres connected by<br />
flanges<br />
and sealed by a copper ring seal.<br />
Heater<br />
Pd sample<br />
(cathode)<br />
Figure 12 A schematic layout of the ET high-pressure high-temperature cell for gas loading experiments<br />
The upper hemisphere is equipped with two pipes, one for D2 supply and the other<br />
serves as a<br />
safety<br />
valve and as a monitor of the cell pressure; it has seven chevron seals. A cooling pipe is<br />
introduced<br />
into the cell through the central seal. The metal target is attached to the lower end of<br />
the cooling pipe insert. The target system is comprised of a quartz insulator with the anode<br />
leaning on it. The anode is a spherical segment of a 50-100 µm thick platinum foil. The cathode
is fastened onto the insulator bit; it is made of a 50 µm thick palladium foil that has a shape of a<br />
spherical segment. A grid is introduced between the cathode and the anode.<br />
The first set of experiments to be conducted in the HPTC will be D2 gas loading at high<br />
pressure and high temperature following a pressure-temperature trajectory that will avoid passing<br />
through<br />
the α+β phase of the Pd-D system. To do this it is necessary to load the D2 at above<br />
275<br />
sis with or without ultrasound cavitations. The intent is to start these experiments after<br />
lo<br />
Pd cathode. Eight of the<br />
ra<br />
o C and 3.5 MPa. A successful loading was achieved in preliminary experiments performed so<br />
far.<br />
The second set of experiments planned for this cell is high-pressure high-temperature<br />
electroly<br />
ading the Pd cathode with high-pressure high-temperature D2 gas, then to lower the loaded<br />
cathode into an electrolyte that will fill approximately half of the cell.<br />
Ultrasonic radiators capable of operating in the Superwave mode are attached to the lower<br />
hemisphere of the cell to induce cavitation near the surface of the<br />
diators can operate at a frequency of 50 or 100 kHz and other 16 radiators can operate at a<br />
frequency of 1 MHz. The experiments of this type are expected to start in 2004.<br />
7 Summary<br />
Four different types of cells and the associated experimental systems have been designed and<br />
constructed<br />
by ET. These experimental setups will be used to investigate feasibility for<br />
generating excess energy via <strong>Low</strong> <strong>Energy</strong> <strong>Nuclear</strong> <strong>Reactions</strong> using Superwave excitation.<br />
Preliminary results obtained with the glow discharge and electrolytic cells are encouraging. An<br />
excess energy of 6.7 times the input energy was obtained in one of the experiments. This<br />
experiment also generated a significant amount of “heat after death”. Superwaves were found to<br />
significantly accelerate the loading of deuterium into the palladium cathode of electrolytic cells.<br />
They also generated higher excess heat in the successful glow discharge experiment.<br />
Acknowledgments<br />
This work is funded by Mr. Sidney Kimmel. Professor George Miley of the University of Illinois<br />
(UI)<br />
at Urbana-Champaign helped us to start the electrolytic cell program by providing<br />
information on the design of a wire type electrolytic cell he had been experimenting with.<br />
Professor Miley also enabled Giovanna Selvagi, the student who constructed and did successful<br />
experiments with this cell at the UI, to come to Omer and work with our team to duplicate the<br />
wire electrolytic cell experiment of the UI. This experience helped us in the design of our own<br />
cells described in Section 4.<br />
References<br />
[1] M. Fleischmann<br />
and S. Pons, "Electrochemically Induced <strong>Nuclear</strong> Fusion of Deuterium", J.<br />
Electroanal. Chem. 261 (1989) 301.<br />
[2] Charles Beaudette, “Excess Heat & Why Cold Fusion Research Prevailed”, 2nd ed., South<br />
Bristol, Maine, Oak Grove Press, (2002).<br />
[3] E. Storms, "A Critical Review of the "Cold Fusion" Effect", J. Sci. Explor. 10, #2 (1996)<br />
185. Also: http://www.jse.com/storms/1.ht ml<br />
[4] A.B. Karabut, Ya.R. Kucherov, and I.B. Savvatimova, "<strong>Nuclear</strong> product ratio for glow<br />
discharge in deuterium". Physics Letters A, 17 0,<br />
265-272 (1992).
[5] L.C. Case, “Catalytic Fusion of Deuterium into Helium-4”, the Seventh International<br />
Conference on Cold Fusion. 1998. Vancouver, Canada: ENECO, Inc., Salt Lake City, UT.<br />
[6] T. Mizuno, “<strong>Nuclear</strong> Transmutation: The Reality of Cold Fusion,” Chapter 4, Infinite<br />
<strong>Energy</strong> Press, Concord, N.H., USA, 1998.<br />
[7] Y. Arata and Y.C Zhang, “<strong>Nuclear</strong> Fusion Reacted Inside Metals by Intense<br />
Sonoimplantation Effect,“ Proc. of the Japa n Academy, 78,<br />
Ser. B, No. 3 (2002).<br />
[6] L. Bertalot, F. De Marco, A. De Ninno, A. La Barbera, F. Scaramuzzi, V. Violante, P.<br />
Zeppa, "Study of deuterium charging in palladium by the electrolysis of heavy water:<br />
heat<br />
excess production", Nuovo Cimento 15 D (1993) 1435.