Smart-phone augmented reality for public participation in urban ...
Smart-phone augmented reality for public participation in urban ...
Smart-phone augmented reality for public participation in urban ...

You also want an ePaper? Increase the reach of your titles
YUMPU automatically turns print PDFs into web optimized ePapers that Google loves.
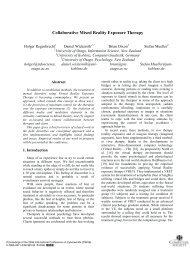
Mobile Device Familiarity<br />
It was found that subjects <strong>in</strong> general were less familiar<br />
with touch-screen smart-<strong>phone</strong>s than regular cell <strong>phone</strong>s.<br />
The 18-25 age group showed a higher level of familiarity<br />
with smart-<strong>phone</strong> technology (mean=5.2, stdev=1.75)<br />
than the 26-plus age group (mean=2.375, stdev=2.2). The<br />
26-plus age group showed a greater difference <strong>in</strong><br />
familiarity between cell-<strong>phone</strong>s and smart-<strong>phone</strong>s.<br />
Figure 4. Mobile device familiarity results <strong>for</strong> all<br />
participants.<br />
Figure 4 shows the responses from all subjects to these<br />
first three questions of the questionnaire. The variance <strong>in</strong><br />
the results was quite large (3.04 and 4.87 <strong>for</strong> Question 1<br />
and Question 2 respectively), so the median value <strong>for</strong><br />
these responses was used <strong>for</strong> comparison. This can be<br />
seen <strong>in</strong> Figure 4 where the median value <strong>for</strong> cell-<strong>phone</strong><br />
familiarity was 6 and the median value <strong>for</strong> smart-<strong>phone</strong><br />
familiarity was 3.5. Although this comparison shows a<br />
rather significant drop <strong>in</strong> the participant's familiarity with<br />
smart-<strong>phone</strong>s compared to cell-<strong>phone</strong>s (Q1 mean=5.28,<br />
stdev=1.74; Q2 mean=3.95, stdev=2.2; p=0.024), the<br />
rather large range <strong>in</strong> the upper and lower quartiles of the<br />
responses suggest the presence of some underly<strong>in</strong>g<br />
contribut<strong>in</strong>g factor to these responses. It was anticipated<br />
that one possible factor was the age difference between<br />
the participants, where it was assumed that the younger<br />
participants would be more familiar with mobile device<br />
technology. The follow<strong>in</strong>g figures, Figure 5 and Figure 6,<br />
show the responses from the 18-25 year old group and the<br />
26-plus age group respectively.<br />
Figure 5 shows a much closer level of familiarity with<br />
cell-<strong>phone</strong>s and smart-<strong>phone</strong>s <strong>in</strong> the 18-25 year old age<br />
group ('18-25' Q1 median=6, Q2 median=5.5) than the<br />
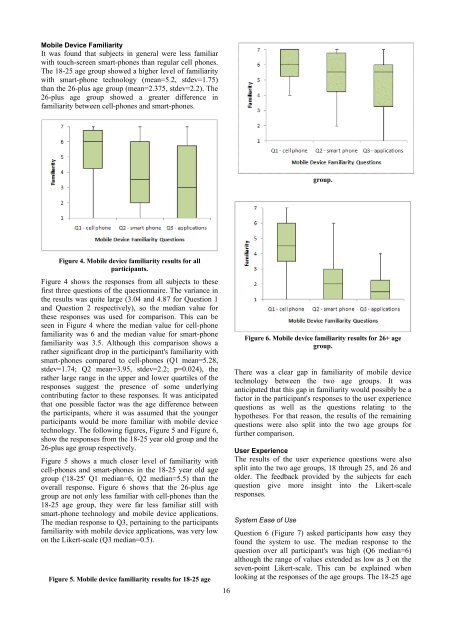
overall response. Figure 6 shows that the 26-plus age<br />
group are not only less familiar with cell-<strong>phone</strong>s than the<br />
18-25 age group, they were far less familiar still with<br />
smart-<strong>phone</strong> technology and mobile device applications.<br />
The median response to Q3, perta<strong>in</strong><strong>in</strong>g to the participants<br />
familiarity with mobile device applications, was very low<br />
on the Likert-scale (Q3 median=0.5).<br />
Figure 5. Mobile device familiarity results <strong>for</strong> 18-25 age<br />
16<br />
group.<br />
Figure 6. Mobile device familiarity results <strong>for</strong> 26+ age<br />
group.<br />
There was a clear gap <strong>in</strong> familiarity of mobile device<br />
technology between the two age groups. It was<br />
anticipated that this gap <strong>in</strong> familiarity would possibly be a<br />
factor <strong>in</strong> the participant's responses to the user experience<br />
questions as well as the questions relat<strong>in</strong>g to the<br />
hypotheses. For that reason, the results of the rema<strong>in</strong><strong>in</strong>g<br />
questions were also split <strong>in</strong>to the two age groups <strong>for</strong><br />
further comparison.<br />
User Experience<br />
The results of the user experience questions were also<br />
split <strong>in</strong>to the two age groups, 18 through 25, and 26 and<br />
older. The feedback provided by the subjects <strong>for</strong> each<br />
question give more <strong>in</strong>sight <strong>in</strong>to the Likert-scale<br />
responses.<br />
System Ease of Use<br />
Question 6 (Figure 7) asked participants how easy they<br />
found the system to use. The median response to the<br />
question over all participant's was high (Q6 median=6)<br />
although the range of values extended as low as 3 on the<br />
seven-po<strong>in</strong>t Likert-scale. This can be expla<strong>in</strong>ed when<br />
look<strong>in</strong>g at the responses of the age groups. The 18-25 age