Smart-phone augmented reality for public participation in urban ...
Smart-phone augmented reality for public participation in urban ...
Smart-phone augmented reality for public participation in urban ...

You also want an ePaper? Increase the reach of your titles
YUMPU automatically turns print PDFs into web optimized ePapers that Google loves.
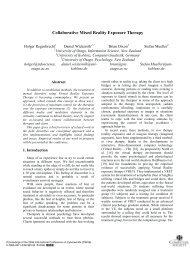
<strong>for</strong>m of vot<strong>in</strong>g) as a result of us<strong>in</strong>g the system would be<br />
considered and used by the organisers of the event dur<strong>in</strong>g<br />
the decision process. The feedback given by the<br />
participants helped expla<strong>in</strong> why the results were fairly<br />
neutral, with a large range (between 6 and 2 on the<br />
Likert-scale). It was suggested that the vot<strong>in</strong>g from the<br />
system would only be a significant factor <strong>in</strong> determ<strong>in</strong><strong>in</strong>g<br />
the outcome of the <strong>urban</strong> plann<strong>in</strong>g process if enough<br />
people used the system and the results of the vot<strong>in</strong>g were<br />
made <strong>public</strong>. A few of the users felt that the organisers<br />
would not be likely to consider feedback from the <strong>public</strong>,<br />
and that they were more <strong>in</strong>terested <strong>in</strong> the views of<br />
bus<strong>in</strong>esses. A few users appreciated the fact that there<br />
were hidden but sensible processes <strong>in</strong> the plann<strong>in</strong>g<br />
process that might not accommodate <strong>public</strong> <strong>in</strong>put.<br />
Figure 10. Perceived <strong>participation</strong> <strong>in</strong> the simulated <strong>urban</strong><br />
plann<strong>in</strong>g event<br />
Will<strong>in</strong>gness to Participate<br />
Paired two-sample t-tests (with alpha value=0.05) were<br />
per<strong>for</strong>med to compare the values of means between the<br />
questions relat<strong>in</strong>g to the hypothesis. The results of the ttests<br />
can be considered significant, that is, it is highly<br />
likely that the difference <strong>in</strong> means between the two<br />
populations did not occur by chance, if the p-value of the<br />
test is less than 0.05. P-values between 0.05 and 0.1 can<br />
be considered marg<strong>in</strong>ally significant (Utts and Heckard,<br />
2005). The two-tailed t-test p-value was used <strong>in</strong> the<br />
analysis of this data as the anticipated difference between<br />
the means could be either positive or negative.<br />
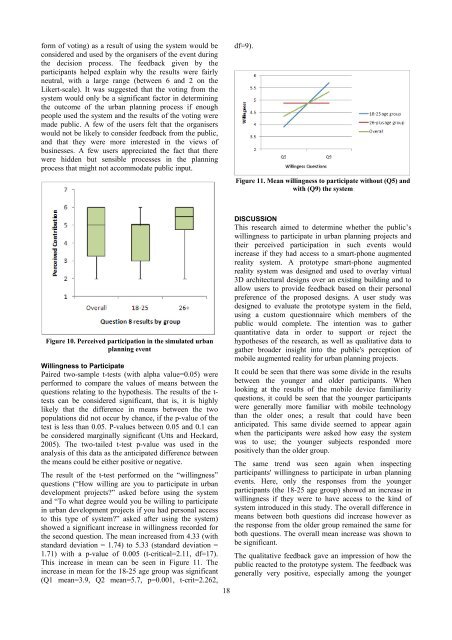
The result of the t-test per<strong>for</strong>med on the “will<strong>in</strong>gness”<br />
questions (“How will<strong>in</strong>g are you to participate <strong>in</strong> <strong>urban</strong><br />
development projects?” asked be<strong>for</strong>e us<strong>in</strong>g the system<br />
and “To what degree would you be will<strong>in</strong>g to participate<br />
<strong>in</strong> <strong>urban</strong> development projects if you had personal access<br />
to this type of system?” asked after us<strong>in</strong>g the system)<br />
showed a significant <strong>in</strong>crease <strong>in</strong> will<strong>in</strong>gness recorded <strong>for</strong><br />
the second question. The mean <strong>in</strong>creased from 4.33 (with<br />
standard deviation = 1.74) to 5.33 (standard deviation =<br />
1.71) with a p-value of 0.005 (t-critical=2.11, df=17).<br />
This <strong>in</strong>crease <strong>in</strong> mean can be seen <strong>in</strong> Figure 11. The<br />
<strong>in</strong>crease <strong>in</strong> mean <strong>for</strong> the 18-25 age group was significant<br />
(Q1 mean=3.9, Q2 mean=5.7, p=0.001, t-crit=2.262,<br />
18<br />
df=9).<br />
Figure 11. Mean will<strong>in</strong>gness to participate without (Q5) and<br />
with (Q9) the system<br />
DISCUSSION<br />
This research aimed to determ<strong>in</strong>e whether the <strong>public</strong>’s<br />
will<strong>in</strong>gness to participate <strong>in</strong> <strong>urban</strong> plann<strong>in</strong>g projects and<br />
their perceived <strong>participation</strong> <strong>in</strong> such events would<br />
<strong>in</strong>crease if they had access to a smart-<strong>phone</strong> <strong>augmented</strong><br />
<strong>reality</strong> system. A prototype smart-<strong>phone</strong> <strong>augmented</strong><br />
<strong>reality</strong> system was designed and used to overlay virtual<br />
3D architectural designs over an exist<strong>in</strong>g build<strong>in</strong>g and to<br />
allow users to provide feedback based on their personal<br />
preference of the proposed designs. A user study was<br />
designed to evaluate the prototype system <strong>in</strong> the field,<br />
us<strong>in</strong>g a custom questionnaire which members of the<br />
<strong>public</strong> would complete. The <strong>in</strong>tention was to gather<br />
quantitative data <strong>in</strong> order to support or reject the<br />
hypotheses of the research, as well as qualitative data to<br />
gather broader <strong>in</strong>sight <strong>in</strong>to the <strong>public</strong>'s perception of<br />
mobile <strong>augmented</strong> <strong>reality</strong> <strong>for</strong> <strong>urban</strong> plann<strong>in</strong>g projects.<br />
It could be seen that there was some divide <strong>in</strong> the results<br />
between the younger and older participants. When<br />
look<strong>in</strong>g at the results of the mobile device familiarity<br />
questions, it could be seen that the younger participants<br />
were generally more familiar with mobile technology<br />
than the older ones; a result that could have been<br />
anticipated. This same divide seemed to appear aga<strong>in</strong><br />
when the participants were asked how easy the system<br />
was to use; the younger subjects responded more<br />
positively than the older group.<br />
The same trend was seen aga<strong>in</strong> when <strong>in</strong>spect<strong>in</strong>g<br />
participants' will<strong>in</strong>gness to participate <strong>in</strong> <strong>urban</strong> plann<strong>in</strong>g<br />
events. Here, only the responses from the younger<br />
participants (the 18-25 age group) showed an <strong>in</strong>crease <strong>in</strong><br />
will<strong>in</strong>gness if they were to have access to the k<strong>in</strong>d of<br />
system <strong>in</strong>troduced <strong>in</strong> this study. The overall difference <strong>in</strong><br />
means between both questions did <strong>in</strong>crease however as<br />
the response from the older group rema<strong>in</strong>ed the same <strong>for</strong><br />
both questions. The overall mean <strong>in</strong>crease was shown to<br />
be significant.<br />
The qualitative feedback gave an impression of how the<br />
<strong>public</strong> reacted to the prototype system. The feedback was<br />
generally very positive, especially among the younger