Effects of air voids on ultrasonic wave propagation in early age ...
Effects of air voids on ultrasonic wave propagation in early age ...
Effects of air voids on ultrasonic wave propagation in early age ...

You also want an ePaper? Increase the reach of your titles
YUMPU automatically turns print PDFs into web optimized ePapers that Google loves.
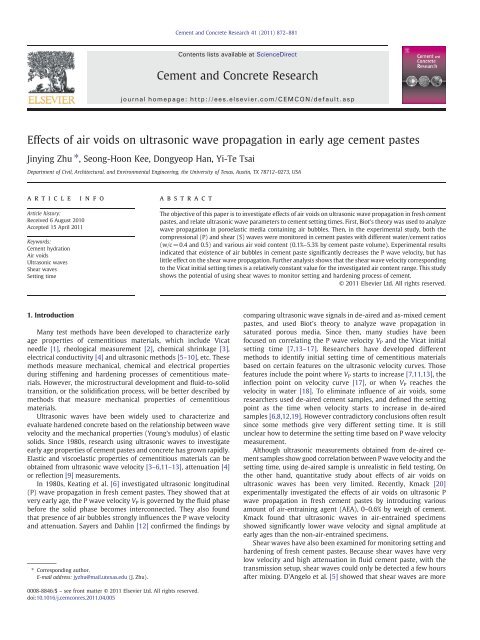
<str<strong>on</strong>g>Effects</str<strong>on</strong>g> <str<strong>on</strong>g>of</str<strong>on</strong>g> <str<strong>on</strong>g>air</str<strong>on</strong>g> <str<strong>on</strong>g>voids</str<strong>on</strong>g> <strong>on</strong> ultras<strong>on</strong>ic <strong>wave</strong> propagati<strong>on</strong> <strong>in</strong> <strong>early</strong> <strong>age</strong> cement pastes<br />
J<strong>in</strong>y<strong>in</strong>g Zhu ⁎, Se<strong>on</strong>g-Ho<strong>on</strong> Kee, D<strong>on</strong>gyeop Han, Yi-Te Tsai<br />
Department <str<strong>on</strong>g>of</str<strong>on</strong>g> Civil, Architectural, and Envir<strong>on</strong>mental Eng<strong>in</strong>eer<strong>in</strong>g, the University <str<strong>on</strong>g>of</str<strong>on</strong>g> Texas, Aust<strong>in</strong>, TX 78712–0273, USA<br />
article <strong>in</strong>fo<br />
Article history:<br />
Received 6 August 2010<br />
Accepted 15 April 2011<br />
Keywords:<br />
Cement hydrati<strong>on</strong><br />
Air <str<strong>on</strong>g>voids</str<strong>on</strong>g><br />
Ultras<strong>on</strong>ic <strong>wave</strong>s<br />
Shear <strong>wave</strong>s<br />
Sett<strong>in</strong>g time<br />
1. Introducti<strong>on</strong><br />
abstract<br />
Many test methods have been developed to characterize <strong>early</strong><br />
<strong>age</strong> properties <str<strong>on</strong>g>of</str<strong>on</strong>g> cementitious materials, which <strong>in</strong>clude Vicat<br />
needle [1], rheological measurement [2], chemical shr<strong>in</strong>k<strong>age</strong> [3],<br />
electrical c<strong>on</strong>ductivity [4] and ultras<strong>on</strong>ic methods [5–10], etc.These<br />
methods measure mechanical, chemical and electrical properties<br />
dur<strong>in</strong>g stiffen<strong>in</strong>g and harden<strong>in</strong>g processes <str<strong>on</strong>g>of</str<strong>on</strong>g> cementitious materials.<br />
However, the microstructural development and fluid-to-solid<br />
transiti<strong>on</strong>, or the solidificati<strong>on</strong> process, will be better described by<br />
methods that measure mechanical properties <str<strong>on</strong>g>of</str<strong>on</strong>g> cementitious<br />
materials.<br />
Ultras<strong>on</strong>ic <strong>wave</strong>s have been widely used to characterize and<br />
evaluate hardened c<strong>on</strong>crete based <strong>on</strong> the relati<strong>on</strong>ship between <strong>wave</strong><br />
velocity and the mechanical properties (Young's modulus) <str<strong>on</strong>g>of</str<strong>on</strong>g> elastic<br />
solids. S<strong>in</strong>ce 1980s, research us<strong>in</strong>g ultras<strong>on</strong>ic <strong>wave</strong>s to <strong>in</strong>vestigate<br />
<strong>early</strong> <strong>age</strong> properties <str<strong>on</strong>g>of</str<strong>on</strong>g> cement pastes and c<strong>on</strong>crete has grown rapidly.<br />
Elastic and viscoelastic properties <str<strong>on</strong>g>of</str<strong>on</strong>g> cementitious materials can be<br />
obta<strong>in</strong>ed from ultras<strong>on</strong>ic <strong>wave</strong> velocity [3–6,11–13], attenuati<strong>on</strong> [4]<br />
or reflecti<strong>on</strong> [9] measurements.<br />
In 1980s, Keat<strong>in</strong>g et al. [6] <strong>in</strong>vestigated ultras<strong>on</strong>ic l<strong>on</strong>gitud<strong>in</strong>al<br />
(P) <strong>wave</strong> propagati<strong>on</strong> <strong>in</strong> fresh cement pastes. They showed that at<br />
very <strong>early</strong> <strong>age</strong>, the P <strong>wave</strong> velocity V P is governed by the fluid phase<br />
before the solid phase becomes <strong>in</strong>terc<strong>on</strong>nected. They also found<br />
that presence <str<strong>on</strong>g>of</str<strong>on</strong>g> <str<strong>on</strong>g>air</str<strong>on</strong>g> bubbles str<strong>on</strong>gly <strong>in</strong>fluences the P <strong>wave</strong> velocity<br />
and attenuati<strong>on</strong>. Sayers and Dahl<strong>in</strong> [12] c<strong>on</strong>firmed the f<strong>in</strong>d<strong>in</strong>gs by<br />
⁎ Corresp<strong>on</strong>d<strong>in</strong>g author.<br />
E-mail address: jyzhu@mail.utexas.edu (J. Zhu).<br />
0008-8846/$ – see fr<strong>on</strong>t matter © 2011 Elsevier Ltd. All rights reserved.<br />
doi:10.1016/j.cemc<strong>on</strong>res.2011.04.005<br />
Cement and C<strong>on</strong>crete Research 41 (2011) 872–881<br />
C<strong>on</strong>tents lists available at ScienceDirect<br />
Cement and C<strong>on</strong>crete Research<br />
journal homep<strong>age</strong>: http://ees.elsevier.com/CEMCON/default.asp<br />
The objective <str<strong>on</strong>g>of</str<strong>on</strong>g> this paper is to <strong>in</strong>vestigate effects <str<strong>on</strong>g>of</str<strong>on</strong>g> <str<strong>on</strong>g>air</str<strong>on</strong>g> <str<strong>on</strong>g>voids</str<strong>on</strong>g> <strong>on</strong> ultras<strong>on</strong>ic <strong>wave</strong> propagati<strong>on</strong> <strong>in</strong> fresh cement<br />
pastes, and relate ultras<strong>on</strong>ic <strong>wave</strong> parameters to cement sett<strong>in</strong>g times. First, Biot's theory was used to analyze<br />
<strong>wave</strong> propagati<strong>on</strong> <strong>in</strong> poroelastic media c<strong>on</strong>ta<strong>in</strong><strong>in</strong>g <str<strong>on</strong>g>air</str<strong>on</strong>g> bubbles. Then, <strong>in</strong> the experimental study, both the<br />
compressi<strong>on</strong>al (P) and shear (S) <strong>wave</strong>s were m<strong>on</strong>itored <strong>in</strong> cement pastes with different water/cement ratios<br />
(w/c =0.4 and 0.5) and various <str<strong>on</strong>g>air</str<strong>on</strong>g> void c<strong>on</strong>tent (0.1%–5.3% by cement paste volume). Experimental results<br />
<strong>in</strong>dicated that existence <str<strong>on</strong>g>of</str<strong>on</strong>g> <str<strong>on</strong>g>air</str<strong>on</strong>g> bubbles <strong>in</strong> cement paste significantly decreases the P <strong>wave</strong> velocity, but has<br />
little effect <strong>on</strong> the shear <strong>wave</strong> propagati<strong>on</strong>. Further analysis shows that the shear <strong>wave</strong> velocity corresp<strong>on</strong>d<strong>in</strong>g<br />
to the Vicat <strong>in</strong>itial sett<strong>in</strong>g times is a relatively c<strong>on</strong>stant value for the <strong>in</strong>vestigated <str<strong>on</strong>g>air</str<strong>on</strong>g> c<strong>on</strong>tent range. This study<br />
shows the potential <str<strong>on</strong>g>of</str<strong>on</strong>g> us<strong>in</strong>g shear <strong>wave</strong>s to m<strong>on</strong>itor sett<strong>in</strong>g and harden<strong>in</strong>g process <str<strong>on</strong>g>of</str<strong>on</strong>g> cement.<br />
© 2011 Elsevier Ltd. All rights reserved.<br />
compar<strong>in</strong>g ultras<strong>on</strong>ic <strong>wave</strong> signals <strong>in</strong> de-<str<strong>on</strong>g>air</str<strong>on</strong>g>ed and as-mixed cement<br />
pastes, and used Biot's theory to analyze <strong>wave</strong> propagati<strong>on</strong> <strong>in</strong><br />
saturated porous media. S<strong>in</strong>ce then, many studies have been<br />
focused <strong>on</strong> correlat<strong>in</strong>g the P <strong>wave</strong> velocity VP and the Vicat <strong>in</strong>itial<br />
sett<strong>in</strong>g time [7,13–17]. Researchers have developed different<br />
methods to identify <strong>in</strong>itial sett<strong>in</strong>g time <str<strong>on</strong>g>of</str<strong>on</strong>g> cementitious materials<br />
based <strong>on</strong> certa<strong>in</strong> features <strong>on</strong> the ultras<strong>on</strong>ic velocity curves. Those<br />
features <strong>in</strong>clude the po<strong>in</strong>t where VP starts to <strong>in</strong>crease [7,11,13], the<br />
<strong>in</strong>flecti<strong>on</strong> po<strong>in</strong>t <strong>on</strong> velocity curve [17], or when V P reaches the<br />
velocity <strong>in</strong> water [18]. To elim<strong>in</strong>ate <strong>in</strong>fluence <str<strong>on</strong>g>of</str<strong>on</strong>g> <str<strong>on</strong>g>air</str<strong>on</strong>g> <str<strong>on</strong>g>voids</str<strong>on</strong>g>, some<br />
researchers used de-<str<strong>on</strong>g>air</str<strong>on</strong>g>ed cement samples, and def<strong>in</strong>ed the sett<strong>in</strong>g<br />
po<strong>in</strong>t as the time when velocity starts to <strong>in</strong>crease <strong>in</strong> de-<str<strong>on</strong>g>air</str<strong>on</strong>g>ed<br />
samples [6,8,12,19]. However c<strong>on</strong>tradictory c<strong>on</strong>clusi<strong>on</strong>s <str<strong>on</strong>g>of</str<strong>on</strong>g>ten result<br />
s<strong>in</strong>ce some methods give very different sett<strong>in</strong>g time. It is still<br />
unclear how to determ<strong>in</strong>e the sett<strong>in</strong>g time based <strong>on</strong> P <strong>wave</strong> velocity<br />
measurement.<br />
Although ultras<strong>on</strong>ic measurements obta<strong>in</strong>ed from de-<str<strong>on</strong>g>air</str<strong>on</strong>g>ed cement<br />
samples show good correlati<strong>on</strong> between P <strong>wave</strong> velocity and the<br />
sett<strong>in</strong>g time, us<strong>in</strong>g de-<str<strong>on</strong>g>air</str<strong>on</strong>g>ed sample is unrealistic <strong>in</strong> field test<strong>in</strong>g. On<br />
the other hand, quantitative study about effects <str<strong>on</strong>g>of</str<strong>on</strong>g> <str<strong>on</strong>g>air</str<strong>on</strong>g> <str<strong>on</strong>g>voids</str<strong>on</strong>g> <strong>on</strong><br />
ultras<strong>on</strong>ic <strong>wave</strong>s has been very limited. Recently, Kmack [20]<br />
experimentally <strong>in</strong>vestigated the effects <str<strong>on</strong>g>of</str<strong>on</strong>g> <str<strong>on</strong>g>air</str<strong>on</strong>g> <str<strong>on</strong>g>voids</str<strong>on</strong>g> <strong>on</strong> ultras<strong>on</strong>ic P<br />
<strong>wave</strong> propagati<strong>on</strong> <strong>in</strong> fresh cement pastes by <strong>in</strong>troduc<strong>in</strong>g various<br />
amount <str<strong>on</strong>g>of</str<strong>on</strong>g> <str<strong>on</strong>g>air</str<strong>on</strong>g>-entra<strong>in</strong><strong>in</strong>g <strong>age</strong>nt (AEA), 0–0.6% by weigh <str<strong>on</strong>g>of</str<strong>on</strong>g> cement.<br />
Kmack found that ultras<strong>on</strong>ic <strong>wave</strong>s <strong>in</strong> <str<strong>on</strong>g>air</str<strong>on</strong>g>-entra<strong>in</strong>ed specimens<br />
showed significantly lower <strong>wave</strong> velocity and signal amplitude at<br />
<strong>early</strong> <strong>age</strong>s than the n<strong>on</strong>-<str<strong>on</strong>g>air</str<strong>on</strong>g>-entra<strong>in</strong>ed specimens.<br />
Shear <strong>wave</strong>s have also been exam<strong>in</strong>ed for m<strong>on</strong>itor<strong>in</strong>g sett<strong>in</strong>g and<br />
harden<strong>in</strong>g <str<strong>on</strong>g>of</str<strong>on</strong>g> fresh cement pastes. Because shear <strong>wave</strong>s have very<br />
low velocity and high attenuati<strong>on</strong> <strong>in</strong> fluid cement paste, with the<br />
transmissi<strong>on</strong> setup, shear <strong>wave</strong>s could <strong>on</strong>ly be detected a few hours<br />
after mix<strong>in</strong>g. D'Angelo et al. [5] showed that shear <strong>wave</strong>s are more
sensitive to solid structure development than P <strong>wave</strong>s, and the<br />
<strong>on</strong>set <str<strong>on</strong>g>of</str<strong>on</strong>g> shear <strong>wave</strong>s is related to the cement thicken<strong>in</strong>g time.<br />
Thicken<strong>in</strong>g time is used <strong>in</strong> oilfield <strong>in</strong>dustry to describe the durati<strong>on</strong><br />
that a cement slurry rema<strong>in</strong>s <strong>in</strong> a fluid state and is capable <str<strong>on</strong>g>of</str<strong>on</strong>g> be<strong>in</strong>g<br />
pumped. It was also found that the development <str<strong>on</strong>g>of</str<strong>on</strong>g> shear <strong>wave</strong><br />
energy is correlated with the volume fracti<strong>on</strong> <str<strong>on</strong>g>of</str<strong>on</strong>g> c<strong>on</strong>nected solids <strong>in</strong><br />
cement paste [21]. However the <strong>on</strong>set <str<strong>on</strong>g>of</str<strong>on</strong>g> S <strong>wave</strong>s is affected by the<br />
sensitivity <str<strong>on</strong>g>of</str<strong>on</strong>g> equipment. Chang<strong>in</strong>g driv<strong>in</strong>g volt<strong>age</strong>, receiver ga<strong>in</strong> or<br />
specimen size could affect the <strong>on</strong>set time <str<strong>on</strong>g>of</str<strong>on</strong>g> shear <strong>wave</strong>s. Boumiz et<br />
al. [4] also believed that the <strong>on</strong>set <str<strong>on</strong>g>of</str<strong>on</strong>g> shear <strong>wave</strong>s <strong>in</strong>dicates<br />
percolati<strong>on</strong> threshold. The shear <strong>wave</strong> velocity VS and attenuati<strong>on</strong><br />
αS(f) provide important <strong>in</strong>formati<strong>on</strong> about the solid frame modulus<br />
and viscosity <str<strong>on</strong>g>of</str<strong>on</strong>g> cement pastes [4]. In most <str<strong>on</strong>g>of</str<strong>on</strong>g> studies us<strong>in</strong>g the<br />
transmissi<strong>on</strong> setup, shear <strong>wave</strong>s were usually not observed until<br />
<strong>in</strong>itial sett<strong>in</strong>g. To overcome this difficulty, the shear <strong>wave</strong> reflecti<strong>on</strong><br />
method was proposed to m<strong>on</strong>itor acoustic impedance change <str<strong>on</strong>g>of</str<strong>on</strong>g><br />
cement paste at <strong>early</strong> <strong>age</strong>s, which relies <strong>on</strong> the solid microstructural<br />
development dur<strong>in</strong>g sett<strong>in</strong>g and harden<strong>in</strong>g [9,10,16,17,22]. The<br />
shear <strong>wave</strong> reflecti<strong>on</strong> method needs access to <strong>on</strong>e test surface <strong>on</strong>ly,<br />
which makes it attractive for field test<strong>in</strong>g. However, this setup<br />
measures the material properties <strong>on</strong> the surface <strong>on</strong>ly, which can be<br />
problematic because the surface <str<strong>on</strong>g>of</str<strong>on</strong>g> c<strong>on</strong>crete typically has a higher<br />
porosity than the <strong>in</strong>terior <str<strong>on</strong>g>of</str<strong>on</strong>g> c<strong>on</strong>crete. Furthermore, the surface may<br />
set at a different time than the <strong>in</strong>terior c<strong>on</strong>crete. It has also been<br />
found that the property <str<strong>on</strong>g>of</str<strong>on</strong>g> the buffer material affects the sett<strong>in</strong>g<br />
time measurement [23].<br />
In this study, the effects <str<strong>on</strong>g>of</str<strong>on</strong>g> <str<strong>on</strong>g>air</str<strong>on</strong>g> <str<strong>on</strong>g>voids</str<strong>on</strong>g> <strong>on</strong> ultras<strong>on</strong>ic <strong>wave</strong> velocity<br />
were <strong>in</strong>vestigated based <strong>on</strong> Biot's theory for poroelastic materials.<br />
In the experimental study, both the compressi<strong>on</strong>al and shear <strong>wave</strong>s<br />
were m<strong>on</strong>itored <strong>in</strong> cement pastes with two water/cement ratios<br />
(w/c =0.4 and 0.5) and different <str<strong>on</strong>g>air</str<strong>on</strong>g> c<strong>on</strong>tents (0.1%–5.3%). The <str<strong>on</strong>g>air</str<strong>on</strong>g><br />
<str<strong>on</strong>g>voids</str<strong>on</strong>g> were <strong>in</strong>troduced by us<strong>in</strong>g <str<strong>on</strong>g>air</str<strong>on</strong>g> entra<strong>in</strong><strong>in</strong>g admixtures (0, 0.01,<br />
0.05, and 0.2% <str<strong>on</strong>g>of</str<strong>on</strong>g> cement weight). Experimental results <strong>in</strong>dicated<br />
that existence <str<strong>on</strong>g>of</str<strong>on</strong>g> <str<strong>on</strong>g>air</str<strong>on</strong>g> <str<strong>on</strong>g>voids</str<strong>on</strong>g> <strong>in</strong> cement paste str<strong>on</strong>gly affects the P<br />
<strong>wave</strong> velocity, but has little effect <strong>on</strong> the shear <strong>wave</strong> propagati<strong>on</strong>.<br />
2. Theory<br />
2.1. Biot's theory<br />
Although cement paste is usually regarded as a suspensi<strong>on</strong> at<br />
very beg<strong>in</strong>n<strong>in</strong>g <str<strong>on</strong>g>of</str<strong>on</strong>g> the hydrati<strong>on</strong>, Harker and Temple have shown<br />
that a dense suspensi<strong>on</strong> with a large volume fracti<strong>on</strong> <str<strong>on</strong>g>of</str<strong>on</strong>g> solid<br />
particles should be treated as a porous elastic material saturated<br />
with viscous fluid [24]. The propagati<strong>on</strong> <str<strong>on</strong>g>of</str<strong>on</strong>g> elastic <strong>wave</strong>s <strong>in</strong> a porous<br />
elastic solid saturated with a compressible viscous fluid has been<br />
treated by Biot [25,26]. Animportantf<strong>in</strong>d<strong>in</strong>g <str<strong>on</strong>g>of</str<strong>on</strong>g> Biot theory is that<br />
two compressi<strong>on</strong>al <strong>wave</strong>s (the fast and slow P <strong>wave</strong>s) and <strong>on</strong>e shear<br />
<strong>wave</strong> propagate <strong>in</strong> a fluid saturated porous solid. The fast <strong>wave</strong><br />
exists <strong>in</strong> all frequency ranges, while the slow <strong>wave</strong> <strong>on</strong>ly exists <strong>in</strong><br />
high frequency range. The critical frequency separat<strong>in</strong>g low and<br />
high frequency ranges depends <strong>on</strong> the fluid viscosity and pore size.<br />
At high frequencies, the effect <str<strong>on</strong>g>of</str<strong>on</strong>g> fluid viscosity is c<strong>on</strong>f<strong>in</strong>ed to a th<strong>in</strong><br />
boundary layer near the solid/fluid <strong>in</strong>terface [12], andtheviscous<br />
sk<strong>in</strong> depth δ = ffiffiffiffiffiffiffiffiffi p<br />
η=ρ f ω is much smaller than the pore size. Here η<br />
is the viscosity <str<strong>on</strong>g>of</str<strong>on</strong>g> the pore fluid, ρf is the density <str<strong>on</strong>g>of</str<strong>on</strong>g> fluid, and ω is the<br />
angular frequency <str<strong>on</strong>g>of</str<strong>on</strong>g> <strong>wave</strong>. Sayer et al. [8,12] have shown that the<br />
high frequency Biot's theory applies to cement pastes at <strong>early</strong> <strong>age</strong>s<br />
s<strong>in</strong>ce the pore size is large and viscosity <str<strong>on</strong>g>of</str<strong>on</strong>g> the fluid is low, while the<br />
low frequency Biot's theory applies to cement pastes at later <strong>age</strong>s. In<br />
de-<str<strong>on</strong>g>air</str<strong>on</strong>g>ed cement pastes with weak solid frames, they reported that<br />
<strong>on</strong>ly the fast P <strong>wave</strong> was observed, which has a c<strong>on</strong>stant velocity<br />
(close to the water velocity) before sett<strong>in</strong>g. This result <strong>in</strong>dicates that<br />
the fast P <strong>wave</strong> ma<strong>in</strong>ly propagates through the fluid phase;<br />
therefore it does not provide much useful <strong>in</strong>formati<strong>on</strong> about the<br />
solid microstructure before <strong>in</strong>itial sett<strong>in</strong>g.<br />
J. Zhu et al. / Cement and C<strong>on</strong>crete Research 41 (2011) 872–881<br />
In a weak frame medium and at high frequency limit, the fast and<br />
slow P <strong>wave</strong> velocities V P1 and V P2, and shear <strong>wave</strong> velocity V S are<br />
given by [27]<br />
V 2<br />
P1;2 = ΔF<br />
ffiffiffiffiffiffiffiffiffiffiffiffiffiffiffiffiffiffiffiffiffiffiffiffiffiffiffiffiffiffiffiffiffiffiffiffiffiffiffiffiffiffiffiffiffiffiffiffiffiffiffiffiffiffiffiffiffiffiffiffiffiffiffi<br />
Δ2−4 ρ11ρ22−ρ2 q<br />
12<br />
2 ρ11ρ22−ρ 2 PR−Q 2 12<br />
; ð1Þ<br />
V 2<br />
S =<br />
G<br />
; ð2Þ<br />
ð1−ϕÞρs + ð1−1 = αÞϕρf<br />
where P, Q, and R are generalized elastic coefficients and are given as<br />
[12,27]<br />
P = 1−ϕ ð Þ 1−ϕ−K = K ð sÞKs<br />
+ ϕKsK = Kf 1−ϕ−K = Ks + ϕKs = Kf Q =<br />
+ 4<br />
G; ð3Þ<br />
3<br />
ð1−ϕ−K = KsÞϕKs ; ð4Þ<br />
1−ϕ−K = Ks + ϕKs = Kf ϕ<br />
R =<br />
2 Ks ; ð5Þ<br />
1−ϕ−K = Ks + ϕKs = Kf and<br />
Δ = Pρ 22 + Rρ 11−2Qρ 12⋅ ð6Þ<br />
In these equati<strong>on</strong>s, Kf, Ks and K are the bulk moduli <str<strong>on</strong>g>of</str<strong>on</strong>g> the fluid,<br />
solid and frame. ϕ is the porosity, which is equals to the fluid volume<br />
fracti<strong>on</strong>. The density terms ρij are related to the solid density ρs and<br />
fluid density ρ f by [12]<br />
ρ11 + ρ22 = ð1−ϕÞρs; ð7Þ<br />
ρ 22 + ρ 12 = ϕρ f ; ð8Þ<br />
ρ12 = −ðα−1Þϕρf ⋅ ð9Þ<br />
Where α is the tortuosity and given as α=(1+ϕ − 1 )/2.<br />
Fig. 1 shows the variati<strong>on</strong> <str<strong>on</strong>g>of</str<strong>on</strong>g> V P1 and V S as functi<strong>on</strong>s <str<strong>on</strong>g>of</str<strong>on</strong>g> shear<br />
modulus G <str<strong>on</strong>g>of</str<strong>on</strong>g> the solid frame, based <strong>on</strong> the equati<strong>on</strong>s shown above.<br />
For a cement pate with w/c=0.4 and cement density <str<strong>on</strong>g>of</str<strong>on</strong>g> ρs=3180kg/<br />
m 3 , the porosity is calculated as ϕ=0.56, and α=1.39. Other<br />
material parameters are chosen based <strong>on</strong> Ref. [12], and they are<br />
Fig. 1. Theoretical analysis <str<strong>on</strong>g>of</str<strong>on</strong>g> <strong>wave</strong> velocity variati<strong>on</strong> with the solid frame shear<br />
modulus G <strong>in</strong> cement pastes with different <str<strong>on</strong>g>air</str<strong>on</strong>g> void c<strong>on</strong>tents (percent<strong>age</strong> <str<strong>on</strong>g>of</str<strong>on</strong>g> the fluid<br />
phase).<br />
873
874 J. Zhu et al. / Cement and C<strong>on</strong>crete Research 41 (2011) 872–881<br />
Poiss<strong>on</strong>'s ratio <str<strong>on</strong>g>of</str<strong>on</strong>g> the frame υ =0.2, and the bulk modulus <str<strong>on</strong>g>of</str<strong>on</strong>g> the solid<br />
and fluid phases Ks=50GPa, and Kf=2.2GPa. The calculati<strong>on</strong> based<br />
<strong>on</strong> Biot's theory shows that the fast P <strong>wave</strong> velocity VP1 is close to the<br />
velocity <strong>in</strong> water (1500 m/s) when the solid frame is weak (K and G<br />
are small); while <strong>in</strong> the stiff frame limit, VP1 <strong>in</strong>creases with the frame<br />
modulus G. This result agrees with experimental observati<strong>on</strong>s<br />
obta<strong>in</strong>ed <strong>in</strong> a de-<str<strong>on</strong>g>air</str<strong>on</strong>g>ed cement paste. Based <strong>on</strong> this analysis, at <strong>early</strong><br />
<strong>age</strong>s, the fast <strong>wave</strong> should ma<strong>in</strong>ly <strong>in</strong>volve moti<strong>on</strong> <str<strong>on</strong>g>of</str<strong>on</strong>g> the fluid phase <str<strong>on</strong>g>of</str<strong>on</strong>g><br />
cement paste; but at late <strong>age</strong>s, it should <strong>in</strong>volve moti<strong>on</strong> <str<strong>on</strong>g>of</str<strong>on</strong>g> the solid<br />
frame <str<strong>on</strong>g>of</str<strong>on</strong>g> cement paste. Fig.<br />
p<br />
1<br />
ffiffiffi<br />
also shows that the shear <strong>wave</strong> velocity<br />
VS is a l<strong>in</strong>ear functi<strong>on</strong> <str<strong>on</strong>g>of</str<strong>on</strong>g> G,<br />
which <strong>in</strong>dicates that the shear <strong>wave</strong><br />
should <strong>in</strong>volve moti<strong>on</strong> <str<strong>on</strong>g>of</str<strong>on</strong>g> the solid frame <strong>on</strong>ly. S<strong>in</strong>ce <strong>on</strong>ly the fast<br />
P <strong>wave</strong> is usually measured, we simply use VP to denote the fast<br />
P <strong>wave</strong> velocity thereafter <strong>in</strong> the paper.<br />
2.2. <str<strong>on</strong>g>Effects</str<strong>on</strong>g> <str<strong>on</strong>g>of</str<strong>on</strong>g> <str<strong>on</strong>g>air</str<strong>on</strong>g> <str<strong>on</strong>g>voids</str<strong>on</strong>g> <strong>in</strong> the fluid phase<br />
Follow<strong>in</strong>g Keat<strong>in</strong>g's study [6], many researchers used de-<str<strong>on</strong>g>air</str<strong>on</strong>g>ed<br />
cement pastes to study ultras<strong>on</strong>ic <strong>wave</strong>s <strong>in</strong> <strong>early</strong> <strong>age</strong> cement pastes, and<br />
reached the c<strong>on</strong>clusi<strong>on</strong> that “dur<strong>in</strong>g the suspensi<strong>on</strong> period, ultras<strong>on</strong>ic<br />
velocity is not very sensitive to the growth <str<strong>on</strong>g>of</str<strong>on</strong>g> structure <strong>in</strong> the paste” [19,28].<br />
However, when a small amount <str<strong>on</strong>g>of</str<strong>on</strong>g> <str<strong>on</strong>g>air</str<strong>on</strong>g> bubbles, even less than 1%, were<br />
<strong>in</strong>cluded <strong>in</strong> the cement paste, the P <strong>wave</strong> velocity will decrease<br />
dramatically, as observed by many researchers [6,13].Inthiscase,theP<br />
<strong>wave</strong> velocity V P depends <strong>on</strong> the moduli <str<strong>on</strong>g>of</str<strong>on</strong>g> both the bubbly fluid and the<br />
solid frame, <strong>in</strong>stead <str<strong>on</strong>g>of</str<strong>on</strong>g> the fluid phase <strong>on</strong>ly as <strong>in</strong> the de-<str<strong>on</strong>g>air</str<strong>on</strong>g>ed case.<br />
Therefore, V P will <strong>in</strong>crease with the hydrati<strong>on</strong> process, and give<br />
<strong>in</strong>formati<strong>on</strong> about the microstructural development <str<strong>on</strong>g>of</str<strong>on</strong>g> cement paste.<br />
When a small amount <str<strong>on</strong>g>of</str<strong>on</strong>g> <str<strong>on</strong>g>air</str<strong>on</strong>g> bubbles present <strong>in</strong> cement paste, the<br />
bulk modulus <str<strong>on</strong>g>of</str<strong>on</strong>g> the fluid phase Kf should be modified to <strong>in</strong>clude the<br />
effect <str<strong>on</strong>g>of</str<strong>on</strong>g> <str<strong>on</strong>g>air</str<strong>on</strong>g>. Denote the bulk modulus <str<strong>on</strong>g>of</str<strong>on</strong>g> <str<strong>on</strong>g>air</str<strong>on</strong>g> as K a,andthedegree<str<strong>on</strong>g>of</str<strong>on</strong>g><br />
saturati<strong>on</strong> as S, then the volumetric percent<strong>age</strong> <str<strong>on</strong>g>of</str<strong>on</strong>g> <str<strong>on</strong>g>air</str<strong>on</strong>g> bubbles <strong>in</strong> the fluid<br />
phase is 1.0−S. The modified bulk modulus <str<strong>on</strong>g>of</str<strong>on</strong>g> the fluid phase is given as<br />
1<br />
K fa<br />
= S<br />
K f<br />
+ 1−S<br />
: ð10Þ<br />
Ka For example, for fluid with 0.1% <str<strong>on</strong>g>of</str<strong>on</strong>g> <str<strong>on</strong>g>air</str<strong>on</strong>g> <str<strong>on</strong>g>voids</str<strong>on</strong>g> (S=0.999), us<strong>in</strong>g<br />
Ka=1.4×10 5 Pa, the fluid modulus Kfa will decrease to 4.4% <str<strong>on</strong>g>of</str<strong>on</strong>g> the<br />
orig<strong>in</strong>al value <str<strong>on</strong>g>of</str<strong>on</strong>g> Kf based <strong>on</strong> a calculati<strong>on</strong> us<strong>in</strong>g Eq. (10). The<br />
corresp<strong>on</strong>d<strong>in</strong>g velocity <strong>in</strong> water with <str<strong>on</strong>g>air</str<strong>on</strong>g> bubbles will drop to 311 m/s<br />
from 1500 m/s <strong>in</strong> water without <str<strong>on</strong>g>air</str<strong>on</strong>g>. Replac<strong>in</strong>g Kf with Kfa <strong>in</strong> Eq. (1),<br />
the P <strong>wave</strong> velocity <strong>in</strong> cement paste c<strong>on</strong>ta<strong>in</strong><strong>in</strong>g <str<strong>on</strong>g>air</str<strong>on</strong>g> bubbles can be<br />
calculated. Fig. 1 shows the variati<strong>on</strong> <str<strong>on</strong>g>of</str<strong>on</strong>g> VP and Vs with solid frame<br />
shear modulus G, for different <str<strong>on</strong>g>air</str<strong>on</strong>g> c<strong>on</strong>tents (percent<strong>age</strong> <str<strong>on</strong>g>of</str<strong>on</strong>g> the fluid<br />
phase). It can be seen that the P <strong>wave</strong> velocity drops dramatically<br />
when <str<strong>on</strong>g>air</str<strong>on</strong>g> bubbles present <strong>in</strong> the fluid phase. When the <str<strong>on</strong>g>air</str<strong>on</strong>g> c<strong>on</strong>tent<br />
<strong>in</strong>creases from 0 to 0.01%, 0.1% and 5% (corresp<strong>on</strong>d<strong>in</strong>g to cement paste<br />
<str<strong>on</strong>g>air</str<strong>on</strong>g> c<strong>on</strong>tent 0%, 0.0056%, 0.056% and 2.8%), the P <strong>wave</strong> velocities <strong>in</strong><br />
very weak frame media become 1500, 843, 316 and 46 m/s. The P<br />
<strong>wave</strong> velocity can be lower than the velocity <strong>in</strong> <str<strong>on</strong>g>air</str<strong>on</strong>g> (340 m/s) when <str<strong>on</strong>g>air</str<strong>on</strong>g><br />
c<strong>on</strong>tent <strong>in</strong> fluid is larger than 1%. The analysis also shows that the<br />
trend <str<strong>on</strong>g>of</str<strong>on</strong>g> velocity drop with <str<strong>on</strong>g>air</str<strong>on</strong>g> c<strong>on</strong>tent is not l<strong>in</strong>ear. VP is very sensitive<br />
to small amount <str<strong>on</strong>g>of</str<strong>on</strong>g> <str<strong>on</strong>g>air</str<strong>on</strong>g> bubbles <strong>in</strong> fluid, but becomes <strong>in</strong>sensitive when<br />
<str<strong>on</strong>g>air</str<strong>on</strong>g> c<strong>on</strong>tent is larger than 5%. These phenomena have also been<br />
observed <strong>in</strong> experiments by the authors and other researchers [20].<br />
The analysis result <strong>in</strong> Fig.<br />
p ffiffiffi<br />
1 also shows that the shear <strong>wave</strong> velocity is<br />
still a l<strong>in</strong>ear functi<strong>on</strong> <str<strong>on</strong>g>of</str<strong>on</strong>g> G,<br />
and should not be affected by presence <str<strong>on</strong>g>of</str<strong>on</strong>g><br />
<str<strong>on</strong>g>air</str<strong>on</strong>g> <str<strong>on</strong>g>voids</str<strong>on</strong>g>.<br />
3. Experimental study<br />
3.1. Materials and sample preparati<strong>on</strong><br />
The cement used <strong>in</strong> this <strong>in</strong>vestigati<strong>on</strong> was Type I/II ord<strong>in</strong>ary<br />
Portland cement with a Bla<strong>in</strong>e f<strong>in</strong>eness <str<strong>on</strong>g>of</str<strong>on</strong>g> 382 m 2 /kg and chemical<br />
compositi<strong>on</strong> <str<strong>on</strong>g>of</str<strong>on</strong>g> 21% SiO2, 5%Al2O3, 3.1% Fe2O3, 1.1% MgO, 2.9% SO3,<br />
and 2.9% LOI.<br />
Ten cement paste mixtures were prepared accord<strong>in</strong>g to the<br />
proporti<strong>on</strong>s shown <strong>in</strong> Table 1. The mixture compositi<strong>on</strong>s were<br />
selected to span a wide variety <str<strong>on</strong>g>of</str<strong>on</strong>g> <str<strong>on</strong>g>air</str<strong>on</strong>g> c<strong>on</strong>tents and two water/cement<br />
ratios (0.4 and 0.5). For each water/cement ratio, five mixtures with<br />
different <str<strong>on</strong>g>air</str<strong>on</strong>g> c<strong>on</strong>tents were prepared. Air <str<strong>on</strong>g>voids</str<strong>on</strong>g> were <strong>in</strong>troduced <strong>in</strong>to<br />
the pastes by us<strong>in</strong>g <str<strong>on</strong>g>air</str<strong>on</strong>g> entra<strong>in</strong><strong>in</strong>g <strong>age</strong>nt (AEA) with four different<br />
doses (0, 0.01, 0.05, and 0.2% by cement weight). The <str<strong>on</strong>g>air</str<strong>on</strong>g> entra<strong>in</strong><strong>in</strong>g<br />
<strong>age</strong>nt (Sika <str<strong>on</strong>g>air</str<strong>on</strong>g>) is an aqueous soluti<strong>on</strong> <str<strong>on</strong>g>of</str<strong>on</strong>g> organic materials satisfy<strong>in</strong>g<br />
the requirement <str<strong>on</strong>g>of</str<strong>on</strong>g> ASTM C-260 [29]. One de-<str<strong>on</strong>g>air</str<strong>on</strong>g>ed sample was<br />
prepared by stor<strong>in</strong>g a n<strong>on</strong>-<str<strong>on</strong>g>air</str<strong>on</strong>g>-entra<strong>in</strong>ed mixture <strong>in</strong> a low pressure<br />
chamber for 30 m<strong>in</strong>utes.<br />
3.2. Ultras<strong>on</strong>ic test setup<br />
Fig. 2 illustrates the test setup for m<strong>on</strong>itor<strong>in</strong>g ultras<strong>on</strong>ic <strong>wave</strong><br />
propagati<strong>on</strong> through the cement paste samples. The test setup<br />
<strong>in</strong>cludes a U shape rubber c<strong>on</strong>ta<strong>in</strong>er and a cover, four pieces <str<strong>on</strong>g>of</str<strong>on</strong>g><br />
5 mm thick Plexiglas plates, a p<str<strong>on</strong>g>air</str<strong>on</strong>g> <str<strong>on</strong>g>of</str<strong>on</strong>g> ultras<strong>on</strong>ic transducers, and their<br />
hous<strong>in</strong>g. Two <strong>in</strong>ner Plexiglas plates and the rubber form a c<strong>on</strong>ta<strong>in</strong>er. A<br />
layer <str<strong>on</strong>g>of</str<strong>on</strong>g> s<str<strong>on</strong>g>of</str<strong>on</strong>g>t foam was <strong>in</strong>serted between the plates and the rubber to<br />
avoid direct bypass <str<strong>on</strong>g>of</str<strong>on</strong>g> ultras<strong>on</strong>ic <strong>wave</strong>s through the test setup. A<br />
rubber cover was designed to prevent water evaporati<strong>on</strong> from sample<br />
surface so that dry shr<strong>in</strong>k<strong>age</strong>s can be m<strong>in</strong>imized. A p<str<strong>on</strong>g>air</str<strong>on</strong>g> <str<strong>on</strong>g>of</str<strong>on</strong>g> ultras<strong>on</strong>ic<br />
transducers c<strong>on</strong>tact the outside surface <str<strong>on</strong>g>of</str<strong>on</strong>g> the Plexiglas plates through<br />
ultras<strong>on</strong>ic couplant, as shown <strong>in</strong> Fig. 2. The outer Plexiglas plates are<br />
used to press the transducers to ma<strong>in</strong>ta<strong>in</strong> good coupl<strong>in</strong>g. In this study,<br />
three types <str<strong>on</strong>g>of</str<strong>on</strong>g> ultras<strong>on</strong>ic transducers were used to generate P <strong>wave</strong>s<br />
and S <strong>wave</strong>s at different center frequencies. Panametrics V101<br />
(P <strong>wave</strong>) and V151 (S <strong>wave</strong>) are broad band ultras<strong>on</strong>ic transducers<br />
with nom<strong>in</strong>al center frequency <str<strong>on</strong>g>of</str<strong>on</strong>g> 500 kHz. A Panametrics 5077PR<br />
pulser–receiver was used to drive the 500 kHz transducers. The<br />
5077PR has square <strong>wave</strong> excitati<strong>on</strong> with tunable pulse width and<br />
volt<strong>age</strong>. In this study, the driv<strong>in</strong>g volt<strong>age</strong> was 100 V, with a pulse<br />
width 1 μs to match the 500 kHz transducer. The shear <strong>wave</strong><br />
transducer tests were used to check the accuracy <str<strong>on</strong>g>of</str<strong>on</strong>g> shear <strong>wave</strong><br />
velocity obta<strong>in</strong>ed from the P <strong>wave</strong> transducer tests. The Pundit UPV<br />
transducers are narrow band transducers with center frequency<br />
around 50 kHz. A Pundit 7 ultras<strong>on</strong>ic pulse velocity unit was used to<br />
drive and receive the 50 kHz transducers, with driv<strong>in</strong>g volt<strong>age</strong> <str<strong>on</strong>g>of</str<strong>on</strong>g><br />
1000 V. Setups for these three types <str<strong>on</strong>g>of</str<strong>on</strong>g> transducers were similar, but<br />
with different sample thickness L. The sample thickness for the<br />
500 kHz test setup was 25 mm, and for the 50 kHz test setup was<br />
100 mm. These lengths were chosen to make sure that there is at least<br />
<strong>on</strong>e <strong>wave</strong>length distance between the transducers. In the P <strong>wave</strong><br />
Table 1<br />
Summary <str<strong>on</strong>g>of</str<strong>on</strong>g> mix proporti<strong>on</strong>s, <str<strong>on</strong>g>air</str<strong>on</strong>g> void system parameters and sett<strong>in</strong>g times.<br />
Specimens Transducer<br />
type and<br />
frequency<br />
(kHz)<br />
1 a<br />
Mix proporti<strong>on</strong> Parameters related to<br />
the <str<strong>on</strong>g>air</str<strong>on</strong>g> void system<br />
w/c AEA (% <str<strong>on</strong>g>of</str<strong>on</strong>g><br />
cement)<br />
Time <str<strong>on</strong>g>of</str<strong>on</strong>g> set<br />
A [%] N l [μm] Initial<br />
[h]<br />
F<strong>in</strong>al<br />
[h]<br />
50,500 P 0.4 0 0.09 16 182.3 4.3 5.2<br />
2 50,500 PS b<br />
0 0.21 71 133.3 4.4 5.3<br />
3 50,500 P 0.01 0.79 309 124.3 4.9 5.7<br />
4 50,500 PS b<br />
0.05 1.59 704 117.7 4.6 5.55<br />
5 50,500 P 0.2 2.28 1962 87.2 4.7 5.5<br />
6 a<br />
50,500 P 0.5 0 – – – 5 6.5<br />
7 50,500 PS b<br />
0 0.56 232 124.2 5.2 6.6<br />
8 50,500 P 0.01 1.12 488 118.9 5.6 6.9<br />
9 50,500 PS b<br />
0.05 – – – 5.3 6.75<br />
10 50,500 P 0.2 5.30 2097 127.35 5.4 6.8<br />
c<br />
Cement paste thickness is 25 mm for 500 kHz tests, and 100 mm for 50 kHz tests.<br />
a<br />
De-<str<strong>on</strong>g>air</str<strong>on</strong>g>ed through the vacuum process.<br />
b<br />
500 PS <strong>in</strong>dicates that the mixture was m<strong>on</strong>itored with 500 kHz P <strong>wave</strong> and S <strong>wave</strong><br />
transducers.
tests, petroleum jelly was used as a couplant to ensure good c<strong>on</strong>tact<br />
between transducers and Plexiglas plates throughout the test. In the<br />
shear <strong>wave</strong> tests, high viscosity shear <strong>wave</strong> couplant made by<br />
S<strong>on</strong>otech was used to ensure effective shear <strong>wave</strong> transmissi<strong>on</strong>.<br />
Output signals from the pulser–receiver were digitized by an Nati<strong>on</strong>al<br />
Instruments high speed digitizer. The sampl<strong>in</strong>g frequency was 10 Ms/s<br />
for the 50 kHz transducers, and 20 Ms/s for the 500 kHz transducers.<br />
The number <str<strong>on</strong>g>of</str<strong>on</strong>g> samples was 10,000 for 500 kHz, and 6000 for 50 kHz<br />
transducers, which give signal length <str<strong>on</strong>g>of</str<strong>on</strong>g> 500 μs and 600 μs, respectively.<br />
For each cement paste mixture, the 500 kHz and 50 kHz P <strong>wave</strong><br />
transducer tests were runn<strong>in</strong>g simultaneously.<br />
Because the amplitude <str<strong>on</strong>g>of</str<strong>on</strong>g> ultras<strong>on</strong>ic signals changes by several<br />
orders <str<strong>on</strong>g>of</str<strong>on</strong>g> magnitude dur<strong>in</strong>g the cement hydrati<strong>on</strong> process, vertical<br />
ranges <str<strong>on</strong>g>of</str<strong>on</strong>g> the digitizers were programmed to automatically adjust to<br />
the amplitude <str<strong>on</strong>g>of</str<strong>on</strong>g> received signals. This can ensure best vertical<br />
resoluti<strong>on</strong> <str<strong>on</strong>g>of</str<strong>on</strong>g> signals throughout cement hydrati<strong>on</strong> process from<br />
suspensi<strong>on</strong> state (low energy transmissi<strong>on</strong>) to solid state (much<br />
higher energy transmissi<strong>on</strong>). Furthermore, to <strong>in</strong>crease the signal to<br />
noise ratio, 150 signals were aver<strong>age</strong>d. The program saved aver<strong>age</strong>d<br />
signals every 5 m<strong>in</strong>utes. The entire process <str<strong>on</strong>g>of</str<strong>on</strong>g> data acquisiti<strong>on</strong> and<br />
record<strong>in</strong>g was automatically c<strong>on</strong>trolled by a Labview® program<br />
developed by the authors. Measurement <str<strong>on</strong>g>of</str<strong>on</strong>g> ultrasound c<strong>on</strong>t<strong>in</strong>ued for<br />
approximately 20 hours after mix<strong>in</strong>g cement pastes.<br />
3.3. Vicat-needle test<br />
Al<strong>on</strong>g with ultras<strong>on</strong>ic tests, the Vicat-needle tests were carried out<br />
<strong>in</strong> accordance with ASTM C191 [1] to measure the sett<strong>in</strong>g time <str<strong>on</strong>g>of</str<strong>on</strong>g> the<br />
specimens. The cement paste specimen was kept <strong>in</strong> a sealed c<strong>on</strong>ta<strong>in</strong>er<br />
with relative humidity c<strong>on</strong>sistently ma<strong>in</strong>ta<strong>in</strong>ed higher than 50%<br />
except<strong>in</strong>g dur<strong>in</strong>g test. Test results are shown <strong>in</strong> Table 1.<br />
3.4. Characterizati<strong>on</strong> <str<strong>on</strong>g>of</str<strong>on</strong>g> the <str<strong>on</strong>g>air</str<strong>on</strong>g> void system<br />
Air c<strong>on</strong>tents were measured <strong>on</strong> hardened cement pastes after the<br />
ultras<strong>on</strong>ic m<strong>on</strong>itor<strong>in</strong>g. The l<strong>in</strong>ear transverse method described <strong>in</strong><br />
ASTM C457 [30] was used <strong>in</strong> c<strong>on</strong>juncti<strong>on</strong> with a digital im<strong>age</strong><br />
process<strong>in</strong>g technique to determ<strong>in</strong>e characteristics <str<strong>on</strong>g>of</str<strong>on</strong>g> the <str<strong>on</strong>g>air</str<strong>on</strong>g>-void<br />
system. Secti<strong>on</strong>s <str<strong>on</strong>g>of</str<strong>on</strong>g> samples were obta<strong>in</strong>ed by saw<strong>in</strong>g the hardened<br />
cement paste specimens al<strong>on</strong>g the plane parallel to the ultras<strong>on</strong>ic test<br />
surfaces. The secti<strong>on</strong> surfaces were carefully prepared accord<strong>in</strong>g to<br />
ASTM C457 [30]. The sample secti<strong>on</strong> was polished and dyed us<strong>in</strong>g<br />
water-based black <strong>in</strong>k. After the secti<strong>on</strong> was completely dry, pores <str<strong>on</strong>g>of</str<strong>on</strong>g><br />
the <str<strong>on</strong>g>air</str<strong>on</strong>g> void were then filled with white powder (calcium carb<strong>on</strong>ate<br />
power) to improve c<strong>on</strong>trast between the <str<strong>on</strong>g>voids</str<strong>on</strong>g> and paste. F<strong>in</strong>ally, the<br />
sample secti<strong>on</strong> was digitized us<strong>in</strong>g a digital scanner for further im<strong>age</strong><br />
process<strong>in</strong>g. One im<strong>age</strong> was obta<strong>in</strong>ed for each specimen. The<br />
resoluti<strong>on</strong> <str<strong>on</strong>g>of</str<strong>on</strong>g> digital im<strong>age</strong>s is 1200 dpi, i.e., <strong>on</strong>e pixel represents<br />
about a 20×20μm square.<br />
J. Zhu et al. / Cement and C<strong>on</strong>crete Research 41 (2011) 872–881<br />
Pulse<br />
generator<br />
(g)<br />
(f)<br />
T R<br />
(d)<br />
(e)<br />
4. Air <str<strong>on</strong>g>voids</str<strong>on</strong>g> and sett<strong>in</strong>g time results<br />
4.1. The <str<strong>on</strong>g>air</str<strong>on</strong>g> void system <str<strong>on</strong>g>of</str<strong>on</strong>g> specimens<br />
Fig. 3 shows black-and-white secti<strong>on</strong> im<strong>age</strong>s <str<strong>on</strong>g>of</str<strong>on</strong>g> cement paste<br />
samples with different w/c and AEA doses. The white regi<strong>on</strong>s <strong>in</strong><br />
im<strong>age</strong>s represent <str<strong>on</strong>g>air</str<strong>on</strong>g> <str<strong>on</strong>g>voids</str<strong>on</strong>g>, and the black regi<strong>on</strong>s are for the porti<strong>on</strong> <str<strong>on</strong>g>of</str<strong>on</strong>g><br />
cement paste. It can be seen that the <str<strong>on</strong>g>air</str<strong>on</strong>g> void c<strong>on</strong>tent <str<strong>on</strong>g>of</str<strong>on</strong>g> cement pastes<br />
varies as a functi<strong>on</strong> <str<strong>on</strong>g>of</str<strong>on</strong>g> the amount <str<strong>on</strong>g>of</str<strong>on</strong>g> AEA and w/c.<br />
Air <str<strong>on</strong>g>voids</str<strong>on</strong>g> <str<strong>on</strong>g>of</str<strong>on</strong>g> cement paste specimens were characterized by several<br />
geometric factors described <strong>in</strong> ASTM C 457 [30]: (i) <str<strong>on</strong>g>air</str<strong>on</strong>g> c<strong>on</strong>tent A,<br />
(ii) paste c<strong>on</strong>tent p, (iii) the number <str<strong>on</strong>g>of</str<strong>on</strong>g> <str<strong>on</strong>g>air</str<strong>on</strong>g>-<str<strong>on</strong>g>voids</str<strong>on</strong>g>, and (iv) aver<strong>age</strong><br />
chord length l . The geometric factors are def<strong>in</strong>ed as follows:<br />
A = A a<br />
A t<br />
p = Ap<br />
At<br />
l = 1<br />
N ∑<br />
N<br />
× 100 ½% Š ð11Þ<br />
× 100 ½% Šðor 100−A ½% ŠÞ<br />
(12)<br />
ϕi i =1<br />
ð13Þ<br />
where Aa and Ap are the area <str<strong>on</strong>g>of</str<strong>on</strong>g> white and black regi<strong>on</strong>s, respectively;<br />
At is Aa+Ap, ϕ is the radius <str<strong>on</strong>g>of</str<strong>on</strong>g> <str<strong>on</strong>g>air</str<strong>on</strong>g> <str<strong>on</strong>g>voids</str<strong>on</strong>g>, and N is the total number <str<strong>on</strong>g>of</str<strong>on</strong>g> <str<strong>on</strong>g>air</str<strong>on</strong>g><br />
<str<strong>on</strong>g>voids</str<strong>on</strong>g> <strong>in</strong> the secti<strong>on</strong>. In this study, the geometric factors were<br />
calculated by a MATLAB® code us<strong>in</strong>g the im<strong>age</strong> process<strong>in</strong>g toolbox,<br />
and the results are summarized <strong>in</strong> Table 1. The im<strong>age</strong> analysis shows<br />
that the cement pastes <strong>in</strong>vestigated <strong>in</strong> this study c<strong>on</strong>ta<strong>in</strong> 0.1%–5.3% <str<strong>on</strong>g>air</str<strong>on</strong>g><br />
<str<strong>on</strong>g>voids</str<strong>on</strong>g>. For the same dos<strong>age</strong> <str<strong>on</strong>g>of</str<strong>on</strong>g> AEA, pastes with 0.5 w/c have higher <str<strong>on</strong>g>air</str<strong>on</strong>g><br />
c<strong>on</strong>tent than the 0.4 w/c pastes. The aver<strong>age</strong> size <str<strong>on</strong>g>of</str<strong>on</strong>g> <str<strong>on</strong>g>air</str<strong>on</strong>g> <str<strong>on</strong>g>voids</str<strong>on</strong>g> is about<br />
125 μm.<br />
4.2. Vicat results<br />
Ch 1<br />
Ch 2<br />
(a) cement paste (f) steel rod<br />
(b) (a)<br />
(b) transducers (g) steel bolt<br />
(c) rubber c<strong>on</strong>ta<strong>in</strong>er (h) transducer hous<strong>in</strong>g<br />
(h) (d) rubber lid (i) s<str<strong>on</strong>g>of</str<strong>on</strong>g>t rubber layer<br />
(c)<br />
(e) Plexiglas plate<br />
(i)<br />
A/D c<strong>on</strong>verter<br />
Fig. 2. Test setup and data acquisiti<strong>on</strong> system <str<strong>on</strong>g>of</str<strong>on</strong>g> ultras<strong>on</strong>ic measurement.<br />
The <strong>in</strong>itial and f<strong>in</strong>al sett<strong>in</strong>g times were determ<strong>in</strong>ed by the Vicat<br />
needle test for all specimens, and are summarized <strong>in</strong> Table 1. Results<br />
show that the n<strong>on</strong>-<str<strong>on</strong>g>air</str<strong>on</strong>g>-entra<strong>in</strong>ed specimens have earlier sett<strong>in</strong>g times<br />
than the <str<strong>on</strong>g>air</str<strong>on</strong>g>-entra<strong>in</strong>ed specimens. However, the sett<strong>in</strong>g time does not<br />
<strong>in</strong>crease with the AEA amount l<strong>in</strong><strong>early</strong>. For example, the pastes with<br />
0.01% AEA for both 0.4 and 0.5 w/c set later than the pastes with 0.2%<br />
AEA.<br />
5. Ultras<strong>on</strong>ic test results<br />
CPU<br />
5.1. B-scan im<strong>age</strong>s <str<strong>on</strong>g>of</str<strong>on</strong>g> ultras<strong>on</strong>ic <strong>wave</strong>s<br />
Im<strong>age</strong>s are formed by stack<strong>in</strong>g up a series <str<strong>on</strong>g>of</str<strong>on</strong>g> normalized ultras<strong>on</strong>ic<br />
<strong>wave</strong> signals recorded at different <strong>age</strong>s, with the x-axis represent<strong>in</strong>g<br />
the time <str<strong>on</strong>g>of</str<strong>on</strong>g> signals (unit: microsec<strong>on</strong>ds), and y-axis for <strong>age</strong>s <str<strong>on</strong>g>of</str<strong>on</strong>g> cement<br />
875
876 J. Zhu et al. / Cement and C<strong>on</strong>crete Research 41 (2011) 872–881<br />
a) 04-0 b) 04-0.01<br />
10 mm<br />
pastes (unit: hours). Brightness <str<strong>on</strong>g>of</str<strong>on</strong>g> the grayscale im<strong>age</strong>s represents the<br />
amplitude <str<strong>on</strong>g>of</str<strong>on</strong>g> signals, with bright color for positive amplitudes, and<br />
dark color for negative amplitudes. Due to the similarity between the<br />
obta<strong>in</strong>ed im<strong>age</strong>s (time vs. <strong>age</strong>) and the B-scan im<strong>age</strong>s (time vs.<br />
scann<strong>in</strong>g distance) used <strong>in</strong> ultras<strong>on</strong>ic NDT field, we use the term<br />
‘B-scan’ to name the ultras<strong>on</strong>ic signal im<strong>age</strong>s <strong>in</strong> this study. Because the<br />
amplitudes <str<strong>on</strong>g>of</str<strong>on</strong>g> ultras<strong>on</strong>ic <strong>wave</strong> signals at later <strong>age</strong>s are several orders<br />
higher than that at <strong>early</strong> <strong>age</strong>s, each signal was first normalized by its<br />
maximum amplitude, so that all signals have the same normalized<br />
peak amplitude 1.0. In Fig. 4(a)–(d), to dist<strong>in</strong>guish shear <strong>wave</strong>s, the<br />
color scale is set as [−0.1, 0.1]. In Fig. 4(e) and (f), the color scale is set<br />
as [−1, 1].<br />
5.1.1. 500 kHz P <strong>wave</strong> transducers<br />
Fig. 4 shows a series <str<strong>on</strong>g>of</str<strong>on</strong>g> B-scan im<strong>age</strong>s <str<strong>on</strong>g>of</str<strong>on</strong>g> ultras<strong>on</strong>ic <strong>wave</strong> signals<br />
through cement pastes us<strong>in</strong>g the 500 kHz P <strong>wave</strong> transducers. The<br />
B-scan im<strong>age</strong>s are effective to identify different <strong>wave</strong> modes<br />
propagat<strong>in</strong>g through the cement pastes, which might be otherwise<br />
difficult to identify from a s<strong>in</strong>gle <strong>wave</strong>form. In Fig. 4, im<strong>age</strong>s (a), (c),<br />
and (e) <strong>in</strong> the left column are for specimens with w/c=0.4, and im<strong>age</strong>s<br />
(b), (d), and (f) <strong>in</strong> the right column are for specimens with w/c=0.5.<br />
Im<strong>age</strong>s <strong>in</strong> the first, sec<strong>on</strong>d and third rows are from the de-<str<strong>on</strong>g>air</str<strong>on</strong>g>ed, no<br />
AEA, and 0.2% AEA samples, respectively. B-scan im<strong>age</strong>s corresp<strong>on</strong>d<strong>in</strong>g<br />
to the specimens with AEA=0.01 and 0.05% are not presented;<br />
however, characteristics <str<strong>on</strong>g>of</str<strong>on</strong>g> the <strong>wave</strong> propagati<strong>on</strong> <strong>in</strong> these samples are<br />
similar to the samples with 0.2% AEA.<br />
The im<strong>age</strong>s for de-<str<strong>on</strong>g>air</str<strong>on</strong>g>ed specimens (Fig. 4(a) and (b)) show clear<br />
and str<strong>on</strong>g P <strong>wave</strong> arrivals from very <strong>early</strong> <strong>age</strong>s, and the arrival time<br />
stays c<strong>on</strong>stant <strong>in</strong> the first 2 hours. Dur<strong>in</strong>g the 20 hours tests, the<br />
P <strong>wave</strong> have relative c<strong>on</strong>stant pulse width (or frequency), which is<br />
shown as c<strong>on</strong>stant width <str<strong>on</strong>g>of</str<strong>on</strong>g> the bright color regi<strong>on</strong>s. Multiple<br />
reflecti<strong>on</strong>s <str<strong>on</strong>g>of</str<strong>on</strong>g> P <strong>wave</strong>s are also cl<strong>early</strong> observed, which resemble the<br />
first P <strong>wave</strong> pulses but arrive at later time. In additi<strong>on</strong> to P <strong>wave</strong>s,<br />
shear <strong>wave</strong>s are also observed, which have much lower amplitude<br />
compar<strong>in</strong>g to the P <strong>wave</strong>s. In im<strong>age</strong>s (a)–(d), the color scales are set as<br />
c) 04-0.2<br />
10 mm 10 mm<br />
d) 05-0 e) 05-0.01 e) 05-0.2<br />
10 mm<br />
Fig. 3. Typical secti<strong>on</strong>al im<strong>age</strong>s <str<strong>on</strong>g>of</str<strong>on</strong>g> specimens with various mix proporti<strong>on</strong>s: (a) w/c=0.4, and AE=0%; (b) w/c =0.4, and AEA 0.01%; (c) w/c=0.4, and AEA 0.05%; (d) w/c =0.5, and<br />
AEA 0%; (e) w/c=0.5, and AEA 0.01%; and (f) w/c=0.5, and AEA 0.2%.<br />
10 mm<br />
10 mm<br />
[−0.1, 0.1] to dist<strong>in</strong>guish weak shear <strong>wave</strong>s from dom<strong>in</strong>ant P <strong>wave</strong>s.<br />
Several reflecti<strong>on</strong>s <str<strong>on</strong>g>of</str<strong>on</strong>g> shear <strong>wave</strong>s are also shown <strong>in</strong> these im<strong>age</strong>s.<br />
With the <strong>in</strong>crease <str<strong>on</strong>g>of</str<strong>on</strong>g> cement <strong>age</strong>s, the arrival times <str<strong>on</strong>g>of</str<strong>on</strong>g> P and S <strong>wave</strong>s<br />
decrease.<br />
Fig. 4(c) and (d) show B-scan im<strong>age</strong>s for n<strong>on</strong>-<str<strong>on</strong>g>air</str<strong>on</strong>g>-entra<strong>in</strong>ed cement<br />
pastes with w/c <str<strong>on</strong>g>of</str<strong>on</strong>g> 0.4 and 0.5. Small amount <str<strong>on</strong>g>of</str<strong>on</strong>g> <str<strong>on</strong>g>air</str<strong>on</strong>g> bubbles were<br />
entrapped <strong>in</strong> cement pastes dur<strong>in</strong>g mix<strong>in</strong>g. Air void analysis results<br />
(Table 1) show that the <str<strong>on</strong>g>air</str<strong>on</strong>g> c<strong>on</strong>tents <strong>in</strong> these two mixtures are 0.21%<br />
and 0.56%, respectively. Compared to the de-<str<strong>on</strong>g>air</str<strong>on</strong>g>ed cases, the B-scan<br />
im<strong>age</strong>s for the n<strong>on</strong>-AEA mixtures show several different features.<br />
First, the P <strong>wave</strong> arrival times at <strong>early</strong> <strong>age</strong>s (b3 hours) are much later<br />
than <strong>in</strong> the de-<str<strong>on</strong>g>air</str<strong>on</strong>g>ed cases. Sec<strong>on</strong>d, the P <strong>wave</strong> becomes dispersive at<br />
<strong>early</strong> <strong>age</strong>s, which is shown as wider pulse durati<strong>on</strong> than <strong>in</strong> the late<br />
<strong>age</strong>s. Due to high attenuati<strong>on</strong> at <strong>early</strong> <strong>age</strong>s, <strong>on</strong>ly the first P <strong>wave</strong><br />
reflecti<strong>on</strong> is observed. Third, an <strong>in</strong>terest<strong>in</strong>g feature unique to the 0%<br />
AEA case is the high frequency <strong>wave</strong>s that appear before the P <strong>wave</strong><br />
arrival time. Spectral analysis shows that the res<strong>on</strong>ant frequencies <str<strong>on</strong>g>of</str<strong>on</strong>g><br />
these signals are around 600 kHz. This phenomen<strong>on</strong> was also<br />
observed by Sayers and Dahl<strong>in</strong> [12] <strong>in</strong> a mixture c<strong>on</strong>ta<strong>in</strong><strong>in</strong>g 2%<br />
CaCl 2, and by Kmack [20] <strong>in</strong> n<strong>on</strong>-AEA cement pastes. Sayers expla<strong>in</strong>ed<br />
that this high frequency <strong>wave</strong> was caused by res<strong>on</strong>ant vibrati<strong>on</strong> <str<strong>on</strong>g>of</str<strong>on</strong>g> <str<strong>on</strong>g>air</str<strong>on</strong>g><br />
bubbles <strong>in</strong> cement pastes. It is also seen that these <str<strong>on</strong>g>air</str<strong>on</strong>g> bubble<br />
res<strong>on</strong>ance <strong>wave</strong>s exist <strong>on</strong>ly when the cement pastes are still fresh,<br />
which corresp<strong>on</strong>ds to about 2.5 hours for w/c=0.4 and 4.0 hours for<br />
w/c=0.5 pastes <strong>in</strong> this study. Further analysis <strong>in</strong>dicates the res<strong>on</strong>ant<br />
<strong>wave</strong> has a velocity close to 1500 m/s, which agrees with previous<br />
study [12,20].<br />
Fig. 4(e) and (f) show B-scan im<strong>age</strong>s for ultras<strong>on</strong>ic signals <strong>in</strong><br />
cement pastes c<strong>on</strong>ta<strong>in</strong><strong>in</strong>g 0.2% AEA, with color scale <str<strong>on</strong>g>of</str<strong>on</strong>g> [−1.0, 1.0].<br />
Overall the im<strong>age</strong>s are similar to the im<strong>age</strong>s <strong>in</strong> Fig. 4(c) and (d), but<br />
the <strong>early</strong> <strong>age</strong> high frequency <strong>wave</strong>s are not present <strong>in</strong> this case. The<br />
P <strong>wave</strong> arrival time starts from 200 μs at <strong>early</strong> <strong>age</strong>s, and then gradually<br />
decreases with the <strong>age</strong> <str<strong>on</strong>g>of</str<strong>on</strong>g> cement paste. In the normalized im<strong>age</strong>s, the<br />
relative amplitudes <str<strong>on</strong>g>of</str<strong>on</strong>g> shear <strong>wave</strong> pulses are more prom<strong>in</strong>ent than <strong>in</strong><br />
the low <str<strong>on</strong>g>air</str<strong>on</strong>g> c<strong>on</strong>tent cases. This result <strong>in</strong>dicates that <str<strong>on</strong>g>air</str<strong>on</strong>g> <str<strong>on</strong>g>voids</str<strong>on</strong>g> attenuate
P<strong>wave</strong><br />
S<strong>wave</strong><br />
P<strong>wave</strong><br />
P<strong>wave</strong><br />
S<strong>wave</strong><br />
P<strong>wave</strong><br />
S<strong>wave</strong><br />
P <strong>wave</strong>s more than S <strong>wave</strong>s. Therefore, the signal amplitude ratio<br />
between S and P <strong>wave</strong>s is high. Because the signals were obta<strong>in</strong>ed<br />
us<strong>in</strong>g the 500 kHz P <strong>wave</strong> transducers, the signals were still<br />
dom<strong>in</strong>ated by P <strong>wave</strong>s.<br />
The normalized time doma<strong>in</strong> ultras<strong>on</strong>ic signals at 2 and 8 hours for<br />
cement pastes <str<strong>on</strong>g>of</str<strong>on</strong>g> w/c=0.4 are shown <strong>in</strong> Fig. 5. At 2 hours, the P <strong>wave</strong><br />
arrival time for 0.2% AEA specimen is much later than <strong>in</strong> the n<strong>on</strong>-AEA<br />
and de-<str<strong>on</strong>g>air</str<strong>on</strong>g>ed cases. The signal is very noisy and has low amplitude.<br />
Actually, the raw signal before normalizati<strong>on</strong> for the de-<str<strong>on</strong>g>air</str<strong>on</strong>g>ed paste is<br />
seven orders higher than that <strong>in</strong> the 0.2% AEA paste. At this <strong>age</strong>, shear<br />
<strong>wave</strong>s were not observed. At 8 hours (after f<strong>in</strong>al sett<strong>in</strong>g), both P and S<br />
J. Zhu et al. / Cement and C<strong>on</strong>crete Research 41 (2011) 872–881<br />
Air bubbleres<strong>on</strong>ance<br />
Fig. 4. B-scan im<strong>age</strong>s <str<strong>on</strong>g>of</str<strong>on</strong>g> normalized ultras<strong>on</strong>ic <strong>wave</strong> signals obta<strong>in</strong>ed from cement mixtures us<strong>in</strong>g the 500 kHz P <strong>wave</strong> transducers: (a) w/c=0.4, de-<str<strong>on</strong>g>air</str<strong>on</strong>g>ed, and AE=0%; (b) w/c=0.5,<br />
de-<str<strong>on</strong>g>air</str<strong>on</strong>g>ed, and AE=0%; (c) w/c=0.4, and AE=0%; (d) w/c=0.5, and AE=0%; (e) w/c =0.4, and AE=0.2%; and (f) w/c =0.5, and AE=0.2%. To dist<strong>in</strong>guish shear <strong>wave</strong>s, the color<br />
scale <strong>in</strong> (a)–(d) is set as [−0.1, 0.1]. The color scale for im<strong>age</strong>s (e)–(f) is [−1.0 1.0].<br />
<strong>wave</strong>s were observed <strong>in</strong> the AEA=0.2% case. In the other two cases,<br />
the relative amplitude <str<strong>on</strong>g>of</str<strong>on</strong>g> S <strong>wave</strong>s with respect to the P <strong>wave</strong>s is too<br />
small to be identified from a s<strong>in</strong>gle signal. However, with the aid <str<strong>on</strong>g>of</str<strong>on</strong>g><br />
B-scan im<strong>age</strong>s, it becomes easy to identify the S <strong>wave</strong>s.<br />
5.1.2. 500 kHz S <strong>wave</strong> transducers<br />
Fig. 6 shows the B-scan im<strong>age</strong> obta<strong>in</strong>ed from a cement paste with<br />
0.4 w/c and 0% AEA, us<strong>in</strong>g the shear <strong>wave</strong> transducers. To cl<strong>early</strong> show<br />
the separati<strong>on</strong> <str<strong>on</strong>g>of</str<strong>on</strong>g> S <strong>wave</strong>s from P <strong>wave</strong>s, <strong>on</strong>ly signals <strong>in</strong> the first<br />
5 hours are shown. Compared to Fig. 4(c), the shear <strong>wave</strong> comp<strong>on</strong>ents<br />
<strong>in</strong> Fig. 6 are much str<strong>on</strong>ger and clearer, and shear <strong>wave</strong>s were<br />
877
878 J. Zhu et al. / Cement and C<strong>on</strong>crete Research 41 (2011) 872–881<br />
Normalized signals<br />
Normalized signals<br />
0 50 100 150 200<br />
Time (µs)<br />
De-<str<strong>on</strong>g>air</str<strong>on</strong>g>ed<br />
AEA=0<br />
AEA=0.2%<br />
P <strong>wave</strong><br />
P <strong>wave</strong><br />
P <strong>wave</strong><br />
P <strong>wave</strong><br />
P <strong>wave</strong><br />
P <strong>wave</strong><br />
S <strong>wave</strong><br />
S <strong>wave</strong><br />
a) 2 hours<br />
De-<str<strong>on</strong>g>air</str<strong>on</strong>g>ed<br />
AEA=0<br />
AEA=0.2%<br />
b) 8 hours<br />
0 10 20 30 40 50 60 70 80 90 100<br />
Time (µs)<br />
Fig. 5. Time doma<strong>in</strong> ultras<strong>on</strong>ic signals at 2 and 8 hours for three cement pastes <str<strong>on</strong>g>of</str<strong>on</strong>g><br />
w/c=0.4.<br />
observed even <strong>in</strong> the first hour after mix<strong>in</strong>g. A comparis<strong>on</strong> <str<strong>on</strong>g>of</str<strong>on</strong>g> velocity<br />
measurement us<strong>in</strong>g the P and S <strong>wave</strong> transducers are shown <strong>in</strong><br />
Secti<strong>on</strong> 5.2.<br />
Age (Hours)<br />
5<br />
4.5<br />
4<br />
3.5<br />
3<br />
2.5<br />
2<br />
1.5<br />
1<br />
P <strong>wave</strong><br />
S <strong>wave</strong><br />
0.5<br />
0 500 1000 1500<br />
Time (µs)<br />
Fig. 6. Ultras<strong>on</strong>ic B-scan im<strong>age</strong>s obta<strong>in</strong>ed us<strong>in</strong>g the 500 kHz shear <strong>wave</strong> transducers<br />
from the cement paste <str<strong>on</strong>g>of</str<strong>on</strong>g> w/c=0.4, and AE=0%.<br />
5.1.3. 50 kHz P <strong>wave</strong> transducers<br />
Fig. 7 shows a B-scan im<strong>age</strong> <str<strong>on</strong>g>of</str<strong>on</strong>g> ultras<strong>on</strong>ic signals obta<strong>in</strong>ed by the<br />
50 kHz UPV transducers <strong>on</strong> a cement paste with 0.4 w/c and 0% AEA.<br />
Because the transducers have a very narrow band and high<br />
impedance, there is a l<strong>on</strong>g signal r<strong>in</strong>g<strong>in</strong>g follow<strong>in</strong>g the first P <strong>wave</strong><br />
arrival. Compared to Fig. 4(c), the P <strong>wave</strong> arrival time show a similar<br />
trend with <strong>age</strong>. However, the high frequency <strong>wave</strong>s at very <strong>early</strong> <strong>age</strong>s<br />
are not present <strong>in</strong> the 50 kHz im<strong>age</strong>. Accord<strong>in</strong>g to Sayers [12] theory,<br />
that phenomen<strong>on</strong> is caused by <str<strong>on</strong>g>air</str<strong>on</strong>g> bubble res<strong>on</strong>ance at high<br />
frequencies. The 50 kHz transducers are not able to excite the high<br />
frequency vibrati<strong>on</strong>. Shear <strong>wave</strong>s are visible from 4 to 6 hours, and<br />
then overshadowed by r<strong>in</strong>g<strong>in</strong>g P <strong>wave</strong> signals.<br />
5.2. Ultras<strong>on</strong>ic <strong>wave</strong> velocity<br />
5.2.1. P and S <strong>wave</strong> velocity—500 kHz<br />
The arrival times <str<strong>on</strong>g>of</str<strong>on</strong>g> P <strong>wave</strong>s are usually determ<strong>in</strong>ed by detect<strong>in</strong>g<br />
the first signal po<strong>in</strong>t that exceeds a predeterm<strong>in</strong>ed threshold.<br />
However, this method does not apply to shear <strong>wave</strong> arrival<br />
determ<strong>in</strong>ati<strong>on</strong>. In additi<strong>on</strong>, the threshold method may give err<strong>on</strong>eous<br />
results <strong>on</strong> noisy signals, especially at <strong>early</strong> <strong>age</strong>s. In this study, we used<br />
a digitiz<strong>in</strong>g tool to directly obta<strong>in</strong> S <strong>wave</strong> arrival times from B-scan<br />
im<strong>age</strong>s. The velocity was calculated by divid<strong>in</strong>g the <strong>wave</strong> path L over<br />
the travel time <str<strong>on</strong>g>of</str<strong>on</strong>g> <strong>wave</strong>s through specimens V=L/t. The actual <strong>wave</strong><br />
travel time t through cement pastes was determ<strong>in</strong>ed by subtract<strong>in</strong>g<br />
the time through the Plexiglas and couplants t 0 from the measured P<br />
or S <strong>wave</strong> arrival time. Fig. 8 shows the P and S <strong>wave</strong> velocities<br />
measured from all cement pastes us<strong>in</strong>g the 500 kHz P <strong>wave</strong><br />
transducers. Velocities measured with the 500 kHz S <strong>wave</strong> transducers<br />
are shown <strong>in</strong> Fig. 9. For comparis<strong>on</strong>, the results from P <strong>wave</strong><br />
transducers are also shown. It can be seen that these two setups give<br />
very similar results. The P <strong>wave</strong> transducer setup gives a slightly<br />
higher P <strong>wave</strong> velocity because a higher P <strong>wave</strong> amplitude tends to<br />
give an earlier arrival times for a specified threshold value.<br />
The effect <str<strong>on</strong>g>of</str<strong>on</strong>g> <str<strong>on</strong>g>air</str<strong>on</strong>g> <str<strong>on</strong>g>voids</str<strong>on</strong>g> <strong>on</strong> P <strong>wave</strong> velocities are cl<strong>early</strong> observed <strong>in</strong><br />
Fig. 8. At <strong>early</strong> <strong>age</strong>s, with the <strong>in</strong>crease <str<strong>on</strong>g>of</str<strong>on</strong>g> AEA dos<strong>age</strong>s, the P <strong>wave</strong><br />
velocities decrease dramatically, from 1500 m/s <strong>in</strong> the de-<str<strong>on</strong>g>air</str<strong>on</strong>g>ed<br />
sample to about 200 m/s <strong>in</strong> <str<strong>on</strong>g>air</str<strong>on</strong>g>-entra<strong>in</strong>ed specimens. For w/c=0.4,<br />
at late <strong>age</strong>s, n<strong>on</strong>-AEA specimens show similar P <strong>wave</strong> velocities, and<br />
the <str<strong>on</strong>g>air</str<strong>on</strong>g>-entra<strong>in</strong>ed specimens have slightly lower velocities. For pastes<br />
with water/cement <str<strong>on</strong>g>of</str<strong>on</strong>g> 0.5, the <str<strong>on</strong>g>air</str<strong>on</strong>g>-entra<strong>in</strong>ed specimens show more<br />
decrease <str<strong>on</strong>g>of</str<strong>on</strong>g> VP at late <strong>age</strong>s than <strong>in</strong> the 0.4 w/c specimens. The overall<br />
Age [hours]<br />
14<br />
12<br />
10<br />
8<br />
6<br />
4<br />
2<br />
P Wave<br />
S Wave<br />
0<br />
0 200 300 600<br />
Time [µs]<br />
Fig. 7. B-scan im<strong>age</strong> <str<strong>on</strong>g>of</str<strong>on</strong>g> ultras<strong>on</strong>ic <strong>wave</strong> signals obta<strong>in</strong>ed us<strong>in</strong>g the 50 kHz P <strong>wave</strong><br />
transducers from a cement paste <str<strong>on</strong>g>of</str<strong>on</strong>g> w/c =0.4, AEA =0%.
a)<br />
Velocity (m/s)<br />
b)<br />
Velocity (m/s)<br />
2500<br />
2000<br />
1500<br />
1000<br />
500<br />
2500<br />
2000<br />
1500<br />
1000<br />
500<br />
W/C=0.4, 500kHz<br />
De-<str<strong>on</strong>g>air</str<strong>on</strong>g>ed<br />
0%<br />
0.01<br />
0.05<br />
0<br />
0 2 4 6 8 10 12 14 16 18 20<br />
Age (Hours)<br />
W/C=0.5, 500kHz Initial set<br />
<str<strong>on</strong>g>air</str<strong>on</strong>g> bubble resoance<br />
De-<str<strong>on</strong>g>air</str<strong>on</strong>g>ed<br />
0%<br />
0.2<br />
0.01<br />
0.05<br />
0.2<br />
F<strong>in</strong>al set<br />
Water<br />
0<br />
0 2 4 6 8 10 12 14 16 18 20<br />
Age (Hours)<br />
trend <str<strong>on</strong>g>of</str<strong>on</strong>g> P <strong>wave</strong> curves <strong>in</strong>dicates that the <str<strong>on</strong>g>air</str<strong>on</strong>g> <str<strong>on</strong>g>voids</str<strong>on</strong>g> str<strong>on</strong>gly affect<br />
P <strong>wave</strong> velocity at <strong>early</strong> <strong>age</strong>s, but have relatively little effect at late<br />
<strong>age</strong>s. On the other hand, presence <str<strong>on</strong>g>of</str<strong>on</strong>g> <str<strong>on</strong>g>air</str<strong>on</strong>g> <str<strong>on</strong>g>voids</str<strong>on</strong>g> has little effect <strong>on</strong> S<br />
<strong>wave</strong> velocity, especially <strong>in</strong> the 0.4 w/c cases. For w/c=0.5 specimens,<br />
the S <strong>wave</strong> velocity curves show some difference for various <str<strong>on</strong>g>air</str<strong>on</strong>g><br />
Air<br />
P <strong>wave</strong><br />
S <strong>wave</strong><br />
S <strong>wave</strong><br />
P <strong>wave</strong><br />
Initial set<br />
F<strong>in</strong>al set<br />
Water<br />
Fig. 8. Ultras<strong>on</strong>ic <strong>wave</strong> velocity measured from ten cement paste specimens us<strong>in</strong>g<br />
500 kHz P <strong>wave</strong> transducers: (a) w/c=0.4, and (b) w/c=0.5. Initial and f<strong>in</strong>al sett<strong>in</strong>g<br />
times are marked <strong>on</strong> curves. Numbers <strong>in</strong> the figure represent AEA dose. The zoomed<br />
<strong>early</strong> <strong>age</strong> shear <strong>wave</strong> curves are also shown.<br />
Velocity (m/s)<br />
3000<br />
2500<br />
2000<br />
1500<br />
1000<br />
500<br />
Vp<br />
Vs<br />
0<br />
0 5 10<br />
Age (hours)<br />
15 20<br />
Air<br />
Shear transducer<br />
P <strong>wave</strong> transducer<br />
Fig. 9. Comparis<strong>on</strong> <str<strong>on</strong>g>of</str<strong>on</strong>g> measured <strong>wave</strong> velocities us<strong>in</strong>g the 500 kHz P <strong>wave</strong> and S <strong>wave</strong><br />
transducers.<br />
J. Zhu et al. / Cement and C<strong>on</strong>crete Research 41 (2011) 872–881<br />
c<strong>on</strong>tents. However the S <strong>wave</strong> velocity differences at <strong>early</strong> <strong>age</strong>s are<br />
still smaller than <strong>in</strong> the P <strong>wave</strong> velocity data.<br />
Sett<strong>in</strong>g times for all mixtures are also marked <strong>on</strong> Fig. 8 velocity<br />
curves. As seen <strong>in</strong> the figure, although the sett<strong>in</strong>g times for all cement<br />
pastes are very close (differ by 0.5 hour), the P <strong>wave</strong> velocity<br />
corresp<strong>on</strong>d<strong>in</strong>g to the <strong>in</strong>itial sett<strong>in</strong>g time is different for each cement<br />
paste. In the de-<str<strong>on</strong>g>air</str<strong>on</strong>g>ed and n<strong>on</strong>-<str<strong>on</strong>g>air</str<strong>on</strong>g>-entra<strong>in</strong>ed cement pastes, the <strong>in</strong>itial<br />
sett<strong>in</strong>g times corresp<strong>on</strong>d to the po<strong>in</strong>ts where VP starts to <strong>in</strong>crease.<br />
However, for all <str<strong>on</strong>g>air</str<strong>on</strong>g>-entra<strong>in</strong>ed cement pastes, the <strong>in</strong>itial sett<strong>in</strong>g times<br />
do not corresp<strong>on</strong>d to certa<strong>in</strong> features <strong>on</strong> the P <strong>wave</strong> velocity curve,<br />
such as start <strong>in</strong>creas<strong>in</strong>g po<strong>in</strong>t, <strong>in</strong>flecti<strong>on</strong> po<strong>in</strong>t, or water velocity po<strong>in</strong>t<br />
[7,11,13,17,18]. However, the shear <strong>wave</strong> velocities at the <strong>in</strong>itial<br />
sett<strong>in</strong>g times are almost the same for all specimens. More detailed<br />
discussi<strong>on</strong> is given <strong>in</strong> Secti<strong>on</strong> 6.<br />
Fig. 10 plots the measured V P aga<strong>in</strong>st V S for all w/c=0.4 cement<br />
pastes with different <str<strong>on</strong>g>air</str<strong>on</strong>g> c<strong>on</strong>tents. S<strong>in</strong>ce Vs reflects modulus<br />
development <str<strong>on</strong>g>of</str<strong>on</strong>g> the solid frame (Eq. 2), Fig. 10 represents the P<br />
<strong>wave</strong> variati<strong>on</strong> with the solid frame stiffness. Compar<strong>in</strong>g Fig. 10 with<br />
the theoretical analysis results <strong>in</strong> Fig. 1, it can be noticed that the<br />
experimental results show a similar trend as predicted as the Biot's<br />
theory.<br />
5.2.2. P and S <strong>wave</strong> velocity—50 kHz<br />
Wave velocities measured by the 50 kHz transducers for w/c=0.4<br />
cement pastes are shown <strong>in</strong> Fig. 11. For comparis<strong>on</strong>, the P <strong>wave</strong><br />
velocity measured with the 500 kHz transducers is also shown for<br />
mixture AEA=0.2%. Overall, the c<strong>on</strong>clusi<strong>on</strong>s obta<strong>in</strong>ed from the<br />
500 kHz tests also apply to the 50 kHz tests. For all pastes c<strong>on</strong>ta<strong>in</strong><strong>in</strong>g<br />
<str<strong>on</strong>g>air</str<strong>on</strong>g> <str<strong>on</strong>g>voids</str<strong>on</strong>g>, the P <strong>wave</strong> velocities start at a very low value and gradually<br />
<strong>in</strong>crease with <strong>age</strong>s. The de-<str<strong>on</strong>g>air</str<strong>on</strong>g>ed and n<strong>on</strong>-<str<strong>on</strong>g>air</str<strong>on</strong>g>-entra<strong>in</strong>ed pastes show<br />
almost the same velocity after <strong>in</strong>itial sett<strong>in</strong>g.<br />
5.3. Correlati<strong>on</strong> between <strong>wave</strong> velocities and sett<strong>in</strong>g times<br />
Initial and f<strong>in</strong>al sett<strong>in</strong>g times determ<strong>in</strong>ed by the Vicat needle test for<br />
all specimens are summarized <strong>in</strong> Table 1. The ten specimens cover<br />
different <str<strong>on</strong>g>air</str<strong>on</strong>g> void c<strong>on</strong>tents from 0.2% to 5.5%. The <strong>wave</strong> velocities<br />
corresp<strong>on</strong>d<strong>in</strong>g to the sett<strong>in</strong>g times are also marked <strong>in</strong> Fig. 8. Fig. 11 plots<br />
the P and S <strong>wave</strong> velocities corresp<strong>on</strong>d<strong>in</strong>g to the <strong>in</strong>itial and f<strong>in</strong>al sett<strong>in</strong>g<br />
times versus the <str<strong>on</strong>g>air</str<strong>on</strong>g> c<strong>on</strong>tents. As shown <strong>in</strong> the plot, for <str<strong>on</strong>g>air</str<strong>on</strong>g> c<strong>on</strong>tent less<br />
than 2%, VP at the sett<strong>in</strong>g time decreases with <strong>in</strong>creas<strong>in</strong>g <str<strong>on</strong>g>air</str<strong>on</strong>g> c<strong>on</strong>tent <strong>in</strong><br />
cement pastes. For the de-<str<strong>on</strong>g>air</str<strong>on</strong>g>ed specimens, VP at the <strong>in</strong>itial sett<strong>in</strong>g time<br />
is around 1500 m/s; however, as the <str<strong>on</strong>g>air</str<strong>on</strong>g> c<strong>on</strong>tent <strong>in</strong>creases to 2%, V P at the<br />
Vp (m/s)<br />
2500<br />
2000<br />
1500<br />
1000<br />
De-<str<strong>on</strong>g>air</str<strong>on</strong>g>ed<br />
AEA=0<br />
0.01%<br />
Vs at sett<strong>in</strong>g time<br />
500<br />
0<br />
0.05%<br />
0.2%<br />
100 200 300 400 500 600 700 800 900 1000<br />
Vs (m/s)<br />
Fig. 10. Measured ultras<strong>on</strong>ic P <strong>wave</strong> velocity vs. S <strong>wave</strong> velocity for cement pastes<br />
(w/c =0.4) with different <str<strong>on</strong>g>air</str<strong>on</strong>g> c<strong>on</strong>tents. The dash l<strong>in</strong>es mark the range <str<strong>on</strong>g>of</str<strong>on</strong>g> shear <strong>wave</strong><br />
velocity at <strong>in</strong>itial sett<strong>in</strong>g times.<br />
879
880 J. Zhu et al. / Cement and C<strong>on</strong>crete Research 41 (2011) 872–881<br />
Vp (m/s)<br />
3000<br />
2500<br />
2000<br />
1500<br />
1000<br />
500<br />
<strong>in</strong>itial sett<strong>in</strong>g time decreases to about 900 m/s. Further <strong>in</strong>creas<strong>in</strong>g <str<strong>on</strong>g>air</str<strong>on</strong>g><br />
c<strong>on</strong>tent from 2% to 5% has relatively little effect <strong>on</strong> V P.<br />
Unlike the P <strong>wave</strong> velocity, the S <strong>wave</strong> velocity VS at sett<strong>in</strong>g times<br />
are not sensitive to <str<strong>on</strong>g>air</str<strong>on</strong>g> c<strong>on</strong>tent changes. Although the specimens <strong>in</strong><br />
this study have different mix proporti<strong>on</strong>s and sett<strong>in</strong>g times, the shear<br />
<strong>wave</strong> velocity V S at the <strong>in</strong>itial sett<strong>in</strong>g times are approximately <strong>in</strong> the<br />
range <str<strong>on</strong>g>of</str<strong>on</strong>g> 270–300 m/s for all cement pastes, which covers 0.1% to 5.5%<br />
<str<strong>on</strong>g>air</str<strong>on</strong>g> c<strong>on</strong>tent. The shear <strong>wave</strong> velocity V S at the f<strong>in</strong>al sett<strong>in</strong>g times are<br />
around 400 m/s. This experimental f<strong>in</strong>d<strong>in</strong>g verifies the c<strong>on</strong>clusi<strong>on</strong>s <strong>in</strong><br />
the theory secti<strong>on</strong>: the shear <strong>wave</strong> velocity V S is related to the solid<br />
frame stiffness G, and the relati<strong>on</strong>ship between them should not be<br />
affected by <str<strong>on</strong>g>air</str<strong>on</strong>g> <str<strong>on</strong>g>voids</str<strong>on</strong>g> <strong>in</strong> cement pastes.<br />
6. Discussi<strong>on</strong><br />
W/C=0.4, 50kHz<br />
De-<str<strong>on</strong>g>air</str<strong>on</strong>g>ed<br />
0%<br />
0.01<br />
0.2<br />
500kHz, 0.2% AEA<br />
Water<br />
0<br />
0 5 10<br />
Age (Hours)<br />
15 20<br />
Fig. 11. Measured ultras<strong>on</strong>ic P <strong>wave</strong> velocity for w/c=0.4 cement mixtures us<strong>in</strong>g the<br />
50 kHz transducers. For comparis<strong>on</strong>, the 500 kHz test result for AEA =0.2% is also<br />
shown.<br />
Although many studies have tried to correlate the ultras<strong>on</strong>ic P<br />
<strong>wave</strong> velocity with sett<strong>in</strong>g times <str<strong>on</strong>g>of</str<strong>on</strong>g> cement, there was still no clear<br />
answer to this questi<strong>on</strong>. Accord<strong>in</strong>g to Biot's theory, <strong>in</strong> the <strong>early</strong> <strong>age</strong> de<str<strong>on</strong>g>air</str<strong>on</strong>g>ed<br />
cement pastes, the P <strong>wave</strong> propagati<strong>on</strong> ma<strong>in</strong>ly <strong>in</strong>volves moti<strong>on</strong><br />
<strong>in</strong> the fluid phase. In this case, the P <strong>wave</strong> velocity is close to the<br />
velocity <str<strong>on</strong>g>of</str<strong>on</strong>g> the fluid phase, and it is not related to the solid frame<br />
microstructural development before sett<strong>in</strong>g time. For <str<strong>on</strong>g>air</str<strong>on</strong>g>-entra<strong>in</strong>ed<br />
cement pastes, however, from very beg<strong>in</strong>n<strong>in</strong>g <str<strong>on</strong>g>of</str<strong>on</strong>g> the cement<br />
hydrati<strong>on</strong>, the P <strong>wave</strong> propagati<strong>on</strong> <strong>in</strong>volves moti<strong>on</strong> <strong>in</strong> both the fluid<br />
phase and the solid frame, which is shown as c<strong>on</strong>t<strong>in</strong>uous <strong>in</strong>crease <str<strong>on</strong>g>of</str<strong>on</strong>g> P<br />
<strong>wave</strong> velocity with <strong>age</strong>s (Figs. 8, 9 and 11) and the solid frame<br />
stiffness (Figs. 1 and 10). This c<strong>on</strong>clusi<strong>on</strong> provides the base for us<strong>in</strong>g<br />
P <strong>wave</strong>s to m<strong>on</strong>itor sett<strong>in</strong>g and harden<strong>in</strong>g process <str<strong>on</strong>g>of</str<strong>on</strong>g> cement pastes.<br />
However, theoretical analysis and experimental results presented<br />
<strong>in</strong> this study show that the P <strong>wave</strong> velocity is str<strong>on</strong>gly affected by the<br />
<str<strong>on</strong>g>air</str<strong>on</strong>g> void c<strong>on</strong>tents <strong>in</strong> cement pastes at <strong>early</strong> <strong>age</strong>s, especially for small<br />
amount <str<strong>on</strong>g>of</str<strong>on</strong>g> <str<strong>on</strong>g>air</str<strong>on</strong>g> <str<strong>on</strong>g>voids</str<strong>on</strong>g>. This effect decreases at high level <str<strong>on</strong>g>of</str<strong>on</strong>g> <str<strong>on</strong>g>air</str<strong>on</strong>g> c<strong>on</strong>tent.<br />
Fig. 1 predicts that the effect <str<strong>on</strong>g>of</str<strong>on</strong>g> <str<strong>on</strong>g>air</str<strong>on</strong>g> <str<strong>on</strong>g>voids</str<strong>on</strong>g> <strong>on</strong> VP becomes saturated<br />
when the <str<strong>on</strong>g>air</str<strong>on</strong>g> void c<strong>on</strong>tent (by volume <str<strong>on</strong>g>of</str<strong>on</strong>g> fluid phase) is large than 5%<br />
(2.8% by cement paste volume). It has been verified by the<br />
experimental results <strong>in</strong> Fig. 12.<br />
Shear <strong>wave</strong> propagati<strong>on</strong> ma<strong>in</strong>ly <strong>in</strong>volves the solid frame <strong>on</strong>ly, and<br />
the S <strong>wave</strong> velocity is directly related to the shear modulus <str<strong>on</strong>g>of</str<strong>on</strong>g> solid<br />
frame. The Vicat test measures the shear resistance <str<strong>on</strong>g>of</str<strong>on</strong>g> cement pastes.<br />
Therefore, it is not a surprise to see str<strong>on</strong>g correlati<strong>on</strong> between the<br />
S <strong>wave</strong> velocity and sett<strong>in</strong>g time determ<strong>in</strong>ed by the Vicat test.<br />
Compared to P <strong>wave</strong>s, the S <strong>wave</strong>s are less affected by <str<strong>on</strong>g>air</str<strong>on</strong>g> <str<strong>on</strong>g>voids</str<strong>on</strong>g> and<br />
fluid phase property. However, the shear <strong>wave</strong> velocity measurement<br />
Air<br />
Velocity (m/s)<br />
1800<br />
1600<br />
1400<br />
1200<br />
1000<br />
800<br />
600<br />
400<br />
200<br />
did not receive the same level <str<strong>on</strong>g>of</str<strong>on</strong>g> attenti<strong>on</strong> as the P <strong>wave</strong>s. One<br />
possible reas<strong>on</strong> is that the high attenuati<strong>on</strong> <strong>in</strong> cement pastes prevents<br />
detecti<strong>on</strong> <str<strong>on</strong>g>of</str<strong>on</strong>g> shear <strong>wave</strong>s at <strong>early</strong> <strong>age</strong>s [4,5]; therefore the <strong>on</strong>set <str<strong>on</strong>g>of</str<strong>on</strong>g><br />
shear <strong>wave</strong>s was used as an <strong>in</strong>dicati<strong>on</strong> <str<strong>on</strong>g>of</str<strong>on</strong>g> <strong>in</strong>itial sett<strong>in</strong>g. In this study,<br />
us<strong>in</strong>g the shear <strong>wave</strong> transducer setup, comb<strong>in</strong>ed with B-scan im<strong>age</strong>s,<br />
the shear <strong>wave</strong>s can be detected as <strong>early</strong> as 30 m<strong>in</strong>utes after mix<strong>in</strong>g.<br />
The shear <strong>wave</strong> method shows great potential for m<strong>on</strong>itor<strong>in</strong>g sett<strong>in</strong>g<br />
and harden<strong>in</strong>g process <str<strong>on</strong>g>of</str<strong>on</strong>g> cementitious materials.<br />
7. C<strong>on</strong>clusi<strong>on</strong>s<br />
Vp at IS<br />
Vs at IS<br />
Vp at FS<br />
Vs at FS<br />
0<br />
0 1 2 3<br />
Air c<strong>on</strong>tent (%)<br />
4 5 6<br />
Fig. 12. Ultras<strong>on</strong>ic P and S <strong>wave</strong> velocities at <strong>in</strong>itial and f<strong>in</strong>al sett<strong>in</strong>g times for all cement<br />
paste specimens with different <str<strong>on</strong>g>air</str<strong>on</strong>g> void c<strong>on</strong>tents (w/c =0.4 and 0.5). Ultras<strong>on</strong>ic P and S<br />
<strong>wave</strong> velocities were measured with the 500 kHz P <strong>wave</strong> transducers. The <strong>in</strong>itial sett<strong>in</strong>g<br />
times were determ<strong>in</strong>ed from the Vicat test. Error bars are shown for S <strong>wave</strong> data.<br />
This paper presents a study to <strong>in</strong>vestigate <str<strong>on</strong>g>air</str<strong>on</strong>g> void effects <strong>on</strong><br />
ultras<strong>on</strong>ic <strong>wave</strong> propagati<strong>on</strong> <strong>in</strong> fresh cement pastes. Based <strong>on</strong><br />
experimental study and theoretical analysis, the follow<strong>in</strong>g c<strong>on</strong>clusi<strong>on</strong>s<br />
are obta<strong>in</strong>ed.<br />
1) The ultras<strong>on</strong>ic P <strong>wave</strong> velocity is str<strong>on</strong>gly affected by <str<strong>on</strong>g>air</str<strong>on</strong>g> <str<strong>on</strong>g>voids</str<strong>on</strong>g> <strong>in</strong><br />
<strong>early</strong> <strong>age</strong> cement pastes. One percent <str<strong>on</strong>g>of</str<strong>on</strong>g> <str<strong>on</strong>g>air</str<strong>on</strong>g> <str<strong>on</strong>g>voids</str<strong>on</strong>g> <strong>in</strong> fresh cement<br />
paste will reduce the P <strong>wave</strong> velocity from 1500 m/s to about<br />
200 m/s. When <str<strong>on</strong>g>air</str<strong>on</strong>g> c<strong>on</strong>tent is higher than 2%, V P becomes less<br />
sensitive to <str<strong>on</strong>g>air</str<strong>on</strong>g> c<strong>on</strong>tent changes.<br />
2) In n<strong>on</strong>-de-<str<strong>on</strong>g>air</str<strong>on</strong>g>ed, n<strong>on</strong>-<str<strong>on</strong>g>air</str<strong>on</strong>g>-entra<strong>in</strong>ed cement pastes, <strong>in</strong> additi<strong>on</strong> to P<br />
and S <strong>wave</strong>s propagat<strong>in</strong>g <strong>in</strong> the solid phase, there is another type<br />
<str<strong>on</strong>g>of</str<strong>on</strong>g> <strong>wave</strong> caused by <str<strong>on</strong>g>air</str<strong>on</strong>g> <str<strong>on</strong>g>voids</str<strong>on</strong>g> res<strong>on</strong>ance <strong>in</strong> the fluid phase, which<br />
propagates at 1500 m/s (water velocity). This type <str<strong>on</strong>g>of</str<strong>on</strong>g> <strong>wave</strong> is <strong>on</strong>ly<br />
observed <strong>in</strong> pastes with small amount <str<strong>on</strong>g>of</str<strong>on</strong>g> <str<strong>on</strong>g>air</str<strong>on</strong>g> <str<strong>on</strong>g>voids</str<strong>on</strong>g>, and when the<br />
<strong>in</strong>put frequency is close to the res<strong>on</strong>ant frequency, which is around<br />
600 kHz <strong>in</strong> this study.<br />
3) There is no clear relati<strong>on</strong>ship between the P <strong>wave</strong> velocity and<br />
<strong>in</strong>itial sett<strong>in</strong>g time by the Vicat test. In de-<str<strong>on</strong>g>air</str<strong>on</strong>g>ed or low <str<strong>on</strong>g>air</str<strong>on</strong>g> c<strong>on</strong>tent<br />
samples, the <strong>in</strong>itial sett<strong>in</strong>g occurs when VP starts to <strong>in</strong>crease.<br />
However, <strong>in</strong> cement pastes with <str<strong>on</strong>g>air</str<strong>on</strong>g> <str<strong>on</strong>g>voids</str<strong>on</strong>g>, the <strong>in</strong>itial sett<strong>in</strong>g time<br />
does not corresp<strong>on</strong>d to certa<strong>in</strong> features <strong>on</strong> the P <strong>wave</strong> velocity<br />
curve.<br />
4) The shear <strong>wave</strong> velocity reflects the solid frame microstructural<br />
development <strong>in</strong> fresh cement pastes. Therefore, V S is less affected<br />
by <str<strong>on</strong>g>air</str<strong>on</strong>g> <str<strong>on</strong>g>voids</str<strong>on</strong>g> than VP. Experimental results show that VS at sett<strong>in</strong>g<br />
times has relatively c<strong>on</strong>stant values for all cement mixtures, with<br />
different w/c and <str<strong>on</strong>g>air</str<strong>on</strong>g> c<strong>on</strong>tents. With 500 kHz ultras<strong>on</strong>ic transducers,<br />
the measured V S at <strong>in</strong>itial sett<strong>in</strong>g times are 270–300 m/s,<br />
and at f<strong>in</strong>al sett<strong>in</strong>g times are around 400 m/s. This study shows the<br />
potential <str<strong>on</strong>g>of</str<strong>on</strong>g> us<strong>in</strong>g shear <strong>wave</strong> velocity to m<strong>on</strong>itor sett<strong>in</strong>g process <str<strong>on</strong>g>of</str<strong>on</strong>g><br />
cement and c<strong>on</strong>crete.
5) Ultras<strong>on</strong>ic B-scan im<strong>age</strong>s illustrate the ultras<strong>on</strong>ic <strong>wave</strong> variati<strong>on</strong><br />
dur<strong>in</strong>g cement hydrati<strong>on</strong> process. With the aid <str<strong>on</strong>g>of</str<strong>on</strong>g> B-scan im<strong>age</strong>s, it<br />
is easy to identify different <strong>wave</strong> modes propagat<strong>in</strong>g through the<br />
cement pastes, and determ<strong>in</strong>e the arrival time <str<strong>on</strong>g>of</str<strong>on</strong>g> each <strong>wave</strong> mode,<br />
which could be difficult to identify from a s<strong>in</strong>gle <strong>wave</strong>form signal.<br />
References<br />
[1] ASTM C191, Standard test methods for time <str<strong>on</strong>g>of</str<strong>on</strong>g> sett<strong>in</strong>g <str<strong>on</strong>g>of</str<strong>on</strong>g> hydraulic cement by<br />
Vicat needle, American Society for Test<strong>in</strong>g and Materials, Pennsylvania.<br />
[2] L. Struble, H. Zhang, G.-K. Sun, W.-G. Lei, Oscillatory shear behavior <str<strong>on</strong>g>of</str<strong>on</strong>g> portland<br />
cement paste dur<strong>in</strong>g <strong>early</strong> hydrati<strong>on</strong>, C<strong>on</strong>crete Science and Eng<strong>in</strong>eer<strong>in</strong>g 2 (9)<br />
(2000) 141–149.<br />
[3] G. Sant, C.F. Ferraris, J. Weiss, Rheological properties <str<strong>on</strong>g>of</str<strong>on</strong>g> cement pastes: a<br />
discussi<strong>on</strong> <str<strong>on</strong>g>of</str<strong>on</strong>g> structure formati<strong>on</strong> and mechanical property development, Cement<br />
and C<strong>on</strong>crete Research 38 (11) (2008) 1286–1296.<br />
[4] A. Boumiz, C. Vernet, F.C. Tenoudji, Mechanical properties <str<strong>on</strong>g>of</str<strong>on</strong>g> cement pastes and<br />
mortars at <strong>early</strong> <strong>age</strong>s: evoluti<strong>on</strong> with time and degree <str<strong>on</strong>g>of</str<strong>on</strong>g> hydrati<strong>on</strong>, Advanced<br />
Cement Based Materials 3 (3–4) (1996) 94–106.<br />
[5] R. D'Angelo, T.J. Pl<strong>on</strong>a, L.M. Schwartz, P. Coveney, Ultras<strong>on</strong>ic measurements <strong>on</strong><br />
hydrat<strong>in</strong>g cement slurries: <strong>on</strong>set <str<strong>on</strong>g>of</str<strong>on</strong>g> shear <strong>wave</strong> propagati<strong>on</strong>, Advanced Cement<br />
Based Materials 2 (1) (1995) 8–14.<br />
[6] J. Keat<strong>in</strong>g, D. Hannant, A. Hibbert, Comparis<strong>on</strong> <str<strong>on</strong>g>of</str<strong>on</strong>g> shear modulus and pulse<br />
velocity techniques to measure the buildup <str<strong>on</strong>g>of</str<strong>on</strong>g> structure <strong>in</strong> fresh cement pastes<br />
used <strong>in</strong> oil-well cement<strong>in</strong>g, Cement and C<strong>on</strong>crete Research 19 (4) (1989)<br />
554–566.<br />
[7] H. Re<strong>in</strong>hardt, C. Grosse, C<strong>on</strong>t<strong>in</strong>uous m<strong>on</strong>itor<strong>in</strong>g <str<strong>on</strong>g>of</str<strong>on</strong>g> sett<strong>in</strong>g and harden<strong>in</strong>g <str<strong>on</strong>g>of</str<strong>on</strong>g> mortar<br />
and c<strong>on</strong>crete, C<strong>on</strong>structi<strong>on</strong> and Build<strong>in</strong>g Materials 18 (3) (2004) 145–154.<br />
[8] C.M. Sayers, R.L. Grenfell, Ultras<strong>on</strong>ic propagati<strong>on</strong> through hydrat<strong>in</strong>g cements,<br />
Ultras<strong>on</strong>ics 31 (3) (1993) 147–153.<br />
[9] Z. Sun, T. Voigt, S.P. Shah, Rheometric and ultras<strong>on</strong>ic <strong>in</strong>vestigati<strong>on</strong>s <str<strong>on</strong>g>of</str<strong>on</strong>g> viscoelastic<br />
properties <str<strong>on</strong>g>of</str<strong>on</strong>g> fresh portland cement pastes, Cement and C<strong>on</strong>crete Research 36 (2)<br />
(2006) 278–287.<br />
[10] T. Voigt, G. Ye, Z. Sun, S.P. Shah, K. van Breugel, Early <strong>age</strong> microstructure <str<strong>on</strong>g>of</str<strong>on</strong>g><br />
portland cement mortar <strong>in</strong>vestigated by ultras<strong>on</strong>ic shear <strong>wave</strong>s and numerical<br />
simulati<strong>on</strong>, Cement and C<strong>on</strong>crete Research 35 (5) (2005) 858–866.<br />
[11] T. Chotard, N. Gimet-Breart, A. Smith, D. Fargeot, J.P. B<strong>on</strong>net, C. Gault, Applicati<strong>on</strong><br />
<str<strong>on</strong>g>of</str<strong>on</strong>g> ultras<strong>on</strong>ic test<strong>in</strong>g to describe the hydrati<strong>on</strong> <str<strong>on</strong>g>of</str<strong>on</strong>g> calcium alum<strong>in</strong>ate cement at the<br />
<strong>early</strong> <strong>age</strong>, Cement and C<strong>on</strong>crete Research 31 (3) (2001) 405–412.<br />
[12] C. Sayers, A. Dahl<strong>in</strong>, Propagati<strong>on</strong> <str<strong>on</strong>g>of</str<strong>on</strong>g> ultrasound through hydrat<strong>in</strong>g cement pastes<br />
at <strong>early</strong> times, Advanced Cement Based Materials 1 (1) (1993) 12–21.<br />
[13] G. Ye, K. Van Breugel, A. Fraaij, Experimental study and numerical simulati<strong>on</strong> <strong>on</strong><br />
the formati<strong>on</strong> <str<strong>on</strong>g>of</str<strong>on</strong>g> microstructure <strong>in</strong> cementitious materials at <strong>early</strong> <strong>age</strong>, Cement<br />
and C<strong>on</strong>crete Research 33 (2) (2003) 233–239.<br />
J. Zhu et al. / Cement and C<strong>on</strong>crete Research 41 (2011) 872–881<br />
[14] H. Lee, K. Lee, Y. Kim, H. Yim, D. Bae, Ultras<strong>on</strong>ic <strong>in</strong>-situ m<strong>on</strong>itor<strong>in</strong>g <str<strong>on</strong>g>of</str<strong>on</strong>g> sett<strong>in</strong>g<br />
process <str<strong>on</strong>g>of</str<strong>on</strong>g> high-performance c<strong>on</strong>crete, Cement and C<strong>on</strong>crete Research 34 (4)<br />
(2004) 631–640.<br />
[15] L. Q<strong>in</strong>, Z. Li, M<strong>on</strong>itor<strong>in</strong>g <str<strong>on</strong>g>of</str<strong>on</strong>g> cement hydrati<strong>on</strong> us<strong>in</strong>g embedded piezoelectric<br />
transducers, Smart Materials and Structures 17 (5) (2008).<br />
[16] J. Rapoport, J. Popovics, S. Kolluru, S. Shah, Us<strong>in</strong>g ultrasound to m<strong>on</strong>itor stiffen<strong>in</strong>g<br />
process <str<strong>on</strong>g>of</str<strong>on</strong>g> c<strong>on</strong>crete with admixtures, ACI Materials Journal 97 (6).<br />
[17] T. Voigt, C. Grosse, Z. Sun, S. Shah, H. Re<strong>in</strong>hardt, Comparis<strong>on</strong> <str<strong>on</strong>g>of</str<strong>on</strong>g> ultras<strong>on</strong>ic <strong>wave</strong><br />
transmissi<strong>on</strong> and reflecti<strong>on</strong> measurements with p-and s-<strong>wave</strong>s <strong>on</strong> <strong>early</strong> <strong>age</strong><br />
mortar and c<strong>on</strong>crete, Materials and Structures 38 (8) (2005) 729–738.<br />
[18] G. Trtnik, G. Turk, F. Kavcic, V.B. Bosiljkov, Possibilities <str<strong>on</strong>g>of</str<strong>on</strong>g> us<strong>in</strong>g the ultras<strong>on</strong>ic<br />
<strong>wave</strong> transmissi<strong>on</strong> method to estimate <strong>in</strong>itial sett<strong>in</strong>g time <str<strong>on</strong>g>of</str<strong>on</strong>g> cement paste,<br />
Cement and C<strong>on</strong>crete Research 38 (11) (2008) 1336–1342.<br />
[19] J. Keat<strong>in</strong>g, D. Hannant, A. Hibbert, Correlati<strong>on</strong> between cube strength, ultras<strong>on</strong>ic<br />
pulse velocity, and volume change for oil-well cement slurries, Cement and<br />
C<strong>on</strong>crete Research 19 (5) (1989) 715–726.<br />
[20] R. M. Kmack, Characterizati<strong>on</strong> <str<strong>on</strong>g>of</str<strong>on</strong>g> <str<strong>on</strong>g>air</str<strong>on</strong>g> <str<strong>on</strong>g>voids</str<strong>on</strong>g> <strong>in</strong> fresh cement paste through<br />
ultras<strong>on</strong>ic n<strong>on</strong>destructive test<strong>in</strong>g, Master's thesis, Georgia Institute <str<strong>on</strong>g>of</str<strong>on</strong>g> Technology<br />
(2008).<br />
[21] D. Bentz, P. Coveney, E. Garboczi, M. Kleyn, P. Stutzman, Cellular automat<strong>on</strong><br />
simulati<strong>on</strong>s <str<strong>on</strong>g>of</str<strong>on</strong>g> cement hydrati<strong>on</strong> and microstructure development, Modell<strong>in</strong>g and<br />
Simulati<strong>on</strong> <strong>in</strong> Materials Science and Eng<strong>in</strong>eer<strong>in</strong>g 2 (4) (1994) 783–808.<br />
[22] K. Subramaniam, J. Lee, Ultras<strong>on</strong>ic assessment <str<strong>on</strong>g>of</str<strong>on</strong>g> <strong>early</strong>-<strong>age</strong> changes <strong>in</strong> the material<br />
properties <str<strong>on</strong>g>of</str<strong>on</strong>g> cementitious materials, Materials and Structures 40 (3) (2007)<br />
301–309.<br />
[23] C. Chung, J. Popovics, L. Struble, Early <strong>age</strong> stiffen<strong>in</strong>g <str<strong>on</strong>g>of</str<strong>on</strong>g> cement paste us<strong>in</strong>g<br />
ultras<strong>on</strong>ic <strong>wave</strong> reflecti<strong>on</strong>, ACI-SP: transiti<strong>on</strong> from fluid to solid: re-exam<strong>in</strong><strong>in</strong>g the<br />
behavior <str<strong>on</strong>g>of</str<strong>on</strong>g> c<strong>on</strong>crete at <strong>early</strong> <strong>age</strong>s, 2009.<br />
[24] A. Harker, J. Temple, Velocity and attenuati<strong>on</strong> <str<strong>on</strong>g>of</str<strong>on</strong>g> ultrasound <strong>in</strong> suspensi<strong>on</strong>s <str<strong>on</strong>g>of</str<strong>on</strong>g><br />
particles <strong>in</strong> fluids, Journal <str<strong>on</strong>g>of</str<strong>on</strong>g> Physics D: Applied Physics 21 (11) (1988) 1576–1588.<br />
[25] M.A. Biot, theory <str<strong>on</strong>g>of</str<strong>on</strong>g> propagati<strong>on</strong> <str<strong>on</strong>g>of</str<strong>on</strong>g> elastic <strong>wave</strong>s <strong>in</strong> a fluid-saturated porous solid.<br />
I. Low-frequency range, The Journal <str<strong>on</strong>g>of</str<strong>on</strong>g> the Acoustical Society <str<strong>on</strong>g>of</str<strong>on</strong>g> America 28 (2)<br />
(1956) 168–178.<br />
[26] M.A. Biot, Theory <str<strong>on</strong>g>of</str<strong>on</strong>g> propagati<strong>on</strong> <str<strong>on</strong>g>of</str<strong>on</strong>g> elastic <strong>wave</strong>s <strong>in</strong> a fluid-saturated porous solid.<br />
II. Higher frequency range, The Journal <str<strong>on</strong>g>of</str<strong>on</strong>g> the Acoustical Society <str<strong>on</strong>g>of</str<strong>on</strong>g> America 28 (2)<br />
(1956) 179–191.<br />
[27] D.L. Johns<strong>on</strong>, T.J. Pl<strong>on</strong>a, Acoustic slow <strong>wave</strong>s and the c<strong>on</strong>solidati<strong>on</strong> transiti<strong>on</strong>, The<br />
Journal <str<strong>on</strong>g>of</str<strong>on</strong>g> the Acoustical Society <str<strong>on</strong>g>of</str<strong>on</strong>g> America 72 (2) (1982) 556–565.<br />
[28] G. Ye, P. Lura, K. van Breugel, A.L.A. Fraaij, Study <strong>on</strong> the development <str<strong>on</strong>g>of</str<strong>on</strong>g> the<br />
microstructure <strong>in</strong> cement-based materials by means <str<strong>on</strong>g>of</str<strong>on</strong>g> numerical simulati<strong>on</strong> and<br />
ultras<strong>on</strong>ic pulse velocity measurement, Cement and C<strong>on</strong>crete Composites 26<br />
(2004) 491–497.<br />
[29] ASTM C260, Standard specificati<strong>on</strong> for <str<strong>on</strong>g>air</str<strong>on</strong>g>-entra<strong>in</strong><strong>in</strong>g admixtures for c<strong>on</strong>crete,<br />
American Society for Test<strong>in</strong>g and Materials, Pennsylvania.<br />
[30] ASTM C457, Standard test method for microscopical determ<strong>in</strong>ati<strong>on</strong> <str<strong>on</strong>g>of</str<strong>on</strong>g> parameters<br />
<str<strong>on</strong>g>of</str<strong>on</strong>g> the <str<strong>on</strong>g>air</str<strong>on</strong>g>-void system <strong>in</strong> hardened c<strong>on</strong>crete, American Society for Test<strong>in</strong>g and<br />
Materials, Pennsylvania.<br />
881