24.02.2010 annual report 2009.pdf - Woodside
24.02.2010 annual report 2009.pdf - Woodside
24.02.2010 annual report 2009.pdf - Woodside

Create successful ePaper yourself
Turn your PDF publications into a flip-book with our unique Google optimized e-Paper software.
Annual Report 2009
Contents<br />
Overview 1<br />
Performance at a glance 1<br />
Mission statement and strategy 2<br />
Chairman’s overview 3<br />
CEO <strong>report</strong> 4<br />
CFO <strong>report</strong> 6<br />
LNG markets 8<br />
Reserves statement 10<br />
North West Shelf 25 Years 14<br />
Business reviews 16<br />
North West Shelf 16<br />
Australia Business Unit 18<br />
Pluto LNG 20<br />
Sunrise LNG 22<br />
Browse LNG 23<br />
United States 24<br />
Other international 25<br />
Production 26<br />
Sustainability 27<br />
Health and safety 27<br />
Our people 28<br />
Sustainable business Principles 29<br />
Governance 31<br />
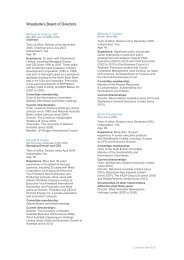
Board of Directors 31<br />
Corporate governance statement 33<br />
Directors’ <strong>report</strong>: 44<br />
Remuneration <strong>report</strong> 45<br />
2009 Financial Report 61<br />
Shareholder information 131<br />
Shareholder registry: enquiries 132<br />
Investor Relations: enquiries 132<br />
Business directory 132<br />
Key announcements 2009 133<br />
Events Calendar 2010 133<br />
Conversion factors 134<br />
Glossary 134<br />
Quick reference guide 135<br />
2009 product and revenue summary 136<br />
10 Year comparative data summary 137<br />
Visit <strong>Woodside</strong> website<br />
See table in this section<br />
We have partnered with<br />
Green Reports TM in an<br />
initiative that ensures our<br />
Annual Report obligations<br />
are not impacting the<br />
environment.<br />
About this <strong>report</strong><br />
This 2009 Annual Report is a summary<br />
of <strong>Woodside</strong>’s operations, activities and<br />
financial position as at 31 December 2009.<br />
<strong>Woodside</strong> Petroleum Ltd (ABN 55 004<br />
898 962) is the parent company of<br />
the <strong>Woodside</strong> group of companies. In<br />
this <strong>report</strong>, unless otherwise stated,<br />
references to ‘<strong>Woodside</strong>’ and ‘the Group’,<br />
‘we’, ‘us’ and ‘our’ refer to <strong>Woodside</strong><br />
Petroleum Ltd and its controlled entities,<br />
as a whole. References to ‘the company’<br />
refer to <strong>Woodside</strong> Petroleum Ltd unless<br />
otherwise stated. The text does not<br />
distinguish between the activities of<br />
the parent company and those of its<br />
controlled entities.<br />
References in this <strong>report</strong> to a ‘year’ is to<br />
the calendar year ended 31 December<br />
2009 unless otherwise stated. All dollar<br />
figures are expressed in Australian<br />
currency unless otherwise stated.<br />
<strong>Woodside</strong> is continuing efforts to reduce<br />
its environmental footprint associated with<br />
production of the Annual Report.<br />
Printed copies of the Annual Report will<br />
only be posted to shareholders who have<br />
elected to receive a printed copy of the<br />
<strong>report</strong>.<br />
The Annual Report is also printed<br />
on an environmentally responsible<br />
paper manufactured under ISO 14001<br />
environmental management standards,<br />
using Elemental Chlorine Free pulps from<br />
sustainable, well managed forests.<br />
2009 <strong>Woodside</strong> Sustainable<br />
Development Report<br />
<strong>Woodside</strong> also publishes a Sustainable<br />
Development Report that combines<br />
our Health, Safety, Environment and<br />
Community performance.<br />
Available on request or from the<br />
company’s website<br />
(www.woodside.com.au).<br />
Annual Report 2009<br />
About the cover<br />
About <strong>Woodside</strong><br />
<strong>Woodside</strong> is an independent Australian<br />
oil and gas company playing a key role in<br />
supplying energy to our region.<br />
We are one of the world’s leading<br />
producers of liquefied natural gas, helping<br />
meet the demands for cleaner energy from<br />
Japan, China, Korea and other countries in<br />
the Asia Pacific region.<br />
<strong>Woodside</strong> was formed in 1954, focused<br />
initially on oil exploration off Australia’s<br />
south coast.<br />
Major natural gas discoveries off the<br />
Western Australian coast in the 1970s<br />
changed the company’s direction, and<br />
today <strong>Woodside</strong> is one of the world’s preeminent<br />
producers of LNG.<br />
We operate the $27 billion North West<br />
Shelf project, which in 2009 celebrated<br />
25 years of natural gas production and<br />
20 years of LNG production.<br />
We pride ourselves as a stable and reliable<br />
supplier with a focus on delivering on our<br />
commitments.<br />
<strong>Woodside</strong>’s production of LNG continues<br />
to grow, with the Pluto foundation project<br />
on track for first gas by end 2010, with<br />
first LNG in early 2011 contingent on a<br />
productive industrial relations environment.<br />
We are already planning for an expansion<br />
of our Pluto project, and are seeking to<br />
develop a further two LNG projects –<br />
Browse in Australia’s Kimberley region and<br />
Sunrise off the northern coast.<br />
<strong>Woodside</strong> also maintains a portfolio of<br />
non-LNG projects. We produce natural<br />
gas, liquefied petroleum gas, condensate<br />
and oil for customers in Australia and<br />
elsewhere.<br />
With our large natural gas resource base,<br />
<strong>Woodside</strong> is a sought-after provider of<br />
cleaner energy. We seek excellence in<br />
environmental performance, and aim to<br />
ensure that wherever we operate, the local<br />
community benefits from our presence.<br />
Pluto LNG Project loading jetty construction nearing completion. In the<br />
background a fully laden North West Shelf LNG tanker sails to Asia.
Performance at a glance<br />
Production (MMboe)<br />
Revenue ($ million)<br />
Return on equity (%)<br />
Number of incidents<br />
Dividend per share (cents)<br />
59.7<br />
2005<br />
2,747<br />
2005<br />
31.6<br />
2005<br />
27<br />
2005<br />
93<br />
2005<br />
67.9<br />
Production<br />
70.6<br />
81.3<br />
80.9<br />
2006 2007 2008 2009<br />
Sales revenue<br />
(from continuing operations)<br />
3,475<br />
Return on equity<br />
(after significant items)<br />
34.0<br />
3,841<br />
20.2<br />
5,990<br />
25.8<br />
4,352<br />
2006 2007 2008 2009<br />
18.5<br />
2006 2007 2008 2009<br />
Environmental incidents<br />
(Category C and above)<br />
18<br />
Dividend per share<br />
126<br />
20<br />
104<br />
21<br />
135<br />
8<br />
2006 2007 2008 2009<br />
110<br />
2006 2007 2008 2009<br />
Net profit after tax ($ million)<br />
Net profit after tax ($ million)<br />
Reported net profit after tax<br />
(post significant items)<br />
1,107<br />
2005<br />
1,038<br />
2005<br />
1,427<br />
1,030<br />
Results at a glance<br />
Results highlights<br />
1,786<br />
1,824<br />
2006 2007 2008 2009<br />
Net profit after tax<br />
(pre significant items)<br />
1,396<br />
1,182<br />
1,832<br />
1,906<br />
2006 2007 2008 2009<br />
Total recordable case frequency rate<br />
(per million hours worked)<br />
Operating cashflow ($ million)<br />
Operating cashflow<br />
• Record <strong>report</strong>ed net profit after tax, up 2% to $1,824 million<br />
• Record underlying profit, up 4% to $1,906 million<br />
• Production volumes, down 0.5% to 80.9 million boe<br />
• Record sales volumes, up 0.6% to 80.7 million boe<br />
• Final dividend of 55 cents per share lifted full year dividend to 110 cents per share<br />
• Record investment spend of $5.7 billion<br />
• $2.9 billion of undrawn debt and cash on hand - gearing at 29.8%<br />
• Improved safety performance,TRCF reduced 23% to 3.3<br />
• Improved environmental performance, Category C and above incidents down 62% to 8<br />
• Proved plus Probable reserves over 1.6 billion boe<br />
2005<br />
1,381<br />
2005<br />
1,933<br />
Safety<br />
2006 2007 2008 2009<br />
2,482<br />
3,784<br />
1,859<br />
2006 2007 2008 2009<br />
High potential frequency rate<br />
(per million hours worked)<br />
2009 2008 % Change<br />
Net profit after tax ($ million) 1,824 1,786 2.1%<br />
Sales revenue ($ million) 4,352 5,990 -27.3%<br />
Cashflow from operating activities ($ million) 1,859 3,784 -50.9%<br />
Earnings per share (cents) 259 260 -0.3%<br />
Total recordable case frequency (TRCF) 3.3 4.3 23.3%<br />
Total shareholder return (TSR, %) 42* 23* 82.6%<br />
Production (MMboe) 80.9 81.3 -0.5%<br />
Proved reserves (MMboe) 1,296 1,328 -2.4%<br />
Proved plus Probable reserves (MMboe) 1,651 1,703 -3.1%<br />
Contingent resources (MMboe) 1,867 1,940 -3.8%<br />
* Source: Bloomberg, 5 year average, <strong>annual</strong>ised, USD<br />
3.8<br />
2.4<br />
5.1<br />
1.6<br />
4.1 4.3<br />
1.3<br />
1.1<br />
3.3<br />
0.7<br />
Overview<br />
1
2<br />
Title Mission statement<br />
and strategy<br />
Value<br />
<strong>Woodside</strong>’s strategy<br />
Foundation business<br />
Time<br />
LNG growth<br />
Complementary business<br />
In June 2009 the Board of Directors<br />
reviewed <strong>Woodside</strong>’s long-term strategy<br />
and confirmed the importance of<br />
maintaining the existing strategic direction<br />
and delivering against the LNG growth<br />
plan.<br />
<strong>Woodside</strong> continues to focus on improving<br />
its foundation business and delivering long-<br />
term growth in shareholder value through<br />
development of the Australian liquefied<br />
natural gas (LNG) portfolio.<br />
Mission, Vision and Values<br />
Mission<br />
To create and deliver outstanding,<br />
sustained growth in shareholder wealth by<br />
providing energy for the future.<br />
Vision<br />
To be a world-class LNG leader.<br />
To accomplish this, we need to be the<br />
company of choice through speed,<br />
execution skills, commercial acumen, cost<br />
focus and technical capability. Through our<br />
people and our values we will satisfy our<br />
shareholders and deliver a sustainable<br />
future.<br />
Successful Pluto Jacket launch about 190 km north-west of Karratha in October 2009<br />
<strong>Woodside</strong>’s foundation Australian business<br />
includes the producing assets in the North<br />
West Shelf Venture (NWSV) and Greater<br />
Exmouth area. These are complemented<br />
by producing assets elsewhere in Australia<br />
and the Gulf of Mexico. By maximising<br />
the returns from these assets <strong>Woodside</strong><br />
will meet its financial obligations and<br />
contribute funds to support the company’s<br />
growth ambitions.<br />
To further maximise the value of the<br />
investment in these existing assets<br />
<strong>Woodside</strong> will also pursue selective<br />
exploration and development opportunities.<br />
Continued operation of these facilities<br />
to appropriate safety, environmental<br />
and stakeholder standards will maintain<br />
<strong>Woodside</strong>’s licence to operate.<br />
Longer term growth in <strong>Woodside</strong>’s value<br />
and its overall future will be shaped by<br />
LNG. The company’s significant natural<br />
gas assets and infrastructure in Australia<br />
Values<br />
•<br />
•<br />
•<br />
•<br />
•<br />
•<br />
Strong and sustainable performance<br />
Care and respect<br />
Integrity and trust<br />
Initiative and accountability<br />
Creativity and enterprise<br />
Working together<br />
We recognise that our business must be<br />
profitable and sustainable. We believe<br />
that living these values makes <strong>Woodside</strong><br />
distinctive and is essential to our success.<br />
provide unparalleled opportunities within<br />
an industry struggling to access an ever<br />
depleting resource base. With increasing<br />
global demand for energy, driven by the<br />
continued growth of the Asian economies,<br />
we believe <strong>Woodside</strong> is well positioned<br />
to capitalise on new opportunities in<br />
emerging LNG markets. Delivery of the<br />
Pluto foundation project will support<br />
future LNG growth opportunities through<br />
expansion of Pluto and the development<br />
of Sunrise and Browse. Maintaining<br />
momentum on these projects will<br />
continue to build <strong>Woodside</strong>’s internal LNG<br />
capabilities and ensure access to the<br />
necessary external resources.<br />
A complementary business theme will<br />
be retained to provide options for future<br />
business through selective exposure to<br />
exploration outside of Australia.<br />
<strong>Woodside</strong> Petroleum Ltd | Annual Report 2009
Chairman’s overview<br />
The quality of our people at all levels allows us to look to the future with confidence<br />
The year 2009 may well be remembered,<br />
at least in Australia, as one in which the<br />
liquefied natural gas industry captured the<br />
public’s imagination.<br />
With large numbers of conventional and<br />
non-conventional LNG projects around<br />
Australia at various stages of development,<br />
the industry stood out as a hive of activity<br />
at a time many other sectors of the<br />
economy were in recession as a result of<br />
the global financial crisis.<br />
Members of the public could easily be<br />
excused for thinking the LNG industry is<br />
new to Australia.<br />
On the contrary, in 2009 <strong>Woodside</strong><br />
celebrated 20 years of production of LNG<br />
from the North West Shelf Project, during<br />
which time we have loaded more than<br />
2800 cargoes. This anniversary served as<br />
a pertinent reminder of our company’s<br />
pioneering role in the industry.<br />
The release during the year of a <strong>report</strong> on<br />
the economic impact of the North West<br />
Shelf, timed to coincide with 25 years of<br />
pipeline gas production and 20 years of<br />
LNG production, illustrated the enormous<br />
contribution this project has made to<br />
Australia.<br />
According to the <strong>report</strong>, the North West<br />
Shelf has contributed $70 billion to the<br />
nation’s gross domestic product. Annual<br />
federal, state and local government<br />
revenues are in the order of $5 billion a<br />
year.<br />
Today, <strong>Woodside</strong> has a presence across<br />
the development timescale of LNG<br />
projects.<br />
At the North West Shelf, we have an<br />
extensive track record as a proven, reliable<br />
and safe operator with an international<br />
reputation to match.<br />
At Pluto, we are close to completing the<br />
construction of our first LNG train and<br />
have entered the front-end engineering<br />
and design phase for an expansion of the<br />
project.<br />
At Browse and Sunrise, we have the<br />
opportunity to further significantly<br />
enhance our LNG portfolio. Both of these<br />
developments made strong progress in<br />
2009.<br />
This time last year I commented that, even<br />
during periods of economic downturn,<br />
good businesses should remain profitable.<br />
The past year demonstrated <strong>Woodside</strong>’s<br />
robustness in this regard.<br />
In spite of the economic difficulties, the<br />
company recorded a profit of $1.82 billion,<br />
2% higher than that earned in 2008 during<br />
a period of record oil prices.<br />
The Board of Directors declared a fully<br />
franked final dividend of 55 cents per<br />
share, resulting in a full-year dividend of<br />
110 cents per share.<br />
We go into 2010 with a healthy balance<br />
sheet, having received strong support from<br />
banks, the bond market and, in our recent<br />
rights issue, equity investors. <strong>Woodside</strong> is<br />
in a sound financial position.<br />
On the political front two issues continue<br />
to be of particular concern to the board.<br />
At the time this <strong>report</strong> was published, the<br />
fate of the Commonwealth Government’s<br />
proposed Carbon Pollution Reduction<br />
Scheme remained unknown. While we<br />
recognise the significant improvements<br />
made to the scheme since the Green<br />
Paper was released in July 2008,<br />
<strong>Woodside</strong> has been vocal in pointing out<br />
that placing a carbon price on Australian<br />
LNG will put our industry at a disadvantage<br />
relative to any international competitors<br />
who are not similarly burdened. To the<br />
extent that this results in our potential<br />
customers continuing to use carbonintensive<br />
fuels rather than cleaner LNG, it<br />
will result in a net increase in greenhouse<br />
emissions.<br />
Michael Chaney, AO<br />
Michael has been on <strong>Woodside</strong>’s Board since 2005 and Chairman since 31 July 2007.<br />
Secondly, we remained concerned about<br />
the prospect of increased industrial<br />
disruption in our industry following the<br />
enactment of new Commonwealth<br />
workplace legislation. The Australian LNG<br />
sector has enjoyed relative workplace<br />
harmony for several years and this has<br />
been a central factor in developing and<br />
maintaining our reputation internationally<br />
as a reliable supplier. Any change to this<br />
risks damaging the sector’s standing with<br />
customers.<br />
As we celebrated 20 years of North West<br />
Shelf LNG production, we were pleased<br />
during the year to take the opportunity to<br />
name our first <strong>Woodside</strong>-branded LNG<br />
ship the '<strong>Woodside</strong> Donaldson', in honour<br />
of Geoff Donaldson, whom many would<br />
regard as the father of the company.<br />
Geoff chaired <strong>Woodside</strong> from soon after<br />
its creation in 1954 until he retired 28<br />
years later. At 96 years old he has reason<br />
to be proud of the company’s status as a<br />
successful, independent Australian oil and<br />
gas company.<br />
I take this opportunity to thank all our<br />
employees, led by Chief Executive Officer<br />
Don Voelte, for their efforts on behalf of the<br />
company; and I thank my fellow directors<br />
for their ongoing dedication and support.<br />
The quality of our people at all levels allows<br />
us to look to the future with confidence.<br />
Overview<br />
3
4<br />
Title CEO <strong>report</strong><br />
We started 2009 in the shadow of the global financial crisis, yet <strong>Woodside</strong><br />
continued to build on its reputation as a world-class LNG leader<br />
In the same way well built ships come<br />
into their own in rough weather, well built<br />
companies prove themselves in rough<br />
economic conditions.<br />
The global financial crisis that gripped<br />
the world in 2009 reaffirmed <strong>Woodside</strong>’s<br />
position as a quality company with<br />
outstanding people, a robust long-term<br />
business strategy and excellent assets.<br />
Throughout this economic downturn we<br />
have kept our people, stood firmly by our<br />
strategy and continued to aggressively<br />
develop our assets. It is pleasing for me<br />
to <strong>report</strong> to shareholders our success on<br />
these three fronts.<br />
It also pleases me that, at the same time<br />
we made great gains in our LNG growth<br />
strategy, we produced a very solid profit<br />
for our shareholders.<br />
Our employees did a great job of<br />
converting revenue to the bottom line in<br />
this weaker commodity price environment.<br />
Our profit in 2009 of $1.82 billion was a<br />
new record.<br />
Our growth ambitions would amount<br />
to nothing unless we had the financial<br />
capacity to make them happen, so our<br />
ability to readily access global capital<br />
markets to fund our LNG growth portfolio<br />
has been a highlight of 2009.<br />
Support from the capital markets<br />
recognised the extensive appetite of<br />
lenders to provide funding to bring on<br />
<strong>Woodside</strong>’s growth portfolio.<br />
The past year saw us raise approximately<br />
$5.8 billion in additional debt and equity.<br />
This figure excludes the proceeds from<br />
the sale of our interest in the Otway gas<br />
project (expected to be completed in<br />
Q1 2010) and approximately $1.2 billion<br />
received in early February 2010 from<br />
the closure of the retail portion of our<br />
accelerated equity rights issue.<br />
In many ways, this has been the most<br />
satisfying year since my appointment as<br />
CEO in 2004. In difficult conditions, our<br />
people demonstrated why <strong>Woodside</strong><br />
continues to be regarded as one of the<br />
world’s premier independent oil and gas<br />
companies.<br />
Health and safety improves<br />
Nothing is more important at <strong>Woodside</strong><br />
than keeping our people safe, and I’m<br />
pleased that our focus on health and safety<br />
in 2009 produced outstanding results.<br />
We were successful in embedding the<br />
<strong>Woodside</strong> safety culture throughout all our<br />
activities.<br />
To emphasise the company’s determination<br />
to make every day a perfect safety day,<br />
in 2009 I elevated the health and safety<br />
function to <strong>report</strong> directly to the CEO.<br />
I am pleased to <strong>report</strong> that our leading<br />
indicator of safety performance, total<br />
recordable case frequency, or TRCF,<br />
has improved to 3.3 per million hours<br />
worked against a target of 3.8, and a 2008<br />
performance of 4.3.<br />
We have had outstanding safety results in<br />
our overseas construction sites and must<br />
continue to transfer the learnings to our<br />
Australian operations. We will continue<br />
to work towards our goal of ‘no-one gets<br />
hurt, no incidents’.<br />
Operational overview<br />
Our foundation business continues to<br />
underpin our LNG growth ambitions.<br />
Despite all of our oil assets being in natural<br />
field decline, and no new project start-ups<br />
in 2009, our full year production was a<br />
solid 80.9 million barrels of oil equivalent<br />
Don Voelte<br />
MANAGING DIRECTOR AND CHIEF ExECUTIVE OFFICER<br />
(MMboe). This was only marginally lower<br />
than our 2008 record of 81.3 MMboe.<br />
The North West Shelf Venture (NWSV)<br />
with five trains operating at full capacity,<br />
delivered record production in 2009.<br />
The redevelopment of the North Rankin<br />
platform remains on schedule and on<br />
cost for first production in 2013, and a<br />
front-end engineering and design (FEED)<br />
decision on the Greater Western Flank gas<br />
development is expected in 2010.<br />
Both of these projects will ensure that<br />
peak production is maintained at the NWS<br />
facilities well into the next decade. Our<br />
goal for the NWS facilities is to continue to<br />
improve on the new performance baseline<br />
set in 2009.<br />
While our focus going forward is on<br />
LNG, we remain a substantial producer<br />
of oil, and oil remains an important part<br />
of <strong>Woodside</strong>. Almost all our oil assets<br />
have delivered new production wells this<br />
year and currently offer further similar<br />
opportunities in the next few years.<br />
LNG growth continues<br />
<strong>Woodside</strong>'s growth will come from the<br />
company’s exposure to significant natural<br />
Tower under construction at Pluto LNG Park<br />
Don has been with <strong>Woodside</strong> since April 2004 and has more than 35 years of global experience in the oil and<br />
gas industry.<br />
<strong>Woodside</strong> Petroleum Ltd | Annual Report 2009
gas assets and infrastructure in Australia.<br />
At Pluto, our phase one project went from<br />
42% complete at the beginning of the<br />
year to 83% complete by year end. The<br />
performance on this project makes me<br />
very proud.<br />
In an industry where long delays and<br />
massive cost overruns are commonplace,<br />
I’m pleased to <strong>report</strong> the Pluto foundation<br />
project in progressing quickly and is<br />
expected to have a final cost of 6% to 10%<br />
over the initial $11.2 billion budget.<br />
We continue to work extremely hard to<br />
contain costs at Pluto.<br />
Of course, we have no intention of resting<br />
on our laurels at Pluto after we complete<br />
work on the foundation project, and in<br />
November we initiated FEED for Pluto<br />
Trains 2 and 3.<br />
In October 2009 we commenced our<br />
20-plus exploration well campaign in the<br />
Carnarvon basin for the gas to feed Pluto<br />
Trains 2 and 3. With the Martell discovery<br />
earlier in the year, the Eris discovery in<br />
November, and the arrival of the new<br />
drilling rig, the Maersk Discoverer in<br />
December 2009, we aim to be in a position<br />
to make a final investment decision (FID)<br />
on Train 2 by the end of 2010 and Train 3 by<br />
the end of 2011.<br />
Our Browse development continued<br />
to make huge strides in 2009 and we<br />
welcomed the recent announcement<br />
by the Joint Authority and the Minister<br />
for Mines and Petroleum regarding the<br />
renewal terms for the Browse retention<br />
leases.<br />
The renewal terms require the joint<br />
venture to undertake a $1.25 billion work<br />
program to place it in a position to make<br />
a FID by mid 2012. On 9 February 2010<br />
the joint venture participants selected the<br />
Western Australian Government's Browse<br />
LNG precinct near James Price Point in the<br />
Kimberley region as the location for the<br />
project's onshore plant.<br />
Our Sunrise development is also making<br />
excellent progress. After exploring and<br />
assessing five development concepts<br />
for the Greater Sunrise fields, including<br />
Darwin LNG, Floating LNG and an<br />
onshore LNG facility in Timor–Leste, the<br />
joint venture has narrowed the selection<br />
to Floating LNG or Darwin LNG as the<br />
preferred development options.<br />
The joint venture is now preparing a field<br />
development plan for submission to both<br />
the Australian and Timor–Leste regulators.<br />
The approval of this plan is an important<br />
precursor to an FID on the Greater Sunrise<br />
fields.<br />
Looking forward<br />
There are signs that economies around<br />
the world are starting to expand again,<br />
led by resurgence in Asia. Oil prices have<br />
recovered from their lows in early 2009<br />
and, despite current global economic<br />
conditions, the fundamental drivers for<br />
medium and long term LNG demand<br />
remain strong for both the Asia-Pacific and<br />
Atlantic basins.<br />
Recession-moderated forecasts still<br />
indicate that LNG demand will double<br />
through 2009 to 2020. <strong>Woodside</strong>’s LNG<br />
portfolio provides a unique opportunity<br />
to deliver outstanding and sustained<br />
shareholder wealth.<br />
Execution capabilities have now become<br />
paramount in delivering our LNG growth<br />
ambitions. The ability to deploy the<br />
appropriate skills and experience, as well<br />
as the technology and innovation required<br />
for developing remote deepwater fields,<br />
will remain keys to <strong>Woodside</strong>’s future<br />
success.<br />
While mindful of the challenges that lie<br />
ahead, we have a demonstrated track<br />
record on delivering and we relish the<br />
opportunity to repeat it again and again.<br />
We will continue to drive forward the<br />
development of our world class resources<br />
at Browse and Sunrise. We look forward<br />
to first gas at the Pluto LNG Project and<br />
exploration success which will help us<br />
create further value from the expansion<br />
opportunities we have at Pluto.<br />
To all our employees and contractors<br />
at <strong>Woodside</strong> I would like to take this<br />
opportunity to thank you for the special<br />
year you helped deliver in 2009.<br />
2005-2009 - Indexed growth<br />
5 Year total shareholder return (%) 50<br />
0<br />
400<br />
North West Shelf Karratha Gas Plant LNG loading jetty<br />
<strong>Woodside</strong><br />
0<br />
03/01/2005<br />
Total shareholder return (TSR)<br />
performance against peers<br />
<strong>Woodside</strong>’s peer group comprises the following companies: Anadarko, Apache,<br />
BG, CNOOC, Marathon, Murphy, Pioneer, Repsol, Santos and Talisman.<br />
Source: Bloomberg, 5 year average, <strong>annual</strong>ised, USD.<br />
mtpa<br />
45<br />
0<br />
<strong>Woodside</strong><br />
Chevron<br />
Share price performance<br />
Shell<br />
ExxonMobil<br />
BP<br />
Total<br />
<strong>Woodside</strong><br />
Oil (WTI)<br />
All Ords<br />
Potential operated LNG capacity to 2019<br />
(excludes national oil companies)<br />
Equity Source: Poten & Partners (September 2009)<br />
Tonnes\US$ million market capitalisation<br />
700<br />
0<br />
<strong>Woodside</strong><br />
BG<br />
Shell<br />
Total<br />
Chevron<br />
BP<br />
2009<br />
2014<br />
2019<br />
BG<br />
Ratio of tonnes of LNG equity<br />
to market capitalisation<br />
(excludes National Oil Companies)<br />
2009<br />
2014<br />
2019<br />
Equity Source: Poten & Partners (September 2009)<br />
Market Capitalisation Source: Bloomberg (30 September 2009)<br />
ConocoPhillips<br />
31/12/2009<br />
2009<br />
2014<br />
2019<br />
ConocoPhillips<br />
2009<br />
2014<br />
2019<br />
ExxonMobil<br />
Overview<br />
5
6<br />
CFO <strong>report</strong><br />
LNG growth continued in 2009 with record levels of investment and profit<br />
Expenditure ($ million)<br />
6,000<br />
Net debt ($ million)<br />
0<br />
20.4<br />
895<br />
Investment in growth<br />
LNG growth<br />
Exploration<br />
Foundation business<br />
2005<br />
2006 2007 2008 2009<br />
26.4<br />
1,507<br />
Net debt<br />
14.9<br />
894<br />
29.6 29.8<br />
2,816<br />
4,178<br />
2005 2006 2007 2008 2009<br />
In 2009 <strong>Woodside</strong> achieved <strong>report</strong>ed net<br />
profit of $1.824 billion and underlying profit<br />
of $1.906 billion. In addition we invested a<br />
record $5.7 billion in our business, while<br />
raising approximately US$3.3 billion in<br />
debt, approximately $770 million through<br />
the dividend reinvestment plan (DRP) and<br />
launching a $2.5 billion equity raising.<br />
The impact of lower commodity prices and<br />
the revaluation of our US dollar debt had<br />
Gearing (%)<br />
opposing but material outcomes on our<br />
2009 financial results.<br />
With the average WTI in 2009 being<br />
approximately US$38 per barrel less than<br />
in 2008, revenue was negatively impacted<br />
by $1.9 billion while the revaluation of our<br />
US denominated debt resulted in a gain of<br />
$886 million.<br />
Robust balance sheet<br />
<strong>Woodside</strong> enters 2010 with $2.9 billion<br />
of cash and undrawn debt and a further<br />
$1.2 billion received in early 2010 from<br />
the conclusion of the retail portion of the<br />
equity raising. Sales proceeds are also<br />
expected in Q1 2010 from the divestment<br />
of the Otway Gas Project. We are<br />
therefore well positioned to fund our LNG<br />
growth plans.<br />
Funding<br />
At the time we took FID on Pluto we made<br />
the decision to fund the project through a<br />
combination of operating cashflow, debt,<br />
and the use of the fully underwritten DRP.<br />
We subsequently complemented that with<br />
the divestment of the Otway Gas Project.<br />
We also stated that we would need a<br />
compelling reason before we would<br />
approach our shareholders for equity.<br />
That compelling reason occurred on<br />
2 December 2009 with the announcement<br />
by the Federal and Western Australian<br />
Governments that the renewal of the<br />
Browse retention leases was conditional<br />
on the joint venture undertaking a<br />
$1.25 billion work program to enable<br />
an FID by mid-2012. Given this<br />
development, the company took the<br />
decision to de-leverage the balance<br />
sheet in preparation for undertaking the<br />
large capital expenditure program which<br />
would be required by a Browse FID. On<br />
14 December 2009 we announced a<br />
$2.5 billion fully underwritten 1 for 12<br />
accelerated renounceable entitlement<br />
offer, which closed successfully in early<br />
February 2010.<br />
Mark Chatterji<br />
ExECUTIVE VICE PRESIDENT AND CHIEF FINANCIAL OFFICER<br />
Drivers of <strong>Woodside</strong>’s 2009 profit<br />
versus 2008 profit<br />
Revenue from sale of goods –<br />
decreased by $1638 million<br />
Lower gas and liquids prices in 2009<br />
reduced revenue by $1909 million. This<br />
was partially offset by a weaker average<br />
AUD against the USD, $270 million.<br />
While sales volumes were 0.5 MMboe<br />
higher in 2009, the product mix reflected<br />
lower liquid and higher gas sales. The<br />
change in product mix reduced revenue by<br />
$250 million.<br />
During 2009, approximately 4.4 million<br />
barrels of Greater Exmouth Area crude<br />
oil zero cost collars settled, resulting in a<br />
hedging gain of $28 million compared to a<br />
loss of $220 million in 2008.<br />
External factors<br />
Avg WTI oil price<br />
US$/bbl<br />
2009 2008 Change<br />
62.0 99.9<br />
Avg AUD:USD 0.78 0.84<br />
Closing AUD:USD 0.89 0.69<br />
Avg one month<br />
LIBOR* %<br />
Avg derived oil<br />
price A$/bbl<br />
*London Inter-Bank Offer Rate<br />
Realised price per boe<br />
0.3 2.7<br />
79.5 118.9<br />
2009 2008 Change<br />
US$/boe US$/boe<br />
Pipeline gas 16.7 20.6<br />
LNG 36.1 61.8<br />
Condensate 57.6 73.1<br />
LPG 64.7 65.1<br />
Oil 61.0 91.6<br />
Average realised<br />
price (US$/boe)<br />
Average realised<br />
price (A$/boe)<br />
43.0 64.0<br />
55.1 76.3<br />
Mark has held senior finance and commercial roles over the past 12 years. He has been with <strong>Woodside</strong> since<br />
2004 and became CFO in 2007.<br />
<strong>Woodside</strong> Petroleum Ltd | Annual Report 2009
$ million<br />
2,250<br />
2,000<br />
1,750<br />
1,500<br />
1,250<br />
1,000<br />
750<br />
500<br />
250<br />
0<br />
(250)<br />
(500)<br />
1, 786<br />
NPAT (2008)<br />
(1,639)<br />
Price and exchange<br />
Drivers of <strong>Woodside</strong>'s 2009 <strong>report</strong>ed<br />
net profit after tax (NPAT)<br />
(250)<br />
Sales volume<br />
(1) Cost of Sales includes production costs, royalties and excise, insurance, inventory movement, shipping, depreciation and<br />
amortisation.<br />
(2) Petroleum and Resources Rent Tax.<br />
Costs of sales – decreased by<br />
$92 million<br />
Revenue<br />
251<br />
Hedge gains<br />
92<br />
Lower production costs at Laminaria–<br />
Corallina, Mutineer–Exeter, Stybarrow,<br />
Goodwyn A platform and North Rankin A<br />
platform offset the increase in production<br />
costs at Vincent as a result of the fire in<br />
a gas compression unit, and additional<br />
costs associated with the first full year of<br />
production from NWSV Train 5 and Angel,<br />
$2 million.<br />
Royalties and excise costs decreased in<br />
line with lower sales revenue, $160 million.<br />
The timing of cargo liftings resulted in an<br />
unfavourable stock movement, $13 million.<br />
Shipping costs decreased in 2009 in line<br />
with a lower number of diverted cargoes,<br />
$21 million.<br />
Depreciation and amortisation expense<br />
increased by $88 million in 2009. While<br />
depreciation varies across facilities from<br />
year to year in line with production, the<br />
main change to depreciation in 2009 was<br />
at Laminaria–Corallina following successful<br />
start-up of the Corallina-2 development well.<br />
Other income — increased by<br />
$1180 million<br />
This result was primarily influenced by a<br />
foreign exchange gain of $886 million as at<br />
31 December 2009 on US denominated<br />
debt partially offset by hedge of net<br />
investment adjustments, compared to a<br />
loss in 2008 of $282 million.<br />
Cost of sales (1)<br />
1,180<br />
Other income<br />
(61)<br />
Other expenses<br />
(70)<br />
Income tax<br />
529<br />
PRRT (2)<br />
6<br />
Minority interest<br />
Other expenses — net decrease of<br />
$61 million<br />
1,824<br />
This result was primarily influenced by:<br />
reduction in general and administrative<br />
costs, $56 million (as part of a broader<br />
cost reduction program in 2009)<br />
lower exploration and evaluation<br />
expense, $28 million<br />
reduction in impairment of other oil<br />
and gas properties from 2008,<br />
$104 million<br />
impairment of exploration, evaluation<br />
and other assets in Libya, $91 million<br />
loss on derivative financial instruments,<br />
$65 million, due to an unfavourable fair<br />
value revaluation of interest rate swaps<br />
and Greater Exmouth Area hedges,<br />
compared to a gain in 2008 of<br />
$99 million.<br />
Income tax costs – increased by<br />
$70 million<br />
This was predominantly due to write down<br />
of deferred tax assets ($40 million) coupled<br />
with higher foreign tax losses.<br />
NPAT (2009)<br />
Petroleum resource rent tax (PRRT) –<br />
decreased by $529 million<br />
PRRT expense decreased primarily due to<br />
lower revenues and higher augmentation<br />
on Pluto spend.<br />
Underlying NPAT versus <strong>report</strong>ed NPAT<br />
Net profit after tax (NPAT)<br />
Underlying net profit<br />
after tax (NPAT)<br />
Significant items after tax<br />
Lifting Costs (A$/boe)<br />
5.66<br />
1.91<br />
2005<br />
6.13<br />
2.43<br />
Lifting Costs<br />
5.87<br />
2.93<br />
2009<br />
$m<br />
Libya writeoff (91)<br />
Sale of exploration permit<br />
equity<br />
7.77<br />
3.93<br />
2008<br />
$m<br />
1,906 1,832<br />
Oceanway writeoff (6) (78)<br />
Pluto Equity sell down 19<br />
Sale of Vermillion and<br />
High Island<br />
15<br />
8.53<br />
3.35<br />
Gas Oil*<br />
2006 2007 2008 2009<br />
(12)<br />
Sale of Geodynamics 13<br />
Success fee on Kitan<br />
(Jahal kuda tasi)<br />
NPAT as <strong>report</strong>ed 1,824 1,786<br />
Minority interest decreased by<br />
$6 million<br />
This was due to foreign currency<br />
revaluation losses attributable to Kansai<br />
Electric and Tokyo Gas' minority interest in<br />
various Pluto LNG companies.<br />
Lifting costs<br />
Total gas lifting costs decreased to<br />
$177 million from $186 million in 2008.<br />
On a unit basis gas lifting costs decreased<br />
15% to $3.35/boe (excluding Ohanet)<br />
largely as a result of reduced costs at<br />
the Karratha Gas Plant and increased<br />
production at Otway and NWS.<br />
Total oil lifting costs decreased to<br />
$221 million from $245 million in 2008.<br />
On a unit basis, oil lifting costs increased<br />
to $8.53/bbl as a result of repair works<br />
following the fire in the gas compression<br />
unit at Vincent and maintenance on the gas<br />
lift riser shutdown at Enfield, coupled with<br />
reduced production from our oil fields due<br />
to natural field decline.<br />
*Excluding FPSO service contract costs<br />
12<br />
Overview<br />
7
8<br />
450<br />
mtpa<br />
mtpa<br />
0<br />
LNG markets<br />
Contract extensions with all our original NWS customers are a testament to the strong<br />
relationships we share<br />
2009<br />
Global LNG demand and supply forecast<br />
Supply:<br />
Proposed - rest of world<br />
Proposed - Australia<br />
Operational and under construction<br />
Range of third party demand forecasts<br />
2010<br />
2011<br />
2012<br />
2013<br />
2014<br />
Source: Supply data is a <strong>Woodside</strong> view. Demand forecast from various<br />
sources including WoodMacKenzie, Cambridge Energy Research Associates<br />
and FACTS Global Energy<br />
2015<br />
2016<br />
2017<br />
Long-term demand growth<br />
2018<br />
Indicative industry pricing into Asia-Pacific<br />
Japan Custom Cleared oil price<br />
2019<br />
High 2007<br />
Oil Parity<br />
Transitional 2008<br />
2009<br />
2005<br />
Recent impacts of the global financial<br />
crisis on the LNG market and increases<br />
in US domestic gas supplies have not<br />
significantly altered our expectation of<br />
robust long-term LNG demand growth.<br />
2020<br />
At an average growth rate of 7% per<br />
annum, demand will approximately double<br />
between 2009 and 2020 from about<br />
190 mtpa to about 380 mtpa.<br />
This view reflects many independent<br />
forecasts of global LNG demand. It is<br />
underpinned by population growth, rising<br />
standards of living and importantly the<br />
increasing emphasis world-wide on the<br />
use of cleaner energy sources. LNG is<br />
competitively positioned relative to other<br />
hydrocarbon fuels.<br />
Long-term growth in LNG demand is<br />
uneven across and within the two major<br />
regional markets of the Asia-Pacific and<br />
Atlantic basin. A closer look at our core<br />
target market of the Asia-Pacific shows<br />
that the traditional markets of Japan,<br />
Korea and Taiwan continue to be dominant<br />
in terms of market share. However, the<br />
emerging markets of India and China<br />
combined with new markets, including<br />
Singapore, Thailand and Pakistan, are<br />
expected to have a considerably higher<br />
rate of demand growth. Our view is that<br />
the demand in this region from both<br />
traditional and non-traditional markets is<br />
sufficient to support all of our projects.<br />
Market to tighten in next few years<br />
In the short term, the market is arguably<br />
well-supplied. This is due to the slowing<br />
of demand growth in the wake of the<br />
global financial crisis, the increase in gas<br />
supply from the start up of a number of<br />
new supply projects over a relatively short<br />
period of time and increased production of<br />
unconventional gas in the US.<br />
In the longer term, the world still needs a<br />
new Browse or Gorgon-sized LNG project<br />
every year in order to meet expected<br />
growth in LNG demand, especially in light<br />
of declining production from some legacy<br />
projects.<br />
During 2009 the Gorgon and PNG LNG<br />
projects moved into construction phase.<br />
These decisions followed a very lean<br />
period for commitment to new greenfield<br />
supply – only Pluto, Angola and Peru have<br />
achieved FID during 2006 to 2008.<br />
Reinhardt Matisons<br />
PRESIDENT MARKETING<br />
Reinhardt has 28 years industry experience and joined <strong>Woodside</strong> in 1996.<br />
Globally, there are a large number of new<br />
projects under discussion. Even a one year<br />
delay of a small number of the proposed<br />
projects or those under construction could<br />
result in a supply-constrained market. We<br />
expect that the global market will tighten<br />
from about 2012. The strong interest<br />
<strong>Woodside</strong> continues to receive in the<br />
earliest start up of Pluto Trains 2 and 3 is<br />
evidence that many customers share a<br />
similar view.<br />
<strong>Woodside</strong> is well positioned to be<br />
a leading supplier<br />
A significant proportion of proposed<br />
new global LNG supply will come from<br />
Australian projects. Indeed, with the Qatari<br />
moratorium on new projects, Australia<br />
is recognised as having the potential to<br />
become the leading new LNG supply<br />
country. The Australian Government's<br />
clearly stated support for the industry and<br />
the continuation of Australia's relatively<br />
stable political and fiscal regimes will<br />
provide the environment to achieve further<br />
growth in Australian LNG supply.<br />
Given our extensive experience in<br />
developing, constructing and operating<br />
LNG projects, together with our strong<br />
relationships with government and<br />
customers in the region, <strong>Woodside</strong> is<br />
well-placed to proceed with its portfolio<br />
of offshore projects, which will access<br />
conventional gas. In doing so we continue<br />
to play a leading role in the industry, both<br />
in Australia and more widely.<br />
Robust long-term Asia-Pacific LNG<br />
pricing continues<br />
Based on our long-term view of the global<br />
LNG supply-demand balance, our outlook<br />
for long-term Asia-Pacific pricing remains<br />
strong (Asia-Pacific contracts represent<br />
more than 85% of our LNG portfolio).<br />
This view is supported by recent longterm<br />
LNG deals in the region which are<br />
continuing to achieve very high indexation<br />
to movements in crude oil prices.<br />
<strong>Woodside</strong> Petroleum Ltd | Annual Report 2009
'<strong>Woodside</strong> Donaldson', Samsung Heavy Industry Goeje shipyard, South Korea, 28 September 2009<br />
Spot sales balance market<br />
Spot sales (short-term sales of a small<br />
number of cargoes over a period of less<br />
than a year) now account for approximately<br />
20% of the global LNG market, or about<br />
40 mtpa. The healthy growth of short-term<br />
trade is a welcome development for us as<br />
spot markets help both buyers and sellers<br />
deal with uncertainties such as weather<br />
and technical issues such as the ramp-up<br />
profiles of new projects.<br />
In terms of pricing, we have seen some<br />
cycling of spot prices. In 2009 we have<br />
been very pleased by the pricing levels we<br />
have achieved for our NWS spot cargoes.<br />
This gives us confidence for further<br />
spot sales in 2010 from NWS and for<br />
uncommitted Pluto volumes from 2011.<br />
Value-adding shipping<br />
During 2009 our first 100% equity LNG<br />
vessel, the '<strong>Woodside</strong> Donaldson' was<br />
launched.<br />
This vessel has been chartered for an initial<br />
period of 15 years to deliver our Pluto<br />
volumes. It is part of a fleet of three joint<br />
venture controlled ships operating on an<br />
integrated low cost basis. The '<strong>Woodside</strong><br />
Donaldson' is instantly recognisable with<br />
three Kangaroos painted on each side.<br />
For our new projects we will develop<br />
shipping strategies that reflect our longterm<br />
view of the shipping market. As for<br />
Pluto, this may involve construction of<br />
new project ships, and there is currently<br />
ample shipyard capacity available for<br />
this. World shipping capacity currently<br />
exceeds demand and as a consequence<br />
very reasonably priced time-charters are<br />
available in the mid-term.<br />
The current shipping market therefore<br />
provides us with options for our new<br />
projects that will allow us to continue<br />
to add value through our involvement in<br />
shipping.<br />
Investing in long-term relationships<br />
In early December we celebrated 20 years<br />
of continuous, safe and reliable supply with<br />
our Japanese customers. This is a major<br />
achievement by global LNG standards. It<br />
is testimony to our good relationships with<br />
these customers that all of our original<br />
1985 NWS customers have extended their<br />
contracts.<br />
We continue to leverage our long-term<br />
NWS relationships for our new projects.<br />
Osaka Gas is an equity participant in<br />
Sunrise and more recently Tokyo Gas<br />
and Kansai Electric have joined us as<br />
participants in Pluto. We value and<br />
respect these companies as joint venture<br />
participants and we look forward to<br />
working with them to progress our<br />
projects.<br />
An example of the investment we continue<br />
to make in these relationships are <strong>annual</strong><br />
staff exchanges with Japanese customers<br />
'<strong>Woodside</strong> Donaldson' on its maiden cargo voyage<br />
dating back to the early 1990s. These have<br />
created a network of personal connections<br />
that has benefited both sides and will<br />
continue to do so for years into the future.<br />
We take our role in the region very<br />
seriously and actively engage with all of<br />
our existing and potential customers.<br />
We have overseas offices in Japan,<br />
South Korea and China to support these<br />
engagements. It is part of our LNG history<br />
in the region that <strong>Woodside</strong> has had incountry<br />
representation in Tokyo for more<br />
than 25 years, in Seoul since 2004 and in<br />
Beijing since 2005.<br />
<strong>Woodside</strong> Marketing Office<br />
Traditional markets:<br />
Continue to dominate global LNG demand<br />
Developing markets:<br />
India and China have strong growth in demand<br />
Market entrants:<br />
Thailand, Singapore, Pakistan and Kuwait<br />
Overview<br />
9
10<br />
Reserves statement<br />
Key reserve changes<br />
•<br />
•<br />
(1) Proved reserves of 1295.9 MMboe<br />
decreased by 31.8 MMboe as <strong>annual</strong><br />
production (5) (78.8 MMboe) was partially<br />
offset by upward revisions of 32.5 MMboe<br />
at Pluto–xena, 10.3 MMboe in the Enfield,<br />
Mutineer–Exeter, Vincent and Laminaria-<br />
Corallina oil fields, 5.9 MMboe in the North<br />
West Shelf oil and gas fields and 3.5 MMboe<br />
at Otway. Downward revisions at Neptune<br />
and other fields in the United States<br />
comprised 5.5 MMboe.<br />
Proved plus Probable reserves of<br />
1651.2 MMboe, decreased by 52.0 MMboe<br />
largely due to <strong>annual</strong> production. Reserves<br />
maturation of 19.9 MMboe at Pluto–xena,<br />
and upward revisions of 8.2 MMboe in<br />
the North West Shelf oil and gas fields<br />
and 5.9 MMboe at Otway were offset<br />
by downward revisions of 8.4 MMboe at<br />
Neptune and other fields in the United<br />
States.<br />
Proved plus Probable reserves<br />
25.8%<br />
47.3%<br />
26.9%<br />
Developed<br />
Pluto (undeveloped)<br />
Other (undeveloped)<br />
<strong>Woodside</strong>’s reserves overview<br />
Feisal Ahmed<br />
ExECUTIVE VICE PRESIDENT PROJECT DEVELOPMENT<br />
Feisal has 34 years industry experience and has been with <strong>Woodside</strong> since February 2007.<br />
2009 2008 % Change<br />
Proved (2) MMboe 1,295.9 1,327.7 -2.4%<br />
Proved plus Probable (3) MMboe 1,651.2 1,703.2 -3.1%<br />
Contingent Resources (4) MMboe 1,866.6 1,939.6 -3.8%<br />
Key metrics Proved<br />
Proved<br />
plus Probable<br />
2009 Reserves Replacement Ratio (6) % 60 34<br />
Organic 2009 Reserves Replacement Ratio (6) % 60 34<br />
3yr Reserves Replacement Ratio including A&D (i) % 146 132<br />
3yr Organic Reserves Replacement Ratio % 146 132<br />
Reserves Life Years 16 21<br />
Annual Production (5)(ii) MMboe 78.8 78.8<br />
Net Acquisitions and Divestments (iii) MMboe 0.0 0.0<br />
(i) Acquisitions and Divestments (ii) 2009 Annual Production for Reserves Statement (iii) Title transfer for Otway to take place in 2010<br />
‘Proved plus Probable’ reserves <strong>annual</strong> reconciliation by product*<br />
(<strong>Woodside</strong> share)<br />
Dry gas (8)<br />
Bcf (10)<br />
Condensate (9)<br />
MMbbl (11)<br />
Oil<br />
MMbbl<br />
Total<br />
MMboe (12)<br />
Reserves as at 31 December 2008 7,883 151.4 168.8 1,703.2<br />
Revision of Previous Estimates (13) 155 6.4 -6.8 26.8<br />
Extensions and Discoveries (14) 0 0.0 0.0 0.0<br />
Acquisitions and Divestments 0 0.0 0.0 0.0<br />
Annual Production -245 -10.0 -25.8 -78.8<br />
Reserves as at 31 December 2009 7,794 147.8 136.1 1,651.2<br />
* Small differences are due to rounding to first decimal place<br />
‘Proved plus Probable’ reserves summary by project*<br />
(<strong>Woodside</strong> share, as at 31 December 2009)<br />
Project<br />
Dry gas<br />
Bcf<br />
Condensate<br />
MMbbl<br />
Oil<br />
MMbbl<br />
Total<br />
MMboe<br />
Pluto–xena 4,146 53.4 0.0 780.7<br />
North West Shelf 3,276 88.8 37.1 700.7<br />
Greater Exmouth 0 0.0 79.0 79.0<br />
Otway 347 4.5 0.0 65.4<br />
Neptune and Gulf of Mexico 20 0.1 10.4 14.0<br />
Laminaria–Corallina 0 0.0 9.2 9.2<br />
Ohanet 5 0.9 0.0 1.7<br />
Mutineer–Exeter 0 0.0 0.4 0.4<br />
Reserves 7,794 147.8 136.1 1,651.2<br />
* Small differences are due to rounding to first decimal place<br />
<strong>Woodside</strong> Petroleum Ltd | Annual Report 2009
Review of assets<br />
North West Shelf Proved<br />
Proved<br />
plus<br />
Probable<br />
Dry gas Bcf 3,020 3,276<br />
Condensate MMbbl 63.3 88.8<br />
Oil MMbbl 15.1 37.1<br />
Dry gas and condensate reserves<br />
decreased primarily due to production<br />
in 2009. Ultimate recovery (7) for dry gas<br />
increased by 24 Bcf (Proved) and 21<br />
Bcf (Proved plus Probable) as a result of<br />
minor increases at the Angel, Echo–Yodel,<br />
Goodwyn, Perseus and Searipple<br />
fields. North Rankin ultimate recoveries<br />
decreased at both confidence levels. Total<br />
condensate ultimate recovery increases<br />
were 1.5 MMbbl (Proved) and 4.4 MMbbl<br />
(Proved plus Probable).<br />
Minor revisions were made to the<br />
Cossack, Wanaea, Lambert and Hermes<br />
fields increasing ultimate recovery of oil by<br />
0.1 MMbbl at the Proved, and 0.2 MMbbl<br />
at the Proved plus Probable level.<br />
Probabilistic aggregation (15) of individual<br />
fields in the North West Shelf accounts for<br />
15% (449 Bcf) of Proved dry gas reserves.<br />
Greater Exmouth Proved<br />
Proved<br />
plus<br />
Probable<br />
Enfield MMbbl 11.5 25.4<br />
Vincent MMbbl 20.4 37.8<br />
Stybarrow–<br />
Eskdale<br />
MMbbl 7.7 15.9<br />
Proved ultimate recovery estimates<br />
increased in Enfield by 2.8 MMbbl and<br />
Vincent by 2.4 MMbbl as a result of field<br />
performance and multi-disciplinary studies.<br />
No revisions were made at the Proved plus<br />
Probable level.<br />
Total reserves for Stybarrow–Eskdale<br />
decreased due to <strong>annual</strong> production.<br />
Other Australia Proved<br />
Laminaria–<br />
Corallina<br />
Mutineer–<br />
Exeter<br />
Otway dry<br />
gas<br />
Otway<br />
condensate<br />
Proved<br />
plus<br />
Probable<br />
MMbbl 5.0 9.2<br />
MMbbl 0.2 0.4<br />
Bcf 207 347<br />
MMbbl 2.7 4.5<br />
Proved oil reserves for Laminaria–Corallina<br />
were fully replaced in 2009 with an upward<br />
revision of ultimate recovery by<br />
4.9 MMbbl at the Proved level and<br />
1.3 MMbbl at the Proved plus Probable<br />
level.<br />
Ultimate recovery at Mutineer–Exeter<br />
increased by 0.2 MMbbl at the Proved<br />
level. Proved plus Probable volumes<br />
decreased by 0.5 MMbbl.<br />
<strong>Woodside</strong>’s share of Otway dry gas and<br />
condensate reserves are included in<br />
<strong>Woodside</strong>’s 2009 Reserves Statement as<br />
title transfer had not occurred as at<br />
31 December 2009. Development studies<br />
continued on Otway during the second half<br />
of 2009 resulting in maturation of reserves<br />
and an upward revision of 19 Bcf (Proved)<br />
and 32 Bcf (Proved plus Probable) dry gas.<br />
United States Proved<br />
Proved<br />
plus<br />
Probable<br />
Neptune oil MMbbl 5.6 9.8<br />
Neptune gas Bcf 4 7<br />
Other US oil MMbbl 0.4 0.7<br />
Other US gas Bcf 8 13<br />
Ultimate recovery of oil at Neptune<br />
decreased by 5.4 MMbbl and 7.8 MMbbl<br />
at the Proved and Proved plus Probable<br />
confidence levels, as a result of field<br />
performance and multi-disciplinary<br />
studies completed during 2009. Dry gas<br />
ultimate recoveries decreased by 3 Bcf at<br />
the Proved and 4 Bcf at the Proved plus<br />
Probable level.<br />
<strong>Woodside</strong>’s petroleum assets in the United<br />
States including Neptune, total nine fields.<br />
Wilcraft jack-up rig drilling the Torosa-6 appraisal well<br />
Greater Pluto Proved<br />
Reserves (MMboe)<br />
Reserves (MMboe)<br />
83<br />
900<br />
2005<br />
99<br />
1,244<br />
2005<br />
Proved reserves<br />
302<br />
265<br />
245<br />
1,193<br />
1,227<br />
1,328<br />
146<br />
1,296<br />
2006 2007 2008 2009<br />
Proved plus Probable reserves<br />
285<br />
1,580<br />
334<br />
1,688<br />
318<br />
1,703<br />
Proved<br />
plus<br />
Probable<br />
Dry gas Bcf 3,156 4,146<br />
Condensate MMbbl 40.7 53.4<br />
Completion of multi-disciplinary studies for<br />
Pluto–xena supported the maturation of<br />
173 Bcf dry gas contingent resources to<br />
reserves at the Proved level and 106 Bcf at<br />
the Proved plus Probable level. The project<br />
remains on schedule for first gas in late<br />
2010.<br />
Africa Proved<br />
Proved<br />
plus<br />
Probable<br />
Ohanet gas Bcf 4 5<br />
Ohanet<br />
condensate<br />
MMbbl 0.9 0.9<br />
<strong>Woodside</strong> has a 15% interest in the<br />
Ohanet project in Algeria (operated by<br />
BHP Billiton) governed by a risk services<br />
contract with Algeria’s national oil<br />
company, Sonatrach. <strong>Woodside</strong> does<br />
not have any share in the sales gas<br />
delivered (16) .<br />
132<br />
1,651<br />
2006 2007 2008 2009<br />
Reserve Replacement Ratio (%)<br />
Reserve Replacement Ratio (%)<br />
Overview<br />
11
12<br />
Reserves statement (continued)<br />
At 31 December 2009, <strong>Woodside</strong>’s share<br />
of contingent resources was<br />
1866.6 MMboe, down from<br />
1939.6 MMboe in 2008. The reductions are<br />
due to revisions in the Greater Browse and<br />
Greater Sunrise fields as part of ongoing<br />
appraisal and development studies and<br />
maturation of contingent resources to<br />
reserves for Otway and Pluto–xena.<br />
New bookings were made in Australia for<br />
the Coniston–Novara oil field (2.8 MMbbl)<br />
and the Argus gas field (66 Bcf). In Brazil<br />
11.8 MMbbl of oil, 82 Bcf of dry gas and<br />
3.8 MMbbl of condensate was added as a<br />
result of the Panoramix discovery.<br />
Contingent resources in <strong>Woodside</strong> are<br />
associated with the following key assets:<br />
Greater Browse: 5892 Bcf dry gas and<br />
154.1 MMbbl condensate. Dry gas and<br />
condensate volumes have decreased<br />
to reflect the results of concept select<br />
studies.<br />
Greater Sunrise: 1717 Bcf dry gas and<br />
75.6 MMbbl condensate. The volumes<br />
were updated in 2009 to reflect<br />
the results of appraisal and multidisciplinary<br />
studies.<br />
Greater Pluto: 449 Bcf dry gas and<br />
5.8 MMbbl condensate. Volumes<br />
have decreased in 2009 as a result of<br />
maturation to reserves.<br />
Western Legend seismic survey vessel<br />
Best estimate contingent resources <strong>annual</strong> reconciliation by product*<br />
(<strong>Woodside</strong> share)<br />
Contingent resources as at<br />
31 December 2008<br />
Dry gas<br />
Bcf<br />
Condensate<br />
MMbbl<br />
Oil<br />
MMbbl<br />
Total<br />
MMboe<br />
9,022 259.5 97.4 1,939.6<br />
Transfer to Reserves -140 -2.2 0.0 -26.8<br />
Revision of Previous Estimates -510 -12.9 9.0 -93.4<br />
Extensions and Discoveries 160 4.4 14.6 47.1<br />
Acquisitions and Divestments 0 0.0 0.0 0.0<br />
Contingent resources as at<br />
31 December 2009<br />
* Small differences are due to rounding to first decimal place<br />
8,531 248.8 121.0 1,866.6<br />
Best estimate contingent resources summary by project*<br />
(<strong>Woodside</strong> share, as at 31 December 2009)<br />
Project<br />
Dry gas<br />
Bcf<br />
Condensate<br />
MMbbl<br />
Oil<br />
MMbbl<br />
Total<br />
MMboe<br />
Greater Browse 5,892 154.1 0.0 1,187.7<br />
Greater Sunrise 1,717 75.6 0.0 376.7<br />
Greater Pluto 449 5.8 0.0 84.6<br />
Greater Exmouth 0 0.5 74.0 74.5<br />
North West Shelf 201 6.2 25.6 67.0<br />
Other (17) 273 6.7 21.4 76.0<br />
Total 8,531 248.8 121.0 1,866.6<br />
* Small differences are due to rounding to first decimal place<br />
<strong>Woodside</strong> Petroleum Ltd | Annual Report 2009
Notes to the Reserves statement<br />
1 ‘Reserves’ are estimated quantities of<br />
petroleum that have been demonstrated to<br />
be producible from known accumulations<br />
in which the company has a material<br />
interest from a given date forward,<br />
at commercial rates, under presently<br />
anticipated production methods, operating<br />
conditions, prices and costs. <strong>Woodside</strong><br />
<strong>report</strong>s reserves net of non-hydrocarbons<br />
not present in sales products and<br />
upstream (offshore) gas required for<br />
production, processing and transportation<br />
to a reference point defined as the inlet<br />
to the downstream (onshore) processing<br />
facility. Downstream fuel and flare<br />
represents 10.9% of total Proved reserves<br />
and 11.0% of total Proved plus Probable<br />
reserves.<br />
2 ‘Proved reserves’ are those reserves<br />
which analysis of geological and<br />
engineering data suggests, to a high<br />
degree of certainty (90% confidence), are<br />
recoverable. There is relatively little risk<br />
associated with these reserves.<br />
3 ‘Probable reserves’ are those reserves<br />
which analysis of geological and<br />
engineering data suggests are more likely<br />
than not to be recoverable. There is at<br />
least a 50% probability that the quantities<br />
actually recovered will exceed the sum of<br />
estimated Proved plus Probable reserves.<br />
4 'Contingent resources' are those quantities<br />
of petroleum estimated, as at a given date,<br />
to be potentially recoverable from known<br />
accumulations, but the applied project(s)<br />
are not yet considered mature due to<br />
one or more contingencies. Contingent<br />
resources may include, for example,<br />
projects for which there are currently no<br />
viable markets, or where commercial<br />
recovery is dependent on technology<br />
under development, or where evaluation<br />
of the accumulation is insufficient to clearly<br />
assess commerciality. <strong>Woodside</strong> <strong>report</strong>s<br />
contingent resources net of the upstream<br />
(offshore) fuel and non-hydrocarbons not<br />
present in sales products. Contingent<br />
resource estimates may not always<br />
mature to reserves and do not necessarily<br />
represent future reserves bookings. All<br />
contingent resource volumes are <strong>report</strong>ed<br />
at the ‘best estimate’ (P50) confidence<br />
level.<br />
5 ‘Annual production’ is the volume of dry<br />
gas, condensate and oil (see Notes 8 and<br />
9) produced during the year and converted<br />
to ‘MMboe’ (see Note 12) for the specific<br />
purpose of reserves reconciliation and the<br />
calculation of <strong>annual</strong> reserves replacement<br />
ratios (see Note 6). The Reserves<br />
Statement Annual Production differs<br />
from production volumes <strong>report</strong>ed in the<br />
company's <strong>annual</strong> and quarterly <strong>report</strong>s<br />
due to differences in the sales product<br />
definitions and the ‘MMboe’ conversion<br />
factors applied.<br />
6 The term ‘reserves replacement ratio’<br />
means reserves change during the year,<br />
before the deduction of production,<br />
divided by production during the year. The<br />
term ‘three-year reserves replacement<br />
ratio’ means reserves change over the<br />
three years, before the deduction of<br />
production for that period, divided by<br />
production during the same period. The<br />
term ‘organic <strong>annual</strong> reserves replacement<br />
ratio’ means reserves change during the<br />
year, before the deduction of production<br />
and adjustment for acquisition and sales,<br />
divided by production during the year.<br />
7 The term ‘ultimate recovery’ means<br />
resource volumes which will ultimately<br />
be economically produced and equals<br />
production to date plus reserves plus non<br />
saleable non-hydrocarbons plus future own<br />
use offshore fuel and flare.<br />
8 ‘Dry gas’ is defined as ‘C4 minus’<br />
petroleum components including nonhydrocarbons.<br />
These volumes include LPG<br />
(propane and butane) resources. Dry gas<br />
reserves include ‘C4 minus’ hydrocarbon<br />
components and non-hydrocarbon<br />
volumes that are present in sales products.<br />
9 ‘Condensate’ is defined as ‘C5 plus’<br />
petroleum components for NWS Venture<br />
and Otway Basin fields, but is sales<br />
product for the Ohanet project and the<br />
Gulf of Mexico fields.<br />
10 ‘Bcf’ means billions (10 9 ) of cubic feet<br />
of gas at standard oil field conditions of<br />
14.696 psi (101.325 kPa) and 60 degrees<br />
Fahrenheit (15.56 degrees Celsius).<br />
11 ‘MMbbl’ means millions (10 6 ) of barrels<br />
of oil or condensate at standard oil field<br />
conditions of 14.696 psi (101.325 kPa) and<br />
60 degrees Fahrenheit (15.56 degrees<br />
Celsius).<br />
12 ‘MMboe’ means millions (10 6 ) of barrels<br />
of oil equivalent. In common with<br />
international practice, dry gas volumes<br />
are converted to oil equivalent volumes<br />
via a constant conversion factor, which for<br />
<strong>Woodside</strong> is 5.7 Bcf of dry gas per<br />
1 MMboe. Volumes of oil and condensate<br />
are converted from MMbbl to MMboe on<br />
a 1:1 ratio.<br />
13 Revisions representing changes in<br />
previous estimates of reserves or<br />
contingent resources, either up or down,<br />
resulting from new information normally<br />
obtained from development drilling and<br />
production history or resulting from a<br />
change in economic factors.<br />
14 Additions to reserves or contingent<br />
resources that result from a) increased<br />
areal extensions of previously discovered<br />
fields demonstrated to exist subsequent to<br />
the original discovery, and/or b) discovery<br />
of reserves in new fields or new reservoirs<br />
in old fields.<br />
15 As the NWS consists of a portfolio of 14<br />
gas fields, probabilistic aggregation is more<br />
appropriate than arithmetic summation as<br />
inter-field dependencies reflecting different<br />
reservoir characteristics between fields are<br />
incorporated.<br />
16 Reserves associated with <strong>Woodside</strong>’s<br />
interest in Ohanet are <strong>report</strong>ed using an<br />
economic interest approach. <strong>Woodside</strong> has<br />
estimated equivalent reserves volumes<br />
that reflect the value of this asset, using a<br />
five-year average condensate price and an<br />
LPG price consistent with other <strong>Woodside</strong><br />
reserves estimations. The revision in<br />
reserves reflects revised project costs,<br />
effective production entitlement and<br />
revisions to future production forecasts.<br />
17 Includes Mutineer–Exeter, Otway,<br />
Laminaria–Corallina, Tocra, Argus,<br />
Panoramix and Neptune fields.<br />
Governance and<br />
assurance<br />
<strong>Woodside</strong> as an Australian company listed<br />
on the Australian Securities Exchange,<br />
<strong>report</strong>s its petroleum resource estimates<br />
using definitions and guidelines consistent<br />
with the 2007 Society of Petroleum<br />
Engineers (SPE), World Petroleum<br />
Council (WPC), American Association of<br />
Petroleum Geologists (AAPG) and Society<br />
of Petroleum Evaluation Engineers (SPEE)<br />
Petroleum Resources Management<br />
System (SPE–PRMS).<br />
In accordance with the SPE–PRMS<br />
guidelines, <strong>Woodside</strong> uses crude oil price<br />
forecasts and, where applicable, individual<br />
project production sales contract terms or<br />
other financial products for the purpose of<br />
reserve estimation. Dry gas reserves are<br />
<strong>report</strong>ed inclusive of LPG sales products.<br />
Unless otherwise stated, all petroleum<br />
resource estimates are quoted as net<br />
<strong>Woodside</strong> share at standard oil field<br />
conditions of 14.696 psi (101.325 kPa) and<br />
60 degrees Fahrenheit (15.56 degrees<br />
Celsius).<br />
<strong>Woodside</strong> has several processes to<br />
provide assurance for its reserves<br />
<strong>report</strong>ing, including <strong>Woodside</strong>’s Reserves<br />
Policy, management standards, staff<br />
competency requirements and external<br />
reserves audits. The audit program<br />
is aimed at having all major reserves<br />
bookings verified, as a minimum, every<br />
four years. More than 95% of <strong>Woodside</strong>’s<br />
Proved reserves have been externally<br />
verified by independent review within the<br />
past four years.<br />
The Reserves Statement has been<br />
compiled by Mr Ian F Sylvester,<br />
<strong>Woodside</strong>’s Chief Reservoir Engineer who<br />
is a full-time employee of the company.<br />
Mr Sylvester’s qualifications include<br />
a Master of Engineering (Petroleum<br />
Engineering) from Imperial College,<br />
University of London, England, and he has<br />
more than 20 years of relevant experience.<br />
Mr Sylvester has consented in writing to<br />
the inclusion of this information in this<br />
<strong>report</strong>.<br />
Overview<br />
13
14<br />
North West Shelf 25 years<br />
A COMMEMORATIVE TIMELINE<br />
In 2009 the <strong>Woodside</strong>-operated North West<br />
Shelf (NWS) Project celebrated 25 years of<br />
pipeline gas production in Western Australia<br />
and 20 years of LNG exports.<br />
An ambitious and visionary development, the<br />
NWS Project has played a pivotal role in the<br />
development of Australia’s upstream energy<br />
industry. It has underpinned the reputation of<br />
Australian gas projects for unrivalled reliability<br />
of supply, a reputation that has contributed<br />
to the success of the latest generation of<br />
Australian LNG projects.<br />
<strong>Woodside</strong>’s founding father, Geoff Donaldson,<br />
took a giant leap of faith in 1962 when<br />
he applied for vast exploration acreage in<br />
Western Australia's Carnarvon Basin which<br />
led to the great 1970s gas discoveries<br />
including North Rankin, Angel and Goodwyn.<br />
These discoveries underwrote the NWS<br />
Project and established <strong>Woodside</strong>’s reputation<br />
as Australia’s premier operator.<br />
When it was developed in the 1980s the<br />
NWS Project was the largest construction<br />
project Australia had ever seen. Today, this<br />
$27 billion project represents Australia’s<br />
largest oil and gas resource development<br />
and is synonymous around the world<br />
with safety, reliability and truly world-class<br />
performance. As operator, <strong>Woodside</strong> has been<br />
instrumental in establishing and maintaining<br />
that reputation, and today we are developing a<br />
new generation of projects on the back of that<br />
success.<br />
Since 1989 more than 2800 cargoes of LNG<br />
have been delivered to customers in the Asia-<br />
Pacific region and other parts of the world.<br />
Production from the NWS Project currently<br />
accounts for more than 40% of Australia’s<br />
oil and gas production, and about 65% of<br />
Western Australia's total domestic gas supply,<br />
playing a key role in the development of the<br />
State's industrial sector.<br />
To build this project today would require an<br />
investment of over $50 billion. As Western<br />
Australia's Premier The Hon. Colin Barnett<br />
MLA acknowledged in 2009 during our<br />
anniversary celebrations “…no other<br />
project compares to the NWS Project in<br />
the prosperity it has brought to Western<br />
Australia… this is Australia’s greatest industrial<br />
project.”<br />
<strong>Woodside</strong> pays tribute to all those people,<br />
including past and present employees, who<br />
have been involved with the development,<br />
and ongoing safe and reliable operation of our<br />
NWS facilities. These people were pioneers<br />
in their day, forging a new Australian industry.<br />
In doing so, they have laid the foundation for<br />
<strong>Woodside</strong>’s next exciting phase of growth.<br />
Geoff Donaldson’s legacy remains with<br />
<strong>Woodside</strong> today. <strong>Woodside</strong> continues to<br />
take great pride in being the independent<br />
Australian operator of the NWS facilities and<br />
embraces his vision of Australian LNG as we<br />
take our place as a global industry leader.<br />
1970s<br />
North West Shelf Venture discovers vast quantities<br />
of natural gas and condensate on Australia's northwest<br />
continental shelf.<br />
1980<br />
First phase of development begins with the<br />
construction of the Karratha Gas Plant and a jetty<br />
for the loading of LNG and condensate.<br />
1984<br />
Domestic gas deliveries from the North Rankin<br />
field to Western Australia begin.<br />
Condensate cargoes also begin leaving the port.<br />
The Karratha Gas Plant is officially opened on<br />
4 September, marking the first sale of gas to the<br />
State Energy Commission of Western Australia.<br />
1985<br />
Second phase of development begins with the<br />
construction of the first two LNG processing trains<br />
and four LNG storage tanks at the Karratha Gas<br />
Plant.<br />
Agreements are signed with eight foundation<br />
customers in Japan for the 20-year supply of LNG.<br />
1989<br />
First LNG cargo departs for Japan in August<br />
following completion of the second phase of<br />
development.<br />
LNG project is officially launched in September by<br />
then Prime Minister of Australia Bob Hawke.
1990<br />
First gas and condensate production from the<br />
Perseus field.<br />
1992<br />
Construction of a third LNG processing train is<br />
completed at the Karratha Gas Plant.<br />
1995<br />
Goodwyn A platform is commissioned.<br />
New LPG extraction and storage facilities are<br />
commissioned at the Karratha Gas Plant and<br />
a second jetty is built for loading LPG and<br />
condensate.<br />
Debottlenecking of the Karratha Gas Plant lifts<br />
<strong>annual</strong> LNG production capacity to 7.5 million<br />
tonnes.<br />
Production of crude oil from the Cossack and<br />
Wanaea fields begins on the Cossack Pioneer<br />
FPSO.<br />
1997<br />
Oil from the Hermes and Lambert fields comes on<br />
line for processing on the Cossack Pioneer FPSO.<br />
2000<br />
North West Shelf Venture participants sign<br />
Letters of Intent with existing and new Japanese<br />
customers, underpinning the fourth phase of<br />
development.<br />
2001<br />
The fourth phase of development begins with<br />
construction of a fourth, 4.4 mtpa LNG processing<br />
train at the Karratha Gas Plant.<br />
First gas and condensate production from the<br />
Yodel subsea development.<br />
2003<br />
The North West Shelf Venture signs a new seven<br />
year contract with Korean utility Kogas.<br />
2004<br />
LNG Train 4 begins production, increasing total<br />
<strong>annual</strong> LNG production capacity to 11.9 million<br />
tonnes.<br />
2005<br />
Fifth phase of development, the Phase V LNG<br />
Expansion Project, begins in August with the<br />
construction of a fifth LNG processing train,<br />
a second LNG loading berth and associated<br />
infrastructure at the Karratha Gas Plant<br />
2006<br />
North West Shelf Venture delivers the first cargo of<br />
Australian LNG to China in June marking the start<br />
of a 25 year contract with Guangdong Dapeng<br />
LNG.<br />
China National Offshore Oil Corporation acquires<br />
an interest in the North West Shelf Venture's<br />
reserves.<br />
2007<br />
First gas and condensate production from the<br />
Perseus over Goodwyn subsea development,<br />
including the Searipple field.<br />
Goodwyn Low Pressure Train is commissioned.<br />
2008<br />
LNG Train 5 begins production in late August,<br />
boosting total <strong>annual</strong> production capacity to<br />
16.3 million tonnes.<br />
The North West Shelf Venture approves funding of<br />
the $5 billion North Rankin Redevelopment Project<br />
in March.<br />
The Angel platform produces first gas for<br />
processing at the Karratha Gas Plant in October.<br />
<strong>Woodside</strong> acquires Shell Development Australia's<br />
16.67% interest in the Cossack Wanaea Lambert<br />
Hermes (CWLH) oil interests in May.<br />
The CWLH Venture approves funding for the<br />
CWLH Redevelopment Project in December.<br />
2009<br />
The North West Shelf Venture along with the<br />
Western Australian Premier, The Hon. Colin Barnett<br />
celebrates two significant milestones with 25<br />
years of domestic gas production and 20 years of<br />
LNG exports to international customers in the Asia<br />
Pacific region.<br />
15
16<br />
North West Shelf<br />
We celebrated two significant milestones with 25 years of pipeline gas production and 20<br />
years of LNG exports to international customers<br />
North West Shelf (NWS)<br />
INTEREST NWS Venture<br />
Domestic Gas JV<br />
Incremental<br />
Pipeline JV<br />
China LNG JV<br />
CWLH (crude oil)<br />
16.67%<br />
50.00%*<br />
16.67%<br />
12.50%<br />
33.33%<br />
OPERATOR <strong>Woodside</strong><br />
FACILITIES North Rankin A platform<br />
Goodwyn A platform<br />
Angel platform<br />
Cossack Pioneer FPSO,<br />
Karratha Gas Plant<br />
LOCATION ~130 km north-west of<br />
Karratha, WA<br />
WATER DEPTH 80 - 130 metres<br />
PRODUCTS LNG, pipeline gas,<br />
condensate, crude oil<br />
and LPG<br />
FIRST 1984 (pipeline gas)<br />
PRODUCTION<br />
* During 2009 <strong>Woodside</strong>’s average share of gas production<br />
was approximately 39%. <strong>Woodside</strong>’s exact share of<br />
domestic gas production depends on the quantities and<br />
aggregate rate of production.<br />
This year <strong>Woodside</strong> celebrated its 25 year<br />
operatorship of the North West Shelf<br />
facilities, which have exported more than<br />
2800 LNG cargoes and currently supply<br />
around 65% of Western Australia’s pipeline<br />
gas.<br />
In 2009 there was strong performance<br />
from Trains 1, 2 and 3 and improved<br />
reliability from Trains 4 and 5, delivering<br />
approximately 57% of our foundation<br />
production.<br />
During the year, <strong>Woodside</strong> loaded 246<br />
cargoes of LNG, of which 31 were sold on<br />
the spot market. <strong>Woodside</strong>’s share of 2009<br />
LNG production was 2.40 million tonnes.<br />
Pipeline gas production was lower for the<br />
year due to decreased customer demand<br />
given re-established Varanus Island gas<br />
supply and a reduction of <strong>Woodside</strong>’s<br />
equity share in accordance with foundation<br />
agreements between the joint venture<br />
participants. Condensate production<br />
continued to be strong throughout the<br />
year as a result of the additional Stabiliser 6<br />
capacity and supply from the condensaterich<br />
Searipple and Angel reservoirs.<br />
LPG production also remained strong<br />
throughout the year. <strong>Woodside</strong>’s NWS oil<br />
production was lower in 2009 primarily due<br />
to natural field decline.<br />
Expansion continued with the North<br />
Rankin and NWS oil redevelopment<br />
projects currently underway. Progress<br />
was also made on the proposed Lady<br />
Nora oil development and the Greater<br />
Western Flank (GWF) gas and condensate<br />
development, which will assist in<br />
maintaining offshore supply and onshore<br />
capacity to around 2020.<br />
NWS contribution to <strong>Woodside</strong>'s total<br />
production (MMboe)<br />
NWS gas and condensate 57%<br />
NWS oil 6%<br />
<strong>Woodside</strong> other 37%<br />
During 2009, NWS contributed 50.9 MMboe to <strong>Woodside</strong>’s<br />
80.9 MMboe <strong>annual</strong> production.<br />
Eve Howell<br />
ExECUTIVE VICE PRESIDENT NORTH WEST SHELF<br />
Eve has 37 years industry experience and joined <strong>Woodside</strong> in 2006.<br />
Train 5 and Stabiliser 6<br />
Modification of the main cryogenic heat<br />
exchangers on Train 5 was completed<br />
during planned maintenance in May,<br />
bringing the train to nameplate capacity.<br />
Train 5 is now contributing to increased<br />
LNG, condensate and LPG production.<br />
A sixth condensate stabilisation unit at the<br />
Karratha Gas Plant (KGP) was brought into<br />
production in May 2009 adding<br />
25,000 barrels per day of additional<br />
condensate processing capacity.<br />
Angel<br />
The Angel platform, which commenced<br />
production in Q4 2008 and supplies most<br />
of the additional gas needed for a five<br />
train operation, achieved unmanned status<br />
in mid 2009. The platform is remotely<br />
operated from the North Rankin A (NRA)<br />
platform, and gas and condensate from<br />
three wells are exported through a 50 km<br />
subsea pipeline to the NWS second<br />
trunkline.<br />
North Rankin redevelopment<br />
project<br />
The North Rankin B (NRB) substructure<br />
fabrication continues ahead of schedule in<br />
Indonesia with the topsides fabrication on<br />
NWS key metrics (<strong>Woodside</strong> share)<br />
2009 2008<br />
Sales<br />
revenue ($ million) 2,493 3,102<br />
Net gas<br />
production<br />
Net liquids<br />
production<br />
Proved plus<br />
Probable<br />
reserves<br />
Acreage (km 2 )<br />
(MMboe) 37.0 32.6<br />
(MMbbl) 13.9 13.5<br />
(MMboe) 701 742<br />
Gross<br />
4,667<br />
Net<br />
770<br />
The operations and activities outlined on this page form part of the<br />
NWS Business Unit. Financial details can be found on page 81.<br />
<strong>Woodside</strong> Petroleum Ltd | Annual Report 2009
North West Shelf Karratha Gas Plant<br />
schedule in Korea. At year end the project<br />
was 41% complete.<br />
Modification continues on the NRA<br />
platform for process tie-ins and the bridgelink<br />
to the NRB platform. NRB will provide<br />
compression to recover low pressure<br />
reserves in the North Rankin and Perseus<br />
fields.<br />
The project is expected to cost<br />
approximately $5 billion ($840 million<br />
<strong>Woodside</strong> share) and is scheduled for<br />
completion in 2013.<br />
Greater Western Flank<br />
development<br />
Pre-development studies, including<br />
appraisal drilling of Tidepole-2, to define<br />
the development plan sequence for<br />
commercialisation of the undeveloped<br />
petroleum resources in the GWF area,<br />
continued throughout the year. This area, to<br />
the south-west of the Goodwyn A (GWA)<br />
platform, contains 14 fields which are<br />
estimated to hold approximately 3 Tcf of<br />
recoverable gas and approximately<br />
100 MMbbl of condensate. Concept<br />
selection and FEED for the GWF<br />
development is expected in 2010.<br />
North West Shelf oil<br />
redevelopment project<br />
This $1.8 billion project ($600 million<br />
<strong>Woodside</strong> share) includes the conversion<br />
of the 'Okha' to a floating production<br />
storage and offloading vessel (FPSO) to<br />
replace the Cossack Pioneer FPSO in 2010,<br />
and the replacement of associated subsea<br />
infrastructure.<br />
Progress on the refurbishment and<br />
conversion of the Okha, along with<br />
construction, continues at the Keppel<br />
Shipyard in Singapore and at year end<br />
was 71% complete.Topside module<br />
fabrication progressed according to plan<br />
with installation and processing equipment<br />
underway. Refurbishment of existing NWS<br />
oil subsea infrastructure will commence in<br />
Q4 2010.<br />
The redevelopment project will provide<br />
state of the art facilities for continuous<br />
production from the Cossack Wanaea<br />
Lambert Hermes (CWLH) fields beyond<br />
2020.<br />
Alinta arbitration<br />
The gas price arbitration process which<br />
has been ongoing for some time between<br />
the North West Shelf Domestic Gas Joint<br />
Venture and Alinta Sales Pty Limited<br />
is now complete. The decision of the<br />
independent Arbitrator, in respect to a<br />
price review clause in the Alinta Sales<br />
contract, triggered a negotiated outcome<br />
with Alinta that will see the price for this<br />
contract compare favourably with recent<br />
new industry contract terms in Western<br />
Australia.<br />
Outlook<br />
In 2010 LNG, condensate and LPG<br />
production is expected to remain relatively<br />
constant. Overall, <strong>Woodside</strong>’s share<br />
of NWS production is expected to be<br />
approximately the same as in 2009.<br />
Continued focus on achieving top quartile<br />
performance (97.5% reliability) and<br />
increased capacity will be maintained with<br />
further investment in maintenance and<br />
debottlenecking respectively.<br />
Redevelopment work at North Rankin<br />
and development of the GWF fields is<br />
expected to progress to maintain plateau<br />
production for over 10 years.<br />
Feasibility studies are also progressing for<br />
development of the Lady Nora field which<br />
has approximately 100 MMbbl of oil in<br />
place.<br />
Following two successful Hermes<br />
appraisal wells, planning is underway for a<br />
Hermes development well and workover<br />
in 2010.<br />
Further exploration success and/or third<br />
party gas may result in a full plant to end of<br />
asset life in approximately 2040.<br />
'Okha' vessel in Keppel Shipyard, Singapore<br />
Train 5 is now contributing to increased production<br />
GWA platform team on the helideck with the<br />
Fremantle Dockers<br />
The Angel platform<br />
Business reviews reviews<br />
17
18<br />
Australia Business Unit<br />
In 2009 we continued to deliver strong and stable cash flow through aggressive cost<br />
focus, drilling of successful new infill wells and world class reservoir management<br />
Enfield oil field<br />
INTEREST WA-28-L 60%<br />
OPERATOR <strong>Woodside</strong><br />
FACILITIES Nganhurra FPSO<br />
LOCATION ~40 km off the<br />
WATER DEPTH<br />
North West Cape, WA<br />
400 - 550 metres<br />
PRODUCTS Crude oil<br />
FIRST PRODUCTION July 2006<br />
Since start up in 2006 Enfield has<br />
produced 47.8 million barrels of oil and in<br />
2009 produced 10.6 million barrels.<br />
At Enfield, 2009 has been a year of high<br />
activity. Three months after the acquisition<br />
of the 4D seismic in late 2008, data<br />
processing and interpretation identified<br />
locations for the Sliver South development<br />
well and a paired water injector. By mid<br />
2009 the wells had been proposed,<br />
approved and completed. The wells were<br />
delivered on budget, and have produced<br />
at almost double the predicted rates<br />
adding approximately 1.5 million barrels of<br />
additional production this year.<br />
The Enfield development currently<br />
comprises six oil production wells, eight<br />
water injection wells and two gas injection<br />
wells tied back to the Nganhurra FPSO.<br />
At the end of the year the facility was<br />
producing 38,000 barrels of oil per day.<br />
Following our very successful infill drilling<br />
campaign in 2009 we now plan to drill one<br />
new production well for start up by the<br />
end of Q3 2010. We are also evaluating a<br />
second production well opportunity for late<br />
2010 as well as two near field exploration<br />
targets which could be tested in 2010.<br />
Stybarrow oil field<br />
INTEREST WA-32-L 50%<br />
OPERATOR BHP Billiton<br />
FACILITIES Stybarrow Venture FPSO<br />
LOCATION ~50km off the<br />
North West Cape, WA<br />
WATER DEPTH 825 metres<br />
PRODUCTS Crude oil<br />
FIRST PRODUCTION November 2007<br />
Since start up in 2007, Stybarrow has<br />
produced 38.6 million barrels of oil and in<br />
2009 produced 11.4 million barrels.<br />
While Stybarrow was one of our best<br />
performing assets in 2008, natural field<br />
decline due to increasing water cut has<br />
caused production rates to drop from startup<br />
levels nearing 80,000 barrels of oil per<br />
day to an average rate of 21,000 barrels of<br />
oil per day through Q4 2009.<br />
The Stybarrow development currently<br />
comprises five oil production, one gas<br />
injection and three water injection wells<br />
tied back to the Stybarrow Venture FPSO.<br />
At the end of the year the facility was<br />
producing 24,000 barrels of oil per day.<br />
In Q4 2010 we plan to drill the Stybarrow<br />
North development well with production<br />
anticipated in early 2011. One near field<br />
exploration well could be tested in 2010. In<br />
addition, production upside will be pursued<br />
by actively supporting the evaluation of 4D<br />
seismic to mature additional infill drilling<br />
opportunities.<br />
Australia (non-NWS) contribution to<br />
<strong>Woodside</strong>'s total production (MMboe)<br />
Enfield 8%<br />
Laminaria–Corrallina 4%<br />
Stybarrow 7%<br />
Mutineer–Exeter
Mutineer–Exeter oil field<br />
INTEREST WA-26-L,<br />
WA-27-L 8.20%<br />
OPERATOR Santos<br />
FACILITIES Modec Venture 11<br />
FPSO<br />
LOCATION ~150 km north of<br />
Dampier, WA<br />
WATER DEPTH ~165 metres<br />
PRODUCTS Crude oil<br />
FIRST PRODUCTION March 2005<br />
Since start up in early 2005 Mutineer–<br />
Exeter has produced 52.0 million barrels<br />
of oil and in 2009 produced 3.0 million<br />
barrels.<br />
Consistent with our previously announced<br />
strategy of reviewing non-core assets,<br />
<strong>Woodside</strong> is reviewing options to<br />
monetise the remaining value in this field.<br />
Greater Enfield Map<br />
Eskdale<br />
Stybarrow<br />
Laverda<br />
Indian Ocean<br />
Vincent<br />
Enfield<br />
Exmouth<br />
Laminaria–Corallina oil field<br />
INTEREST Laminaria<br />
Corallina<br />
59.90%*<br />
AC/L5 66.67%<br />
OPERATOR <strong>Woodside</strong><br />
FACILITIES Northern Endeavour<br />
FPSO<br />
LOCATION Timor Sea, 550 km<br />
north-west of Darwin<br />
WATER DEPTH ~340 metres<br />
PRODUCTS Crude oil<br />
FIRST PRODUCTION 1999<br />
* Interests on a post-unitisation basis, i.e. after agreeing to pool<br />
<strong>Woodside</strong>’s interest with other field owners and to exploit the<br />
field as a single venture<br />
Since start up in 1999, the Laminaria-<br />
Corallina fields have produced<br />
191.6 million barrels of oil and in 2009<br />
produced 5.4 million barrels.<br />
In 2009 the subsea infrastructure<br />
replacement program was completed<br />
allowing us to maximise production<br />
beyond 2009. Additionally, following a<br />
successful appraisal well in 2008 proving<br />
up our attic oil theory, a successful infill<br />
production well (Corallina-2) was drilled<br />
and commenced production in August at<br />
26,000 barrels per day. The new well has<br />
produced over one million barrels since<br />
start-up through to the end of 2009.<br />
The Laminaria–Corallina development<br />
currently comprises five production wells<br />
and one gas injection well tied back to the<br />
Northern Endeavour FPSO. At the end of<br />
the year the facility was producing<br />
15,000 barrels of oil per day.<br />
In 2010 further technical work is planned to<br />
better understand the implications of the<br />
Corallina-2 well which has proved up the<br />
concept that there is likely significant attic<br />
oil remaining throughout the Laminaria and<br />
Corallina fields.<br />
Laminaria–Corallina<br />
Mutineer –Exeter<br />
Otway<br />
Otway gas field<br />
INTEREST T/L2, T/L3,<br />
VIC/L23, VIC/<br />
P43, T/30P,<br />
T/34P<br />
OPERATOR <strong>Woodside</strong><br />
On board the Nganhurra FPSO<br />
51.55%<br />
FACILITIES Thylacine Wellhead<br />
platform, Otway<br />
Onshore Gas Plant.<br />
LOCATION 70 km south of<br />
Port Campbell, VIC<br />
WATER DEPTH 85 - 100 metres<br />
PRODUCTS Gas, condensate, LPG<br />
FIRST PRODUCTION September 2007<br />
<strong>Woodside</strong> completed construction of the<br />
Otway Gas Plant in 2007, which processes<br />
gas from the offshore Thylacine field.<br />
Since start up in 2007, the Otway gas<br />
project has produced approximately<br />
92,000 TJ of pipeline gas, 1.1 million barrels<br />
of condensate and 110,000 tonnes of LPG.<br />
In 2009 Otway produced approximately<br />
48,000 TJ of pipeline gas, 0.6 million<br />
barrels of condensate and 70,000 tonnes<br />
of LPG.<br />
Consistent with our previously announced<br />
strategy of reviewing non-core assets we<br />
announced in November 2009 that we had<br />
entered an agreement for the sale of our<br />
51.55% interest in the Otway gas project<br />
to Origin Energy Resources Ltd (Origin) for<br />
a total of $712.5 million.<br />
The transaction was subject to preemptive<br />
rights held by the other joint<br />
venture parties which allowed those joint<br />
venture parties to proportionally increase<br />
their interest in the joint venture on terms<br />
equivalent to those agreed in the Origin-<br />
<strong>Woodside</strong> transaction. In December 2009,<br />
Benaris International Pty Ltd and related<br />
entities (Benaris) notified <strong>Woodside</strong> of its<br />
intention to exercise its pre-emption right<br />
in respect of the Otway exploration and<br />
development joint venture interests.<br />
Upon completion, Benaris’ interest in<br />
the exploration and development Joint<br />
Operating Agreement will be 27.77%<br />
and Origin’s will be 67.23%. Subject to<br />
joint venture approval, Origin will assume<br />
operatorship of <strong>Woodside</strong>’s interest in<br />
the Otway Basin offshore and onshore<br />
facilities and permits. The transition of<br />
operatorship is targeted to occur during<br />
Q2 2010.<br />
Business reviews<br />
19
20<br />
Pluto LNG<br />
The Pluto LNG Project, together with its growth potential, will consolidate <strong>Woodside</strong>’s<br />
position as a global LNG leader<br />
Pluto LNG<br />
INTEREST WA-34-L<br />
90%<br />
WA-350-P, WA-347-P 90%<br />
WA-369-P, WA-401-P 50%<br />
WA-370-P, WA-404-P 50%<br />
WA-428-P;WA-430-P 70%<br />
WA-433-P<br />
70%<br />
WA-348-P, WA-353-P 100%*<br />
WA-434-P<br />
100%<br />
WA-269-P 53.33%**<br />
OPERATOR <strong>Woodside</strong><br />
LOCATION Pluto–xena field 190 km<br />
north-west of Karratha, WA<br />
WATER DEPTH 400 - 1,000 metres<br />
PROVED + PROBABLE 4,146 Bcf dry gas,<br />
RESERVES (NET) 53.4 MMbbl condensate<br />
FIRST PRODUCTION first LNG in early<br />
2011<br />
* Tokyo Gas and Kansai Electric have options to each take 5% equity in<br />
these permits<br />
** Subject to Government approval and registration of <strong>Woodside</strong>'s<br />
acquisition of 13.33% interest in the permit<br />
The Thailand workforce 'Stand together for safety'<br />
Overview<br />
Lucio Della Martina<br />
ExECUTIVE VICE PRESIDENT PLUTO<br />
At the end of 2009, the foundation Pluto<br />
LNG Project was 83% complete and on<br />
target to become the fastest developed<br />
LNG project in the world from discovery<br />
in 2005 to first gas from the field by<br />
late 2010, with first LNG in early 2011<br />
contingent on a productive industrial<br />
relations environment.<br />
Approved for development in July 2007,<br />
the project will process gas from the Pluto<br />
and xena gas fields, located about<br />
190 km north-west of Karratha in Western<br />
Australia, into LNG and condensate.<br />
The Pluto–xena gas fields are estimated to<br />
contain 4.6 Tcf of dry gas reserves and an<br />
additional 0.5 Tcf of contingent resources.<br />
Onshore, the foundation project consists<br />
of a single LNG train, which will have an<br />
expected average production capacity of<br />
4.3 mtpa, and storage and export facilities<br />
at the Pluto LNG Park. Offshore, the<br />
180 km trunkline connects to the offshore<br />
platform and five production wells on the<br />
Pluto gas field.<br />
The project is underpinned by 15 year sales<br />
contracts for up to 3.75 mtpa with Pluto<br />
foundation customers and participants,<br />
Tokyo Gas and Kansai Electric, who each<br />
hold a 5% equity interest in the foundation<br />
project. Additional LNG capacity is available<br />
for either the spot market or further<br />
contracts.<br />
The project has generated thousands<br />
of jobs and is making a significant<br />
contribution to the Western Australian and<br />
Australian economies, as well as providing<br />
opportunities for local businesses.<br />
Cost and schedule review<br />
A review of the cost and schedule of the<br />
foundation project in November 2009<br />
resulted in a revision to the expected<br />
final costs, due to lower than budgeted<br />
productivity in both onshore and offshore<br />
construction. The review confirmed that<br />
the project remains on schedule.<br />
Depending on the drawdown of project<br />
contingencies, the final cost of the<br />
foundation project is expected to be 6%<br />
to 10% over the $11.2 billion approved by<br />
<strong>Woodside</strong> at the time of the FID in July<br />
2007.<br />
2009 achievements<br />
Lucio has more than 20 years industry experience and has been with <strong>Woodside</strong> since 1991.<br />
Onshore, more than 90% of the 264<br />
modules for the LNG plant have now<br />
arrived from Thailand, including the four<br />
gas turbine generators and liquefaction<br />
modules.<br />
The flare tower and the jetty structures<br />
were assembled and the main cryogenic<br />
heat exchangers for the LNG train were<br />
lifted into place. The LNG and condensate<br />
storage tanks were successfully hydro<br />
tested in the second half of 2009.<br />
The project entered into a phase of peak<br />
construction in late 2009, with up to 4000<br />
people working at the Pluto LNG Park.<br />
Offshore, more than 200 km of pipelines<br />
were laid, connecting the production<br />
wells to the platform and onshore plant.<br />
Flooding, gauging and testing of the<br />
pipelines was completed in Q4 2009.<br />
The Pluto offshore platform was assembled in<br />
Q4 2009<br />
<strong>Woodside</strong> Petroleum Ltd | Annual Report 2009
The platform substructure (or jacket) built<br />
in China was loaded from the fabrication<br />
yard in China in late August. The jacket was<br />
successfully launched into the ocean about<br />
190 km north-west of Karratha in October.<br />
The topside modules and flare boom<br />
were lifted onto the jacket in the following<br />
months, completing the assembly of the<br />
platform. Commissioning of the platform<br />
commenced during Q4 2009 and will<br />
continue into 2010.<br />
The second drilling campaign for Pluto's<br />
production wells concluded in late 2009.<br />
The campaign successfully completed<br />
and tested four Pluto production wells<br />
providing more than the required<br />
production volumes. The timing for<br />
completion of the fifth and final well will be<br />
determined in 2010.<br />
In addition to construction, the project<br />
met and in most cases exceeded<br />
its performance targets in safety,<br />
environment, cultural heritage and<br />
Indigenous participation in 2009.<br />
Pluto expansion: ready for<br />
exploration success<br />
<strong>Woodside</strong>’s vision for the Pluto site could<br />
see expansion with up to five LNG trains<br />
and a pipeline gas plant. Engineering<br />
studies have demonstrated that Train 1,<br />
Train 2 and Train 3 could be co-located on<br />
the lower plateau at the Pluto site.<br />
Pluto LNG Project Onshore Expansion Concept Plan<br />
Train 5<br />
Train 4<br />
In November 2009 <strong>Woodside</strong> awarded<br />
dual FEED contracts for Pluto Train 2 and<br />
Train 3, comprising the same scope of<br />
work, to a Foster Wheeler WorleyParsons<br />
joint venture and KBR. The FEED studies<br />
are scheduled for completion in mid-2010.<br />
Progressing FEED studies gives <strong>Woodside</strong><br />
the flexibility to capture exploration<br />
success from multiple exploration hubs<br />
leading to an integrated, multi-train Pluto<br />
LNG development, while infrastructure<br />
constructed as part of the foundation<br />
Pluto LNG Project will allow us to capture<br />
additional value from an expansion at our<br />
Pluto LNG Park.<br />
Gas supply for expansion continues to<br />
be focused on <strong>Woodside</strong> equity gas,<br />
both discovered and through ongoing<br />
exploration.<br />
Pluto LNG Park expansion concept plan showing possible location of up<br />
to four additional LNG trains<br />
During 2009 we have continued to build<br />
our acreage position in the Carnarvon<br />
Basin around the Pluto gas field. The<br />
acquisition of five new permits across the<br />
Claudius, Ragnar and Central hubs has<br />
increased the number of prospects in the<br />
portfolio, but more importantly it has also<br />
added new geologic plays and diversity to<br />
the portfolio increasing our probability of<br />
finding new gas reserves.<br />
In the past year we have provided our<br />
geoscientists with 17,000 km 2 of new 3D<br />
seismic data, and by the end of 2010 we<br />
Train 2<br />
Train 1<br />
Foundation Project<br />
Train 3<br />
The Pluto LNG Park reached peak construction phase in late 2009<br />
WA-434-P<br />
Cazadores Cazadores<br />
North North Hub Hub<br />
Claudius Hub<br />
Pluto exploration area<br />
plan to add another 23,000 km 2 of 3D<br />
data. <strong>Woodside</strong> continues to build towards<br />
collating complete 3D seismic coverage<br />
of the Carnarvon Basin. This level of 3D<br />
seismic coverage is unprecedented in<br />
Australia. <strong>Woodside</strong>’s exploration portfolio<br />
to support Pluto now extends over 13<br />
exploration permits, covering almost<br />
40,000 km 2 .<br />
Following the Martell gas discovery in early<br />
2009 we commenced our Phase 1, 20-plus<br />
exploration well campaign in October 2009<br />
with early success at the Eris prospect.<br />
Although the Pelion exploration prospect<br />
was dry, it encountered the Pluto reservoir<br />
high to prognosis with the potential to<br />
add Pluto volumes. With the arrival of the<br />
new drilling rig, the Maersk Discoverer, in<br />
December 2009 we expect the ongoing<br />
results of this campaign to substantially<br />
contribute to an expansion of the<br />
foundation Pluto LNG Project.<br />
<strong>Woodside</strong> also remains in discussions with<br />
third party gas owners in the Carnarvon<br />
Basin over the potential processing of their<br />
gas through Pluto.<br />
Final investment decisions on Pluto Train<br />
2 and Train 3 are targeted by end 2010 and<br />
end 2011 respectively, based on accessing<br />
sufficient gas through exploration success<br />
or other means.<br />
Cazadores<br />
South Hub<br />
WA-353-P<br />
WA-348-P<br />
WA-401-P<br />
Central Hub<br />
WA-433-P<br />
WA-428-P<br />
WA-430-P<br />
WA-404-P<br />
Martell<br />
Ragnar Hub<br />
WA-347-P<br />
WA-269-P<br />
Pluto<br />
Pluto Hub<br />
Pluto Hub<br />
Business reviews<br />
21
22<br />
Sunrise LNG<br />
At Sunrise the focus for 2010 will be on working with the Timor–Leste and Australian<br />
Governments, Sunrise Commission and Regulators to deliver the FDP approval<br />
Sunrise LNG<br />
INTEREST JPDA 03-19, JPDA<br />
03-20, NT/RL2,<br />
NT/RL4<br />
33.44%<br />
(unitised)<br />
OPERATOR <strong>Woodside</strong><br />
LOCATION Offshore 450 km north-west<br />
of Darwin, NT<br />
150 km south-east of<br />
Timor–Leste<br />
WATER DEPTH less than 100 metres to<br />
greater than 600 metres<br />
CONTINGENT<br />
RESOURCES<br />
1,717 Bcf dry gas,<br />
75.6 MMbbl condensate<br />
ACREAGE (km 2 ) Gross<br />
2,998<br />
Drilling rig at sunrise<br />
Net<br />
958<br />
The Sunrise LNG Project involves<br />
the development of the Sunrise and<br />
Troubadour gas fields, collectively known<br />
as Greater Sunrise, located offshore,<br />
approximately 450 km north-west of<br />
Darwin, Northern Territory. These fields<br />
contain a combined contingent resource<br />
of about 5 Tcf of dry gas and 226 million<br />
barrels of condensate.<br />
Development opportunity<br />
Jon Ozturgut<br />
SENIOR VICE PRESIDENT SUNRISE<br />
During 2009 the Sunrise joint venture<br />
(JV) has continued to apply its wealth<br />
of international LNG experience to a<br />
comprehensive and robust commercial<br />
and technical evaluation to select the<br />
development option which develops<br />
the Greater Sunrise fields to the best<br />
commercial advantage consistent with<br />
good oilfield practice. This is a requirement<br />
of the international treaties agreed by<br />
both the Timor–Leste and Australian<br />
Governments.<br />
The theme selection evaluation took more<br />
than 320,000 hours to complete and has<br />
positioned the JV to finalise its selection of<br />
a preferred development option in 2010.<br />
Developing Greater Sunrise<br />
In mid-2008, the Sunrise JV completed<br />
a lengthy, $33 million concept screening<br />
process which fully explored and assessed<br />
five development concepts for the Greater<br />
Sunrise fields, including Darwin LNG,<br />
Floating LNG and an onshore LNG facility<br />
in Timor–Leste.<br />
The screening study found that an onshore<br />
LNG facility in Timor–Leste was the<br />
least likely of these options to develop<br />
the reservoir to the best commercial<br />
advantage consistent with good oilfield<br />
practice. Since completing its concept<br />
screening work, the Sunrise JV has<br />
undertaken an extensive technical and<br />
commercial evaluation of both the Floating<br />
and Darwin LNG development options.<br />
It also updated its analysis of the Timor–<br />
Leste LNG option, including updating its<br />
assessment of the costs and operability of<br />
a pipeline to Timor–Leste and an onshore<br />
LNG facility in Timor–Leste.<br />
As a result of the concept screening study<br />
and subsequent technical and commercial<br />
evaluation, the Sunrise JV has sufficient<br />
technical and commercial information to<br />
agree on the development option that will<br />
maximise recovery and value. Following<br />
theme selection, the Sunrise JV will<br />
submit a field development plan (FDP) to<br />
the Australian and Timor–Leste regulators.<br />
The approval of a FDP is an important<br />
Jon has almost 30 years of industry experience and joined <strong>Woodside</strong> in 2005.<br />
precursor to an FID on the Greater Sunrise<br />
fields.<br />
The Governments of Timor–Leste and<br />
Australia will receive an equal share (50%<br />
each) of government upstream revenues<br />
from the development of the Greater<br />
Sunrise fields. This revenue will deliver<br />
long-term, stable and significant cash<br />
flow to Timor–Leste and Australia over<br />
approximately 30 years.<br />
Floating LNG (FLNG) option<br />
The Sunrise floating facility would be<br />
designed to produce around 4 million<br />
tonnes per annum of LNG for export,<br />
plus the associated condensate. The<br />
facility would be permanently moored<br />
via a geostationary turret, held on station<br />
via mooring chains. The Sunrise subsea<br />
facilities would be developed in stages to<br />
include approximately 26 production wells<br />
and a number of main flow line headers<br />
linking into the FLNG facility. The Floating<br />
LNG facility, would store and export LNG<br />
via an LNG carrier and condensate via a<br />
shuttle tanker.<br />
Darwin LNG (DLNG) option<br />
The Darwin LNG development concept is<br />
based on an offshore upstream processing<br />
facility that would transport the dry gas<br />
to shore via an export pipeline. The new<br />
Sunrise LNG processing train would have<br />
a capacity of around 5 million tonnes<br />
per annum and would be located within<br />
the existing LNG processing complex<br />
at Wickham Point in Darwin. An FPSO<br />
is the preferred concept for combining<br />
the upstream processing facilities with<br />
condensate storage.<br />
Outlook<br />
At Sunrise the focus for 2010 will be<br />
on selecting a development option<br />
and working with the Timor–Leste<br />
and Australian Governments, Sunrise<br />
Commission and regulators to deliver the<br />
FDP approval.<br />
Our process will see a natural progression<br />
through basis of design (BOD) and into<br />
FEED.<br />
<strong>Woodside</strong> Petroleum Ltd | Annual Report 2009
Browse LNG<br />
The way forward to deliver a world-class facility at the Browse LNG Precinct is now clear<br />
Browse LNG<br />
INTEREST TR/5; R2;WA-30-R 50%<br />
WA-31-R;WA-32-R 50%<br />
WA-28-R;WA-29-R 25%<br />
WA-275-P<br />
25%<br />
WA-378-P;WA-396-P 70%<br />
WA-397-P;WA-429-P 70%<br />
WA-432-P;AC/P48 70%<br />
AC/RL8<br />
60%<br />
WA-415-P;WA-416-P 100%<br />
WA-417-P<br />
100%<br />
OPERATOR <strong>Woodside</strong><br />
LOCATION Offshore 425 km north of<br />
Broome, WA<br />
WATER DEPTH 400 - 800 metres<br />
CONTINGENT<br />
RESOURCES<br />
5,892 Bcf dry gas,<br />
154.1 MMbbl condensate<br />
ACREAGE (km 2 ) Gross<br />
21,944<br />
Net<br />
14,156<br />
The Browse LNG Development is<br />
seeking to commercialise the Browse<br />
Basin gas and condensate fields, Torosa,<br />
Calliance and Brecknock, located offshore<br />
approximately 425 km north of Broome,<br />
Western Australia.<br />
In 2009 the Browse LNG Development<br />
achieved a number of significant<br />
milestones, including the successful<br />
completion of extensive concept select<br />
work and a comprehensive assurance<br />
process involving the Browse joint venture<br />
(JV) participants. In early 2010 the Browse<br />
Joint Venture announced its selection of<br />
the Western Australian Government’s<br />
Browse LNG Precinct near James Price<br />
Point as the location to process gas from<br />
Browse Basin fields, completing the<br />
development concept phase.<br />
The Browse LNG Development then<br />
entered into the Basis of Design (BOD)<br />
phase for the development. The BOD<br />
phase determines the major design<br />
parameters which would enable the<br />
optimal development of the offshore gas<br />
fields and the onshore facilities at the<br />
Browse LNG Precinct.<br />
Browse retention lease renewal<br />
In December, the Browse JV accepted<br />
retention lease renewal offers from<br />
the State and Federal Governments for<br />
retention leases WA-28-R, WA-29-R,<br />
WA-30-R, WA-31-R, WA-32-R, TR/5 and<br />
R 2. The conditions of the retention leases<br />
require the Browse JV to undertake a<br />
$1.25 billion work program, select a<br />
development concept and undertake BOD<br />
in 2010 and FEED in 2011 for the selected<br />
concept.<br />
Importantly the conditions require the<br />
Browse JV to be in a position to apply<br />
for a production licence and make a final<br />
investment decision by mid-2012. A final<br />
investment decision for the development<br />
will be subject to necessary approvals and<br />
consents.<br />
Browse LNG Precinct<br />
In 2009 <strong>Woodside</strong> executed a number<br />
of agreements relating to the Western<br />
Australian Government’s Browse LNG<br />
Precinct near James Price Point. In April,<br />
<strong>Woodside</strong> signed a Heads of Agreement<br />
(HOA) with the Kimberley Land Council<br />
(on behalf of Traditional Owners) and<br />
the State of Western Australia. The HOA<br />
commits <strong>Woodside</strong> and the State to a<br />
range of financial and other benefits for<br />
the Indigenous people of the Kimberley,<br />
triggered by the development of the<br />
precinct. In addition, <strong>Woodside</strong> entered<br />
into a Preliminary Development Agreement<br />
with the State of Western Australia, which<br />
appointed <strong>Woodside</strong> as the foundation<br />
commercial proponent for the precinct.<br />
These agreements followed the Western<br />
Australian Government’s December<br />
2008 announcement that it had selected<br />
the James Price Point coastal area as<br />
its preferred location for the Browse<br />
LNG Precinct. In late 2009 the Western<br />
Australian Government announced that a<br />
specific area near James Price Point had<br />
been identified as the site for the precinct.<br />
The State is the proponent for the<br />
Browse LNG Precinct and is responsible<br />
for securing land access and State and<br />
Commonwealth environmental approvals<br />
via the Strategic Assessment process. The<br />
State is seeking strategic environmental<br />
approvals for the precinct by the second<br />
half of 2010. The Browse JV may then seek<br />
subsequent environmental approvals for its<br />
project within the precinct.<br />
Indicative layout of the precinct<br />
Michael Hession<br />
SENIOR VICE PRESIDENT BROWSE<br />
Michael has over 20 years industry experience and has been with <strong>Woodside</strong> since 1998.<br />
Heads of Agreement signing ceremony<br />
Outlook<br />
To date 14 appraisal wells have been drilled<br />
(including two in 2009) and the Browse<br />
JV now has a very sound understanding<br />
and knowledge of the three Browse Basin<br />
fields. In 2010, <strong>Woodside</strong> will establish a<br />
Broome office and increase engagement<br />
with all stakeholders as key approvals<br />
progress for upstream, downstream<br />
and early site works. Contracts for the<br />
BOD, for both the onshore and offshore<br />
components, were awarded in Q1 2010<br />
and workforce numbers are increasing in<br />
support of the BOD work<br />
program.<br />
<strong>Woodside</strong> is committed<br />
to a world class, socially<br />
and environmentally<br />
responsible<br />
development of<br />
its Browse Basin<br />
reserves by 2017.<br />
Business reviews<br />
23
24<br />
United States<br />
Returning to drilling in the deepwaters of the Gulf of Mexico with the arrival of the<br />
Maersk Developer<br />
Neptune oil field<br />
INTEREST AT 573-575, WI 20%<br />
617, 618 NRI 17.5%<br />
OPERATOR BHP Billiton<br />
LOCATION Atwater Valley, 220 km<br />
offshore Louisiana, USA<br />
WATER DEPTH ~2,000 metres<br />
FIRST PRODUCTION 6 July 2008<br />
WI - Working Interest NRI - Net Revenue Interest<br />
Neptune is a multi-well subsea<br />
development tied back to a stand-alone<br />
tension leg platform (TLP). The Neptune<br />
field produced first oil on 6 July 2008 and<br />
quickly reached a peak production rate of<br />
more than 53,000 barrels of oil and<br />
42,000 Mcf of gas per day.<br />
During 2009, Neptune experienced<br />
production declines from its peak<br />
rates, such that production rates were<br />
approximately 15,500 barrels of oil and<br />
9500 Mcf of gas per day (gross) at the<br />
end of 2009. <strong>Woodside</strong>’s net share of<br />
Neptune’s production at the end of 2009<br />
was approximately 2700 barrels of oil and<br />
1700 Mcf of gas per day.<br />
In late 2009, secondary development<br />
drilling efforts began with the drilling of the<br />
SB-02 well. This well was spudded on<br />
21 September 2009 with first production<br />
on 19 December 2009. <strong>Woodside</strong> is<br />
planning for the drilling and completion of<br />
up to two additional development wells at<br />
Neptune during 2010.<br />
Shelf gas fields<br />
PRODUCING FIELDS 7<br />
OPERATED FIELDS 4<br />
WATER DEPTH 5–100 metres<br />
AVERAGE INTEREST 37% (reserve basis)<br />
At the end of the year, <strong>Woodside</strong>’s net<br />
shelf production was 260 barrels of oil<br />
and 18,500 Mcf of gas per day. In 2009,<br />
the company plugged and abandoned<br />
several depleted non-producing fields<br />
in order to reduce risks, expenses and<br />
liabilities associated with these assets.<br />
This campaign will continue over the next<br />
few years as the remaining producing shelf<br />
assets’ reserves are depleted.<br />
Gulf of Mexico exploration<br />
<strong>Woodside</strong> drilled the Rickenbacker<br />
exploration prospect in late 2009. The well<br />
was found to contain an uneconomical<br />
amount of hydrocarbon and was<br />
subsequently plugged and abandoned. The<br />
company anticipates drilling two to three<br />
exploration wells in 2010.<br />
In November 2006, <strong>Woodside</strong> and<br />
StatoilHydro signed a rig sharing<br />
agreement for a new build drilling rig.<br />
In August 2009, the Maersk Developer<br />
arrived in the Gulf of Mexico and<br />
commenced drilling. Under the rig sharing<br />
agreement we anticipate taking receipt of<br />
the drilling rig in July 2010.<br />
Gulf of Mexico production<br />
Production 4%<br />
<strong>Woodside</strong> other 96%<br />
During 2009, our United States business contributed 3.2 million<br />
barrels of oil equivalent to <strong>Woodside</strong>’s production.<br />
Jeff Soine<br />
PRESIDENT WOODSIDE ENERGY (USA) INC<br />
Jeff has 18 years industry experience and has been with <strong>Woodside</strong> since 2005.<br />
Power Play oil field<br />
INTEREST GB 302 WI 20.0%<br />
NRI 16.3%<br />
OPERATOR Anadarko<br />
LOCATION Garden Banks, 200 km<br />
offshore Louisiana, USA<br />
WATER DEPTH 700 metres<br />
Power Play began production in June 2008<br />
and was producing 4750 barrels of oil per<br />
day and 13,400 Mcf of gas (gross) at the<br />
end of 2009. <strong>Woodside</strong>’s net share of<br />
Power Play’s production was 775 barrels of<br />
oil and 2200 Mcf of gas per day at the end<br />
of 2009.<br />
Maersk Developer<br />
Gulf of Mexico key metrics (<strong>Woodside</strong> share)<br />
Sales<br />
revenue<br />
Net<br />
production<br />
Proved plus<br />
Probable<br />
reserves<br />
Acreage (km 2 )<br />
2009 2008<br />
($ million) 156 237<br />
(MMboe) 3.2 3.1<br />
(MMboe) 14 26<br />
Gross<br />
2,785<br />
Net<br />
1,219<br />
<strong>Woodside</strong> Petroleum Ltd | Annual Report 2009
Other international<br />
During 2009 we have continued to rationalise the portfolio, sharpening the focus of our<br />
international efforts<br />
Ohanet condensate and LPG<br />
INTEREST Ohanet North,<br />
Ohanet South,<br />
Askarene Guelta,<br />
Dimeta West<br />
15%<br />
OPERATOR BHP Billiton<br />
FACILITIES Ohanet Gas<br />
Processing Plant<br />
LOCATION Onshore Illizi Basin,<br />
Southern Algeria<br />
PRODUCTS LPG and condensate<br />
FIRST PRODUCTION October 2003<br />
In 2009, the Ohanet joint venture received<br />
its full revenue entitlement of $70 million<br />
(<strong>Woodside</strong> share), which equals<br />
1.4 million barrels of condensate and<br />
112,000 tonnes of LPG (at a 10 year<br />
average price at the time of initial<br />
production).<br />
Libya EPSA III <strong>Woodside</strong> 45% (operator)<br />
<strong>Woodside</strong> completed its onshore<br />
exploration and appraisal program, drilling<br />
the final two commitment exploration<br />
wells during 2009. Both wells were<br />
unsuccessful. The EPSA III contract expired<br />
in Q4 2009 and the remaining assets have<br />
been sold to Gaz De France subject to<br />
Libyan Government approval.<br />
Libya EPSA IV <strong>Woodside</strong> 55% (operator)<br />
<strong>Woodside</strong> also holds a 55% interest in four<br />
offshore exploration blocks. No seismic or<br />
drilling activity took place during 2009 and<br />
the EPSA contract expires in Q1 2010.<br />
Ohanet production<br />
Ohanet 3%<br />
<strong>Woodside</strong> other 97%<br />
During 2009 international activities contributed 2.3 MMboe to<br />
<strong>Woodside</strong>’s <strong>annual</strong> production.<br />
Sierra Leone <strong>Woodside</strong> 25% (non-operator)<br />
<strong>Woodside</strong> holds a 25% interest in blocks<br />
SL-6 and SL-7 in Sierra Leone operated by<br />
Anadarko. The blocks cover 10,567 km 2<br />
in water depths ranging from 50 to 3750 m.<br />
The Venus-B well was drilled in Q3 2009<br />
and encountered 14 metres of<br />
hydrocarbons. This discovery attracted<br />
considerable industry attention, because<br />
this part of the deep water West African<br />
continental margin had never been drilled<br />
before and the results established the<br />
presence of a hydrocarbon system. A<br />
second drill campaign is planned for late<br />
2010 when the results of Venus-B have<br />
been integrated with the 3D seismic<br />
covering the area.<br />
Liberia <strong>Woodside</strong> 17.5% (non-operator)<br />
<strong>Woodside</strong> holds a 17.5% interest in the<br />
offshore PSCs L15, L16 and L17 operated<br />
by Anadarko. An extensive 3D seismic<br />
program (6,200 km 2 ) was completed in<br />
April 2009 and the processed data was<br />
received in late December.<br />
Canary Islands<br />
<strong>Woodside</strong> 30% (non-operator)<br />
<strong>Woodside</strong> holds a 30% interest in blocks<br />
1-9 operated by Repsol. Activity remains<br />
suspended until such time as a Royal<br />
Decree provides full rights to permit<br />
activity.<br />
International key metrics (<strong>Woodside</strong> share)<br />
Sales<br />
revenue<br />
Net<br />
production<br />
Proved plus<br />
Probable<br />
reserves<br />
Acreage (km 2 )<br />
2009 2008<br />
($ million) 70 65<br />
(MMboe) 2.3 2.3<br />
(MMbbl) 1.7 2.6<br />
Gross<br />
93,422<br />
Net<br />
42,229<br />
Peter Moore<br />
SENIOR VICE PRESIDENT ExPLORATION<br />
Peter has more than 30 years of industry experience and joined <strong>Woodside</strong> in 1999.<br />
Brazil <strong>Woodside</strong> 12.5% (non-operator)<br />
<strong>Woodside</strong> holds a 12.5% interest in two<br />
concession agreements covering 2095<br />
km 2 in the Santos Basin, offshore southeastern<br />
Brazil. The blocks are about 180 km<br />
south-east of Sao Paulo.<br />
The Panoramix-1 well in block S-M-674 was<br />
finished in Q1 2009. The well intersected<br />
potentially commercial gas columns of<br />
85 m and 39 m in two Santonian aged<br />
reservoirs, and a 20 m column of light oil<br />
in a third Campanian aged zone. One of<br />
the Santonian reservoirs was tested and<br />
flowed<br />
12.8 MMcf of gas and 1670 barrels<br />
condensate per day. An appraisal<br />
well is planned in 2010 to determine<br />
commerciality of the Campanian oil<br />
discovery and test the second gas zone.<br />
During Q3 2009 the Vampira-1 well was<br />
drilled in block S-M-789. This well found<br />
a 20 m light oil column in a Santonian<br />
reservoir. Analysis of the Vampira discovery<br />
continues into 2010.<br />
Korea <strong>Woodside</strong> 50% (operator)<br />
<strong>Woodside</strong> holds a 50% interest in offshore<br />
Block 8/6-1 N, which covers 9922 km 2 .<br />
During 2009, <strong>Woodside</strong> entered into the<br />
second exploration period of the contract<br />
and will drill the first well in this block in<br />
early 2011.<br />
Peru <strong>Woodside</strong> 20% (non-operator)<br />
<strong>Woodside</strong> has executed an agreement<br />
for a 20% interest in onshore block 108,<br />
operated by Pluspetrol and covering<br />
approximately 12,000 km 2 .<br />
The basin is only lightly<br />
explored but contains<br />
numerous large leads<br />
and oil seeps. Pluspetrol<br />
is currently conducting<br />
field studies in<br />
advance of<br />
800 km 2D<br />
seismic survey<br />
scheduled for<br />
2011.<br />
Business reviews<br />
25
26<br />
Production<br />
Maximising production… while safeguarding our facilities and people<br />
Our approach<br />
The Production division is responsible for<br />
operating and maintaining <strong>Woodside</strong>'s<br />
producing assets.<br />
The division utilises an integrated oneteam<br />
approach that ensures lean, reliable<br />
and profitable operations. Common<br />
standards, processes and tools are applied<br />
to all our activities to ensure efficiency.<br />
Our focus areas<br />
During 2009 we focused on the following<br />
eight strategic themes aimed at improving<br />
our performance and making us the<br />
operator of choice in our industry.<br />
People - we are committed to<br />
fostering an engaging and rewarding<br />
organisational climate that allows us to<br />
attract and retain the best people, now<br />
and in the future.<br />
Health and safety - we continue to<br />
work with our supervisors, managers<br />
and workforce to improve behaviours<br />
that can influence our health and<br />
safety performance. Through our<br />
structured and simplified health and<br />
safety initiatives our performance in<br />
this area continues to improve.<br />
Production - our goal is simple,<br />
maximise production revenue. We<br />
focus on the reliability and availability<br />
of our facilities and we consistently<br />
pursue optimisation opportunities.<br />
Cost management - we seek value<br />
for money and eliminate unnecessary<br />
expense through the pursuit of<br />
cost sharing and cost reduction<br />
opportunities.<br />
Environment - we are committed to a<br />
cleaner environment and we conduct<br />
all our activities in such a way as to<br />
minimise any adverse effects.<br />
Integrity - by maintaining and<br />
safeguarding the integrity of our<br />
facilities we protect our people, the<br />
environment and our business.<br />
Maintenance - we strive to achieve<br />
optimal reliability while ensuring the<br />
delivery of our production targets. This<br />
requires the continued development of<br />
maintenance strategies that support<br />
our facilities throughout their life cycle.<br />
Operations readiness - we engage<br />
early in a project's life cycle to ensure<br />
that all facilities are ready and capable<br />
of delivering design intent at start up.<br />
In 2009 we achieved a number of<br />
significant milestones including a reduction<br />
in TRCF and maintenance backlog and<br />
Production division 2009<br />
Theme Key performance indicator Achieved<br />
People<br />
Health and<br />
safety<br />
Turnover 4.2%<br />
People objectives met 86%<br />
Health and safety objectives met 96%<br />
Divisional total recordable case frequency -<br />
% improvement<br />
29%<br />
First priority actions overdue 0<br />
Production Production (MMboe) 80.9<br />
Cost<br />
management<br />
Environment<br />
Integrity<br />
Opex spend versus budget - $m 96%<br />
Capex minor spend versus budget - $m 81%<br />
Environment incidents Category C or greater<br />
(includes <strong>report</strong>able)<br />
7<br />
Loss of containment plans in place and active 100%<br />
Technical deviations overdue - % improvement 70%*<br />
Alarms standing - % improvement at year end 78%*<br />
Maintenance Maintenance backlog - % improvement 52%*<br />
* Excludes Vincent, non-operated and international assets<br />
Vince Santostefano<br />
ExECUTIVE VICE PRESIDENT PRODUCTION<br />
Vince has 27 years industry experience and has been with <strong>Woodside</strong> since 1999.<br />
improved integrity metrics. This was<br />
a culmination of a number of years of<br />
concerted effort.<br />
At the same time our continued<br />
maintenance focus has improved our<br />
reliability. We were particularly pleased<br />
with the improved safety performance on<br />
our shutdowns. Equally we introduced a<br />
range of innovative cost saving initiatives<br />
that were successful and will be applied<br />
again in future maintenance campaigns.<br />
Progress against a sample of our Key<br />
Performance Indicators (KPIs) in 2009 is<br />
shown in the table below.<br />
We have maintained the same strategic<br />
themes for 2010 but have continued to<br />
tighten our KPIs ensuring that these are<br />
set at challenging industry benchmarked<br />
levels. We look forward to continuing the<br />
improvement in our health and safety<br />
performance, while maximising production<br />
and implementing ongoing efficiencies as<br />
Pluto Train 1 starts up.<br />
<strong>Woodside</strong> Petroleum Ltd | Annual Report 2009
Health and safety<br />
We believe that the health and safety of<br />
our people comes first in all our decisions<br />
and actions.<br />
Our goal is ‘no-one gets hurt, no incidents’<br />
and we aspire to be recognised, by our<br />
people and peers, as an industry leader in<br />
the management of health and safety.<br />
Safety<br />
During 2009, <strong>Woodside</strong>’s frequency of<br />
safety incidents, as measured by total<br />
recordable case frequency (TRCF),<br />
decreased from 4.3 to 3.3. The total<br />
number of safety incidents increased by<br />
21% relative to a 59% increase in hours<br />
worked in 2009 compared with 2008.<br />
In terms of frequency, this is the best<br />
result we have achieved. However, it<br />
still means that 199 people were hurt<br />
performing work for <strong>Woodside</strong>. We will<br />
continue striving to eliminate injury and<br />
occupational illness from our work and<br />
locations.<br />
In 2009, we experienced a fire in one of<br />
the two gas compression units on the<br />
Vincent FPSO, the Maersk Ngujima-Yin.<br />
While no-one was hurt as a result of this<br />
event, it gave us cause to reflect on the<br />
serious nature of the incident and review<br />
our activities.<br />
As with most large organisations,<br />
there are some areas of our business<br />
that consistently achieve better health<br />
and safety performance than others.<br />
Applying learnings from these ‘pockets<br />
of excellence’, whether they are within<br />
<strong>Woodside</strong> or our contractors, represents a<br />
considerable opportunity for improvement.<br />
A highlight in 2009 was the outstanding<br />
performance achieved by all of our Asian<br />
construction yards, but in particular, a<br />
Thailand-based company, STP&I, which<br />
<strong>Woodside</strong> contracted to build modules for<br />
the Pluto LNG train.<br />
Underpinning this performance was<br />
a strategy focused on establishing<br />
mechanisms to motivate, educate, support<br />
and reinforce positive health and safety<br />
behaviours, which were customised to the<br />
Thai cultural environment. The project’s<br />
TRCF was comparable to industry best<br />
performance for this type of activity.<br />
Despite these improvements, significant<br />
health and safety challenges remain for<br />
<strong>Woodside</strong> and its contractors. In particular,<br />
the ongoing construction of the offshore<br />
and onshore components of the Pluto<br />
project, must continue to be carefully<br />
managed in 2010.<br />
Contractor safety<br />
Working closely with our contractors,<br />
<strong>Woodside</strong> also made some significant<br />
strides towards improving safety<br />
throughout 2009. In February 2009,<br />
<strong>Woodside</strong>'s Chief Executive Officer<br />
Don Voelte hosted a Contractor Safety<br />
Forum that brought together 100 senior<br />
leaders from <strong>Woodside</strong> and 35 of our<br />
most significant contractors. The event<br />
provided a forum to focus and align our<br />
efforts on health and safety and identify<br />
opportunities to improve performance<br />
across all of our work sites.<br />
Stand together for safety<br />
Taking a concept initially proposed at<br />
the Contractor Safety Forum, <strong>Woodside</strong><br />
and its contractors played a key role in<br />
developing and establishing a two-hour<br />
safety ‘stand down’ event, called 'Stand<br />
together for safety'. At <strong>Woodside</strong> about<br />
20,000 people, including contractors,<br />
at more than 40 locations throughout<br />
Australia and overseas took part,<br />
reinforcing a shared responsibility for<br />
improving safety performance.<br />
Working in conjunction with the<br />
Australian Petroleum Production &<br />
Exploration Association (APPEA), the<br />
wider Australian oil and gas industry<br />
was invited to participate in this ground<br />
breaking event. Despite a short lead<br />
time, APPEA estimate that 80% of the<br />
Australian industry participated, including<br />
major operators and contractors.<br />
The APPEA Board has decided that a<br />
‘Stand together for safety’ event will be a<br />
permanent fixture on the <strong>annual</strong> APPEA<br />
Agu Kantsler<br />
ExECUTIVE VICE PRESIDENT HEALTH, SAFETY AND SECURITY<br />
Agu has more than 30 years industry experience and has been with <strong>Woodside</strong> since 1995.<br />
Total recordable cases<br />
Health and safety<br />
3.8<br />
90<br />
2005<br />
Total recordable cases<br />
5.1<br />
153<br />
4.1<br />
131<br />
164<br />
199<br />
2006 2007 2008 2009<br />
calendar. <strong>Woodside</strong> will continue to play<br />
an active role in this initiative.<br />
Integrity performance<br />
4.3<br />
3.3<br />
Ensuring the safe operation of facilities,<br />
including carefully managing our assets<br />
to contain hydrocarbons and prevent the<br />
possibility of a major accident event, is<br />
central to our health and safety strategy.<br />
<strong>Woodside</strong> has an active program for<br />
managing our pipelines and plant,<br />
including comprehensive maintenance<br />
management and corrosion inspection<br />
and management programs. Information<br />
from inspections is shared with the<br />
relevant regulatory authorities.<br />
In the first quarter of 2009, <strong>Woodside</strong><br />
experienced a number of gas releases<br />
from our production facilities, which<br />
underscored the importance of<br />
effectively implementing our strategies<br />
to improve process safety. This remains a<br />
key focus for <strong>Woodside</strong> in 2010.<br />
Further information on our 2009 health<br />
and safety performance is available in our<br />
2009 Sustainable Development Report.<br />
Total recordable case frequency rate<br />
(per million hours worked)<br />
Sustainability<br />
27
28<br />
Total employees<br />
Total<br />
Total<br />
Our people<br />
Number of employees and voluntary turnover<br />
8.2<br />
2,508<br />
2005<br />
2,888<br />
2,981<br />
Our approach<br />
3,124<br />
3,219<br />
2006 2007 2008 2009<br />
Graduates, trainees and apprentices<br />
112<br />
2005<br />
2<br />
2005<br />
10.1<br />
148<br />
215<br />
240<br />
224<br />
2006 2007 2008 2009<br />
Indigenous workforce<br />
52<br />
11.2<br />
118<br />
9.0<br />
169<br />
5.2<br />
206<br />
2006 2007 2008 2009<br />
<strong>Woodside</strong> aims to achieve its business<br />
strategy through an engaged, capable and<br />
highly motivated workforce.<br />
To achieve this we focus on having the<br />
right capability and outstanding leadership<br />
which creates an organisational climate<br />
that drives high performance.<br />
Voluntary turnover ratio (%)<br />
Our staff<br />
The <strong>Woodside</strong> workforce grew 3.0%<br />
to 3219 in 2009. Recruitment activities<br />
during the year resulted in 452 new<br />
employees joining the company.<br />
A highlight of 2009 was our voluntary<br />
turnover rate, which continued to decline.<br />
The <strong>annual</strong>ised voluntary turnover was<br />
5.2%, down from 9.0% in 2008. This result<br />
was pleasing against a competitive labour<br />
market in the Australian LNG industry.<br />
A new initiative in 2009 to support staff<br />
retention was the implementation of an<br />
employee equity plan for all <strong>Woodside</strong><br />
permanent employees with almost 100%<br />
of eligible employees accepting the offer.<br />
Diversity<br />
In 2009 we reviewed our Gender Diversity<br />
Strategy and Indigenous Employment<br />
Participation Strategy. Specific actions,<br />
such as Indigenous and female employee<br />
mentoring, a review of childcare options<br />
and renewed promotion of flexible work<br />
practices, will be implemented from 2010<br />
to 2012 to increase female and Indigenous<br />
representation.<br />
Indigenous<br />
<strong>Woodside</strong> has also set an aspiration to<br />
triple the number of permanent Indigenous<br />
employees by the end of 2012. In 2009 we<br />
had 36 Indigenous employees, 33 people<br />
on Indigenous employment pathways<br />
programs and 137 Indigenous employees<br />
engaged by construction contractors.<br />
The <strong>Woodside</strong> Indigenous employment<br />
participation strategy aims to provide clear<br />
and accessible pathways to employment.<br />
Once employed, our emphasis is on<br />
promoting a work environment that<br />
motivates and retains employees.<br />
Indigenous community programs, training<br />
providers, school based education<br />
initiatives and direct engagement with<br />
<strong>Woodside</strong> are the entry points into our<br />
Indigenous apprenticeships, traineeships<br />
and cadetship programs.<br />
People capability<br />
In 2009 we continued to implement our<br />
LNG capability plan, a forward-looking<br />
approach, ensuring we have the people to<br />
match our LNG growth aspirations.<br />
Tina Thomas<br />
VICE PRESIDENT, HUMAN RESOURCES<br />
Tina has 20 years industry experience and has been with <strong>Woodside</strong> since 1989.<br />
Despite the economic downturn, we<br />
continued to actively support our longstanding<br />
graduate, apprenticeship and<br />
traineeship programs in recognition that<br />
these programs provide our pipeline of<br />
talent for the future.<br />
Our three-year graduate program<br />
covers disciplines including engineering;<br />
geoscience and subsea; finance;<br />
commercial; health and safety; legal;<br />
environment; business technology; and<br />
supply chain. In 2009 we had a total of<br />
43 people entering the programs.<br />
Our apprenticeship and traineeship<br />
programs currently involve more than 88<br />
apprentices and trainees working towards<br />
their qualifications.<br />
Our approach to development is supported<br />
by a competency framework which<br />
addresses core, leadership and functional<br />
competencies. All staff are assessed<br />
against the core competencies and actions<br />
to address identified gaps are included in<br />
their development plans. All employees<br />
have a personal development plan, which<br />
is developed and agreed at the beginning<br />
of each calendar year and staff are<br />
encouraged to identify training and other<br />
development opportunities for inclusion in<br />
their plans.<br />
Leadership and climate<br />
As an organisation, we measure our<br />
performance improvement by comparing<br />
the level of high performing climates<br />
created by our leaders with the results<br />
from previous years. Since commencing<br />
our leadership development strategy in late<br />
2005, high performance and energising<br />
climates have increased significantly to<br />
6% above the Australian average.The<br />
leadership development programs are<br />
designed to:<br />
Create an organisational climate that<br />
attracts and retains the best people<br />
Develop a culture of high performance<br />
Equip the business to sustainably and<br />
profitably achieve its growth ambitions.<br />
The programs are supported by regular and<br />
ongoing coaching of our leaders with more<br />
than 1000 employees having attended our<br />
leadership development programs.<br />
<strong>Woodside</strong> Petroleum Ltd | Annual Report 2009
Our business principles<br />
<strong>Woodside</strong>'s Business Principles are<br />
categorised into three areas - economic<br />
performance, environmental excellence,<br />
and social contribution. The focus in this<br />
section is on environmental excellence and<br />
social contribution.<br />
Environmental excellence<br />
Ongoing compliance and continued<br />
improvement in environmental<br />
performance is central to <strong>Woodside</strong>’s<br />
sustainable development as a company.<br />
We operate in a range of environments<br />
where our activities have the potential to<br />
impact on land, water, air and ecosystems<br />
as well as neighbours and communities.<br />
We understand that our licence to operate<br />
depends on how well we understand and<br />
protect these environments and reduce<br />
our environmental footprint.<br />
Environmental performance<br />
Air emissions<br />
During 2009 the main change to our air<br />
emission footprint was due to unplanned<br />
flaring from the Maersk Ngujima-Yin<br />
FPSO. This flaring occurred following the<br />
loss of gas compression on the FPSO<br />
used to reinject associated gas during<br />
oil production. A fire on the FPSO in<br />
April damaged the compressor. Gas<br />
compression will be restored on the facility<br />
in the first half of 2010.<br />
The flare rate for our North West Shelf<br />
facilities was well under target. However,<br />
our <strong>annual</strong> flaring target was exceeded as<br />
a result of the Maersk Ngujima-Yin FPSO<br />
flaring issue. The impact of this flaring<br />
on our emissions footprint resulted in<br />
increases in NOx, VOC and greenhouse<br />
emissions during 2009. These changes<br />
have been included in our National<br />
Pollutant Inventory <strong>report</strong>ing.<br />
Biodiversity conservation<br />
<strong>Woodside</strong> has built strong capability<br />
for biological and environmental<br />
impact studies for onshore and marine<br />
environments.<br />
The <strong>annual</strong> monitoring program for the<br />
NWSV performed by an independent<br />
specialist has been conducted for more<br />
than 20 years and continues to show<br />
our operations are not having an adverse<br />
impact on the environment.<br />
Our strategy is to ensure we have in place<br />
high quality baseline studies in support<br />
of environmental impact assessments<br />
required as part of the approvals for our<br />
developments and to conduct ongoing<br />
monitoring of our operational footprint.<br />
During 2009 much of our focus was on<br />
research to support Pluto construction<br />
and our proposed Browse development,<br />
including continued support of a major<br />
research project at Scott Reef.<br />
Environmental incidents<br />
During 2009, we reduced the number<br />
of environmental incidents, with eight<br />
events recorded in 2009 as Category C in<br />
our internal rating system, where A is an<br />
incident with the greatest consequences.<br />
The eight incidents were considered<br />
Category C due to the requirement to<br />
<strong>report</strong> them to government as part of legal<br />
requirements, such as licence conditions<br />
and approval conditions. These incidents<br />
comprised six short-term dark smoke<br />
events, one exceedence of an oil in water<br />
limit and a spill of brine solution to the<br />
ocean offshore.<br />
The eight events represent a significant<br />
reduction in the number of incidents at this<br />
category, with 21 events being recorded<br />
in the previous year. Actual environmental<br />
impacts for all events were negligible with<br />
no long-term environmental impacts.<br />
Recognition<br />
In 2009 <strong>Woodside</strong> was presented with<br />
two environmental awards in recognition<br />
of our sensitive approach to reservoir<br />
appraisal activities at Scott Reef as part of<br />
the Browse LNG Development.<br />
We were awarded the Australian<br />
Petroleum Production and Exploration<br />
Association Environment Award and a<br />
Department of Mines and Petroleum<br />
Rob Cole<br />
ExECUTIVE VICE PRESIDENT, CORPORATE CENTRE, GENERAL COUNSEL<br />
Rob has 20 years experience and has been with <strong>Woodside</strong> since 2006.<br />
Sustainable business<br />
principles<br />
Golden Gecko Award for Environmental Excellence<br />
CO 2 e emissions (kilo tonnes)<br />
Greenhouse gas emissions and intensity<br />
0.25<br />
7,175<br />
1,488<br />
2005<br />
0.27<br />
8,288<br />
1,948<br />
Golden Gecko Award for Environmental<br />
Excellence.<br />
The awards specifically recognise the<br />
research studies to support the Maxima<br />
and Gigas seismic surveys and the drilling<br />
of the Torosa-6 appraisal well at Scott Reef.<br />
Research was undertaken to measure<br />
the potential effects of seismic surveys<br />
on local marine life, demonstrating that<br />
surveys like this can be conducted without<br />
significant effect on the environment.<br />
Innovative techniques, such as a riserless<br />
mud recovery system, were developed for<br />
the Torosa-6 appraisal well to minimise the<br />
environmental footprint.<br />
Further information<br />
on our sustainable<br />
business principles<br />
is available in our<br />
2009 Sustainable<br />
Development<br />
Report.<br />
0.23<br />
7,354<br />
1,644<br />
0.24<br />
7,714<br />
1,980<br />
8,980<br />
2006 2007 2008 2009<br />
Total <strong>annual</strong> CO 2 e emissions for operated ventures<br />
<strong>Woodside</strong> portion of CO 2 e emissions<br />
GHG intensity (t CO 2 e / t HC production)<br />
0.25<br />
2,517<br />
Intensity CO e (tonnes)/hydrocarbon<br />
2<br />
production (tonnes)<br />
Sustainability<br />
29
30<br />
Social contribution<br />
At <strong>Woodside</strong> we believe that long-term<br />
and meaningful relationships with the<br />
communities in which we live and work<br />
are essential to maintaining our licence to<br />
operate.<br />
The trust and confidence of these<br />
communities are fundamental to<br />
our business success. They are also<br />
prerequisites to growing our business,<br />
in our existing communities and in<br />
new communities where we are yet to<br />
establish a presence.<br />
This year was important for <strong>Woodside</strong> as<br />
we refocused our community relations<br />
efforts, with a number of activities<br />
undertaken to improve our understanding<br />
of social impacts, the way in which<br />
we engage with communities and the<br />
effectiveness of our social investments.<br />
The Banglamung boy’s orphanage in Thailand<br />
Social impacts<br />
In recent years <strong>Woodside</strong> has undertaken<br />
social impact assessments to support new<br />
developments and projects such as our<br />
Pluto LNG Development and our Browse<br />
LNG Development .<br />
In 2007 we undertook a social impact<br />
assessment as part of the development<br />
of the Pluto LNG Project, near Karratha,<br />
Western Australia. In 2008 we conducted<br />
an environmental, social and economic<br />
evaluation to assess development options<br />
for our Browse LNG Development. Both<br />
of these studies continue to influence<br />
our thinking in managing existing and<br />
anticipated impacts on communities as a<br />
result of our activities.<br />
In 2009 we sought feedback from<br />
members of the Roebourne community<br />
about our community programs.<br />
Roebourne is about 55 km from our<br />
NWSV and Pluto operations and has a<br />
predominantly Indigenous population. Like<br />
many Australian Indigenous communities,<br />
Roebourne faces social and economic<br />
d<br />
disadvantages, high unemployment, lack<br />
of educational attainment and poor health.<br />
The feedback we received confirmed the<br />
need for <strong>Woodside</strong> to continue to prioritise<br />
training and employment opportunities.<br />
The feedback also reinforced the need for<br />
us to continue operating our Roebourne<br />
office. <strong>Woodside</strong> opened the office in 2007<br />
and is the only resource development<br />
company to have an office in the town.<br />
Social investment<br />
In 2009 <strong>Woodside</strong> also revised our social<br />
investment approach and implemented a<br />
new focus on health and wellbeing. The<br />
program now has three core themes:<br />
Living Energy – personal health and<br />
wellbeing<br />
Natural Energy – environmental health<br />
and wellbeing<br />
Creative Energy – community health<br />
and wellbeing.<br />
Our equity contribution to social<br />
investment in 2009 was over $6 million<br />
inclusive of cash value, in-kind and<br />
voluntary hours. This is an increase of over<br />
$800,000 compared to 2008.<br />
Our total social investment program in<br />
2009 was $9.2 million, an increase of over<br />
$1.3 million compared to our 2008 total<br />
social investment of $7.9 million. This is<br />
inclusive of management costs.<br />
An example of this volunteering activity<br />
was our relationship with Conservation<br />
Volunteers Australia (CVA), where<br />
more than 392 employees volunteered,<br />
representing over 3100 hours, on a range<br />
of environmental programs. Our work<br />
with CVA was recognised in 2009 with<br />
<strong>Woodside</strong>'s social investment by<br />
category 2009<br />
41%<br />
14%<br />
34%<br />
11%<br />
Contribute to sustainable communities<br />
Create, maintain and preserve cultural heritage<br />
Marine and coastal research, protection and rehabilitation<br />
Educate and train our future workforce<br />
the presentation of the Western Australian<br />
Government’s Environmental Award<br />
(Marine and Estuary Category).<br />
In 2009 our employees donated over<br />
$126,000 of their own money, up on<br />
their contribution in 2008 of $119,000.<br />
In 2009 our employees contributed<br />
to 46 community-based not-for-profit<br />
organisations. Specifically our employees<br />
donated over $43,000 to the Mission<br />
Australia and Salvation Army Christmas<br />
appeals.<br />
2010 Reconciliation<br />
Action Plan<br />
The Reconciliation Action Plan (RAP)<br />
articulates clear actions and targets to<br />
support reconciliation efforts and bring<br />
together <strong>Woodside</strong> commitments and<br />
initiatives to Indigenous individuals and<br />
communities.<br />
Our vision for reconciliation is to walk<br />
alongside the local Indigenous community,<br />
with a relationship built on mutual respect,<br />
to provide opportunities that contribute<br />
towards the community’s aspiration of a<br />
sustainable future.<br />
Our goal is for the reconciliation message<br />
to reach every individual coming into<br />
contact with our business.<br />
The RAP commits <strong>Woodside</strong> to more<br />
than 30 actions across three key areas –<br />
respect, relationships and opportunities.<br />
Every action commits <strong>Woodside</strong> to<br />
measurable outcomes and establishes a<br />
timeline to achieve those outcomes.<br />
To view the complete 2010 RAP visit<br />
www.woodside.com.au<br />
<strong>Woodside</strong>'s social investment by<br />
geographic region 2009<br />
74%<br />
14%<br />
National WA Pilbara<br />
Kimberley International<br />
4%<br />
6%<br />
NB: WA includes social investment programs which were<br />
implemented in two or more WA locations.<br />
2%<br />
<strong>Woodside</strong> Petroleum Ltd | Annual Report 2009
Michael A Chaney, AO<br />
BSc, MBA, Hon LLD (UWA), FAICD<br />
Chairman<br />
Term of office: Director since November<br />
2005. Chairman since July 2007.<br />
Independent: Yes.<br />
Age: 59.<br />
Experience: 22 years with Wesfarmers<br />
Limited, including Managing Director<br />
and CEO from 1992 to 2005. Three years<br />
with investment bank Australian Industry<br />
Development Corporation (1980 to 1983),<br />
and prior to that eight years as a petroleum<br />
geologist working on the North West Shelf<br />
and in the USA and Indonesia. Previously<br />
a non-executive director of BHP Billiton<br />
Limited (1995 to 2005) and BHP Billiton Plc<br />
(2001 to 2005).<br />
Committee membership:<br />
Chair of the Nominations Committee.<br />
Attends other Board committee<br />
meetings.<br />
Current directorships:<br />
Chair: Gresham Partners Holdings Limited<br />
(director since 1985) and National Australia<br />
Bank Limited (director since 2004).<br />
Director: The Centre for Independent<br />
Studies Ltd (since 2000).<br />
Chancellor: The University of Western<br />
Australia (since 2006).<br />
Donald R Voelte<br />
BSc (University of Nebraska), FTSE, FAICD<br />
Managing Director and CEO<br />
Term of office: Director since<br />
April 2004.<br />
Independent: No.<br />
Age: 57.<br />
Experience: More than 35 years<br />
experience in the global oil and gas<br />
business, including 22 years with Mobil<br />
Corporation culminating as Executive<br />
Vice President New Exploration and<br />
Producing Ventures, three years with<br />
Atlantic Richfield Company ending as<br />
Executive Vice President International<br />
Exploration and Production and three<br />
years as Director, President and CEO of<br />
Chroma Energy Inc, a private exploration<br />
and production company.<br />
Committee membership:<br />
Attends Board committee meetings.<br />
Current directorships:<br />
Director: The University of Western<br />
Australia Business School (since 2006) and<br />
West Australian Newspapers Holdings<br />
Limited (since 2008).<br />
Board of Directors<br />
Melinda A Cilento<br />
BA, BEc (Hons), MEc<br />
Term of office: Director since December<br />
2008.<br />
Independent: Yes.<br />
Age: 44.<br />
Experience: Deputy Chief Executive<br />
(since 2006) and Chief Economist<br />
(since 2002) of the Business Council of<br />
Australia. Significant public and private<br />
sector experience in economic policy<br />
development and analysis. Previously<br />
worked with County Investment<br />
Management (now Invesco) as Head of<br />
Economics, and with the Department of<br />
Treasury in various roles, and spent two<br />
years at the International Monetary Fund.<br />
Committee membership:<br />
Member of the Human Resources<br />
& Compensation, Sustainability and<br />
Nominations Committees.<br />
From left to right: Din Megat, Ian Robertson, Melinda Cilento, Michael Chaney, David McEvoy,<br />
Andrew Jamieson, Erich Fraunschiel, Don Voelte, Pierre Jungels<br />
31 <strong>Woodside</strong> Petroleum Ltd | Annual Report 2008<br />
Governance<br />
31
32<br />
Erich Fraunschiel<br />
BCom (Hons) (UWA)<br />
Term of office: Director since December<br />
2002.<br />
Independent: Yes.<br />
Age: 64.<br />
Experience: More than 18 years<br />
experience in senior executive positions<br />
with Wesfarmers Limited, including 10<br />
years as CFO and Executive Director.<br />
Committee membership:<br />
Chair of the Audit & Risk Committee.<br />
Member of the Sustainability and<br />
Nominations Committees.<br />
Current directorships:<br />
Chair: The West Australian Opera Company<br />
(director since 1999) and Wesfarmers<br />
General Insurance Limited (since 2003).<br />
Director: Rabobank Australia Limited (since<br />
2003), Rabobank New Zealand Limited<br />
(since 2007), The WCM Group Ltd (since<br />
2005) and WorleyParsons Limited (since<br />
2003).<br />
Directorships of other listed entities<br />
within the past three years:<br />
Director: West Australian Newspapers<br />
Holdings Limited (2002 to 2008).<br />
Andrew Jamieson, OBE<br />
F.R.Eng., C.Eng., F. Inst Chem E.<br />
Term of office: Director since<br />
February 2005.<br />
Independent: Yes.<br />
Age: 62.<br />
Experience: Former Executive Vice<br />
President Gas and Projects of Shell Gas<br />
and Power International BV with more than<br />
30 years experience with Shell in Europe,<br />
Australia and Africa. From 1997 to 1999<br />
Dr Jamieson was seconded to <strong>Woodside</strong><br />
as General Manager North West Shelf<br />
Venture. Retired from Shell in June 2009.<br />
Committee membership:<br />
Member of the Sustainability and<br />
Nominations Committees.<br />
Current directorships:<br />
Director: Leif Hoegh & Co Ltd (since 2009)<br />
and Oxford Catalysts Group PLC (since<br />
2010).<br />
Pierre JMH Jungels, CBE<br />
PhD (Geophysics and Hydraulics) (Caltech)<br />
Term of office: Director since December<br />
2002.<br />
Independent: Yes.<br />
Age: 66.<br />
Experience: Former CEO of Enterprise<br />
Oil plc and President of the Institute of<br />
Petroleum. More than 30 years experience<br />
in the international oil and gas industry.<br />
Committee membership:<br />
Member of the Human Resources<br />
& Compensation, Audit & Risk and<br />
Nominations Committees.<br />
Current directorships:<br />
Chair: Oxford Catalysts Group PLC (since<br />
2006) and Rockhopper Exploration plc<br />
(since 2005).<br />
Director: Baker Hughes Inc (since 2006)<br />
and Imperial Tobacco Group PLC (since<br />
2002).<br />
Directorships of other listed entities<br />
within the past three years:<br />
Director: Offshore Hydrocarbon Mapping<br />
plc (2004 to 2008) and Offshore Logistics<br />
Inc (2002 to 2006).<br />
David I McEvoy<br />
BSc (Physics), Grad Dip (Geophysics)<br />
Term of office: Director since September<br />
2005.<br />
Independent: Yes.<br />
Age: 63.<br />
Experience: 34 year career with<br />
ExxonMobil involving extensive<br />
international exploration and development<br />
experience.<br />
Committee membership:<br />
Chair of the Sustainability Committee.<br />
Member of the Audit & Risk and<br />
Nominations Committees.<br />
Current directorships:<br />
Director: AWE Limited (since 2006),<br />
Innamincka Petroleum Ltd (since 2002) and<br />
Po Valley Energy Ltd (since 2004).<br />
Ian Robertson<br />
BA (Business Management), FCMA (UK)<br />
Term of office: Director since June 2008.<br />
Independent: No.<br />
Age: 51.<br />
Experience: Almost 30 years experience<br />
with Royal Dutch Shell Group working in<br />
the downstream, upstream, transport and<br />
trading elements of the business. Currently<br />
Executive Vice President for Shell’s finance<br />
operations.<br />
Committee membership:<br />
Member of the Audit & Risk and<br />
Nominations Committees.<br />
Tan Sri Dato’ Megat Zaharuddin<br />
(Din Megat)<br />
BSc (Hons) (Mining Engineering)<br />
Term of office: Director since December<br />
2007.<br />
Independent: Yes.<br />
Age: 61.<br />
Experience: 31 year career with Royal<br />
Dutch Shell Group including Regional<br />
Business CEO of Shell Exploration and<br />
Production BV with responsibilities for the<br />
Middle East, Central and South Asia and<br />
Russia region (1999 to 2004) and Chairman<br />
/CEO of Shell group companies in Malaysia<br />
(1995 to 1999). Retired from Shell in early<br />
2004.<br />
Committee membership:<br />
Chair of the Human Resources &<br />
Compensation Committee. Member<br />
of Sustainability and Nominations<br />
Committees.<br />
Current directorships:<br />
Chair: Malaysian Rubber Board<br />
(since 2009) and Malayan Banking Berhad<br />
(since October 2009, director from 2004 to<br />
February 2009).<br />
Director: International Centre for<br />
Leadership in Finance (since 2004).<br />
Directorships of other listed entities<br />
within the past three years:<br />
Chair: Maxis Communications Berhad<br />
(2004 to 2007).<br />
<strong>Woodside</strong> Petroleum Ltd | Annual Report 2009
Corporate governance<br />
statement<br />
Contents<br />
1. Corporate Governance at <strong>Woodside</strong> 34<br />
2. Board of Directors 35<br />
2.1 Board Role and Responsibilities 35<br />
2.2 Board Composition 35<br />
2.3 Chairman 35<br />
2.4 Director Independence 35<br />
2.5 Conflicts of Interest 36<br />
2.6 Board Succession Planning 36<br />
2.7 Directors’ Retirement and Re-election 37<br />
2.8 Terms of Appointment, Induction Training<br />
and Continuing Education 37<br />
2.9 Board Performance Evaluation 37<br />
2.10 Board Access to Information and<br />
Independent Advice 37<br />
2.11 Directors’ Remuneration 37<br />
2.12 Board Meetings 37<br />
2.13 Company Secretaries 38<br />
3. Committees of the Board 38<br />
3.1 Board Committees, Membership and<br />
Charters<br />
38<br />
3.2 Audit & Risk Committee 38<br />
3.3 Nominations Committee 38<br />
3.4 Human Resources & Compensation<br />
Committee<br />
3.5 Sustainability Committee 39<br />
4. Shareholders 39<br />
4.1 Shareholder Communication 39<br />
4.2 Continuous Disclosure and Market<br />
Communications<br />
5. Promoting Responsible and<br />
Ethical Behaviour 40<br />
5.1 Code of Conduct and Whistleblower<br />
Policy 40<br />
5.2 Securities Ownership and Dealing 40<br />
5.3 Political Donations 41<br />
6. Risk Management and<br />
Internal Control 41<br />
6.1 Approach to Risk Management and<br />
Internal Control<br />
41<br />
6.2 Risk Management Roles and<br />
Responsibilities 41<br />
6.3 Internal Audit 41<br />
6.4 CEO and CFO Assurance 42<br />
7. External Auditor Relationship 42<br />
8. ASX Corporate Governance Council<br />
Recommendations Checklist 43<br />
38<br />
40<br />
Governance<br />
33
34<br />
1 Corporate Governance<br />
at <strong>Woodside</strong><br />
<strong>Woodside</strong> is committed to a high level<br />
of corporate governance and fostering<br />
a culture that values ethical behaviour,<br />
integrity and respect.<br />
This statement <strong>report</strong>s on <strong>Woodside</strong>’s key<br />
governance principles and practices. These<br />
principles and practices are reviewed<br />
regularly and revised as appropriate to<br />
reflect changes in law and developments<br />
in corporate governance.<br />
<strong>Woodside</strong>’s corporate governance<br />
model is set out below. During 2009<br />
the company reviewed and made<br />
substantial improvements to the <strong>Woodside</strong><br />
Audit & Risk<br />
Committee<br />
Human Resources<br />
& Compensation<br />
Committee<br />
Independent<br />
Assurance<br />
External<br />
Auditors<br />
Internal<br />
Audit<br />
Management System (WMS) which sets<br />
out how <strong>Woodside</strong> provides management<br />
governance and assurance. The WMS<br />
defines how <strong>Woodside</strong> will deliver its<br />
business objectives and the boundaries<br />
within which <strong>Woodside</strong> employees and<br />
contractors are expected to work.<br />
The company, as a listed entity, must<br />
comply with the Corporations Act 2001<br />
(Cwlth) (Corporations Act), the Australian<br />
Securities Exchange (ASX) Listing Rules<br />
(ASX Listing Rules) and other Australian<br />
and international laws. The ASX Listing<br />
Rules require the company to <strong>report</strong> on<br />
the extent to which it has followed the<br />
Corporate Governance Recommendations<br />
contained in the ASX Corporate<br />
Governance Council’s (ASXCGC) second<br />
<strong>Woodside</strong> Corporate Governance Model<br />
Shareholders<br />
Delegation<br />
Board<br />
Chief Executive Officer<br />
Policies<br />
Authorities Framework<br />
Accountability<br />
edition of its Corporate Governance<br />
Principles and Recommendations (August<br />
2007). Details of <strong>Woodside</strong>’s compliance<br />
with the ASXCGC Recommendations are<br />
set out below.<br />
A checklist cross-referencing the<br />
ASXCGC Recommendations to the<br />
relevant sections of this statement and<br />
the Remuneration Report is provided on<br />
page 43 of this <strong>report</strong> and is published<br />
in the corporate governance section of<br />
<strong>Woodside</strong>’s website<br />
(www.woodside.com.au).<br />
<strong>Woodside</strong> believes that, throughout the<br />
2009 year and to the date of this <strong>report</strong>,<br />
it has complied with all the ASXCGC<br />
Recommendations.<br />
Nominations<br />
Committee<br />
Management Governance<br />
and Assurance<br />
Mission<br />
Vision<br />
Values<br />
Policies<br />
Management Standards<br />
Operating Standards<br />
<strong>Woodside</strong> Management System<br />
Sustainability<br />
Committee<br />
Management Committees<br />
Standards<br />
<strong>Woodside</strong> Petroleum Ltd | Annual Report 2009
2 Board of Directors<br />
2.1 Board Role and Responsibilities<br />
ASXCGC Recommendations 1.1, 1.3<br />
The Board has approved a formal Board<br />
Charter which details the Board’s role,<br />
powers, duties and functions. The central<br />
role of the Board is to set the company’s<br />
strategic direction, to select and appoint<br />
a CEO and to oversee the company’s<br />
management and business activities.<br />
In addition to matters required by law to<br />
be approved by the Board, the following<br />
powers are reserved to the Board for<br />
decision:<br />
the appointment and removal of the<br />
CEO and the Company Secretary and<br />
determination of their remuneration<br />
and conditions of service;<br />
approving the appointment and, where<br />
appropriate, the removal of executives<br />
who <strong>report</strong> directly to the CEO<br />
together with their remuneration and<br />
conditions of service;<br />
approving Group remuneration<br />
issues, including periodic adjustments<br />
and short and long term incentive<br />
payments;<br />
approving senior management<br />
succession plans and significant<br />
changes to organisational structure;<br />
authorising the issue of shares,<br />
options, equity instruments or other<br />
securities;<br />
authorising borrowings, other than<br />
in the ordinary course of business,<br />
and the granting of security over the<br />
undertaking of the company or any of<br />
its assets;<br />
authorising expenditures which exceed<br />
the CEO’s delegated authority levels;<br />
approving strategic plans and budgets;<br />
approving the acquisition,<br />
establishment, disposal or cessation<br />
of any significant business of the<br />
company;<br />
approving <strong>annual</strong> and half year<br />
<strong>report</strong>s and disclosures to the market<br />
that contain or relate to financial<br />
projections, statements as to future<br />
financial performance or changes to<br />
the policy or strategy of the company;<br />
approving policies of company-wide or<br />
general application;<br />
the appointment of directors who will<br />
come before shareholders for election<br />
at the next Annual General Meeting<br />
(AGM); and<br />
establishing procedures which ensure<br />
that the Board is in a position to<br />
exercise its powers and to discharge<br />
its responsibilities as set out in the<br />
Board Charter.<br />
Other than as specifically reserved to the<br />
Board in the Board Charter, responsibility<br />
for the management of <strong>Woodside</strong>’s<br />
business activities is delegated to the<br />
CEO who is accountable to the Board.<br />
The Board Charter and the delegation of<br />
Board authority to the CEO are reviewed<br />
regularly.<br />
A copy of the Board Charter is available<br />
in the corporate governance section of<br />
<strong>Woodside</strong>’s website.<br />
2.2 Board Composition<br />
ASXCGC Recommendations 2.1, 2.2, 2.3,<br />
2.6<br />
The Board is comprised of eight nonexecutive<br />
directors and the CEO. Details of<br />
the directors, including their qualifications,<br />
experience, date of appointment and<br />
independent status, are set out on pages<br />
31 to 32.<br />
The Board considers that collectively<br />
the directors have the range of skills,<br />
knowledge and experience necessary to<br />
direct the company. The non-executive<br />
directors contribute operational and<br />
international experience, an understanding<br />
of the industry in which <strong>Woodside</strong><br />
operates, knowledge of financial markets<br />
and an understanding of the health, safety,<br />
environmental and community matters<br />
that are important to the company. The<br />
CEO brings an additional perspective to the<br />
Board through a thorough understanding<br />
of <strong>Woodside</strong>’s business.<br />
In assessing the composition of the Board,<br />
the directors have regard to the following<br />
principles:<br />
the Chairman should be non-executive,<br />
independent and an Australian citizen<br />
or permanent resident;<br />
the role of the Chairman and the<br />
CEO should not be filled by the same<br />
person;<br />
the CEO should be a full-time<br />
employee of the company;<br />
the majority of the Board should<br />
comprise directors who are both nonexecutive<br />
and independent;<br />
the Board should represent a broad<br />
range of qualifications, experience and<br />
expertise considered of benefit to the<br />
company; and<br />
the number of Shell-nominated<br />
directors, as a proportion of the Board,<br />
should normally be in the proportion<br />
that Shell’s holding of fully paid<br />
ordinary shares in the company bears<br />
to all of the issued fully paid ordinary<br />
shares in the company.<br />
For the time being the Board has<br />
determined that the number of directors<br />
on the Board should be eight nonexecutive<br />
directors and the CEO. This<br />
number may be increased (providing it<br />
does not exceed 15) where it is felt that<br />
additional expertise is required in specific<br />
areas, where an outstanding candidate is<br />
identified or to ensure a smooth transition<br />
between outgoing and incoming nonexecutive<br />
directors.<br />
2.3 Chairman<br />
ASXCGC Recommendations 2.2, 2.3<br />
The Chairman of the Board, Mr Michael<br />
Chaney, is an independent, non-executive<br />
director and a resident Australian citizen.<br />
The Chairman is responsible for leadership<br />
and effective performance of the Board<br />
and for the maintenance of relations<br />
between directors and management<br />
that are open, cordial and conducive to<br />
productive cooperation. The Chairman’s<br />
responsibilities are set out in more detail in<br />
the Board Charter.<br />
A copy of the Board Charter is available<br />
in the corporate governance section of<br />
<strong>Woodside</strong>’s website.<br />
Mr Chaney is also Chairman of National<br />
Australia Bank Limited (NAB). The Board<br />
considers that neither his Chairmanship of<br />
NAB, nor any of his other commitments<br />
(listed on page 31), interfere with the<br />
discharge of his duties to the company. The<br />
Board is satisfied that Mr Chaney commits<br />
the time necessary to discharge his role<br />
effectively.<br />
2.4 Director Independence<br />
ASXCGC Recommendations 2.1, 2.6<br />
The independence of a director is<br />
assessed in accordance with <strong>Woodside</strong>’s<br />
Policy on Independence of Directors.<br />
A copy of the Policy on Independence<br />
of Directors is available in the corporate<br />
governance section of <strong>Woodside</strong>’s<br />
website.<br />
In accordance with the policy, the Board<br />
assesses independence with reference to<br />
whether a director is non-executive, not a<br />
member of management and who is free<br />
of any business or other relationship that<br />
could materially interfere with, or could<br />
reasonably be perceived to materially<br />
interfere with, the independent exercise of<br />
their judgement.<br />
Governance<br />
35
36<br />
2 Board of Directors (continued)<br />
In making this assessment, the<br />
Board considers all relevant facts and<br />
circumstances. Relationships that the<br />
Board will take into consideration when<br />
assessing independence are whether a<br />
director:<br />
is a substantial shareholder of the<br />
company or an officer of, or otherwise<br />
associated directly with, a substantial<br />
shareholder of the company;<br />
is employed, or has previously been<br />
employed in an executive capacity<br />
by the company or another Group<br />
member, and there has not been a<br />
period of at least three years between<br />
ceasing such employment and serving<br />
on the Board;<br />
has within the last three years been<br />
a principal of a material professional<br />
advisor or a material consultant to the<br />
company or another Group member,<br />
or an employee materially associated<br />
with the service provided;<br />
is a material supplier or customer of<br />
the company or other Group member,<br />
or an officer of or otherwise associated<br />
directly or indirectly with a material<br />
supplier or customer; or<br />
has a material contractual relationship<br />
with the company or another Group<br />
member other than as a director.<br />
The test of whether a relationship or<br />
business is material is based on the nature<br />
of the relationship or business and on<br />
the circumstances and activities of the<br />
director. Materiality is considered from the<br />
perspective of the company and its Group<br />
members, the persons or organisations<br />
with which the director has an affiliation<br />
and from the perspective of the director.<br />
To assist in assessing the materiality<br />
of a supplier or customer the Board<br />
has adopted the following materiality<br />
thresholds:<br />
a material customer is a customer of<br />
<strong>Woodside</strong> which accounts for more<br />
than 2% of <strong>Woodside</strong>’s consolidated<br />
gross revenue; and<br />
a supplier is material if <strong>Woodside</strong><br />
accounts for more than 2% of the<br />
supplier’s consolidated gross revenue.<br />
The Board reviews the independence<br />
of directors before they are appointed<br />
and on an <strong>annual</strong> basis. The Board has<br />
reviewed the independence of each of<br />
the directors in office at the date of this<br />
<strong>report</strong> and has determined that seven of<br />
the nine directors are independent. The<br />
two directors that are not considered<br />
independent are:<br />
Mr Don Voelte as he is an<br />
executive director and a member of<br />
management; and<br />
Mr Ian Robertson as he is a<br />
current executive of Shell, which<br />
is a substantial shareholder of the<br />
company.<br />
Dr Andrew Jamieson was nominated<br />
to the <strong>Woodside</strong> Board by Shell and<br />
was previously an executive of Shell.<br />
He retired from Shell on 30 June 2009<br />
and continues to serve on the <strong>Woodside</strong><br />
Board. Subsequent to his retirement, the<br />
<strong>Woodside</strong> Board assessed Dr Jamieson as<br />
being an independent director.<br />
Mr Din Megat was nominated to the<br />
<strong>Woodside</strong> Board by Shell. Over five years<br />
have elapsed since Mr Megat retired as an<br />
executive of Shell.<br />
The Board is satisfied that Dr Jamieson<br />
and Mr Megat have no continuing<br />
association with Shell that would<br />
interfere with their independent exercise<br />
of judgement, and that each is an<br />
independent director.<br />
Mr Erich Fraunschiel serves on the board<br />
of directors of WorleyParsons Limited,<br />
a supplier of engineering services to<br />
<strong>Woodside</strong>. The value of services provided<br />
by the WorleyParsons Limited group of<br />
companies to <strong>Woodside</strong> in 2009 exceeded<br />
the Board’s materiality threshold relating<br />
to suppliers. The Board, having regard to<br />
the nature and value of the commercial<br />
relationship between <strong>Woodside</strong> and<br />
WorleyParsons Limited is satisfied that Mr<br />
Fraunschiel remains independent. Where<br />
a matter involving WorleyParsons Limited<br />
comes before the Board, the Directors’<br />
Conflict of Interest Guidelines apply.<br />
Certain non-executive directors hold<br />
directorships or executive positions in<br />
companies with which <strong>Woodside</strong> has<br />
commercial relationships. Details of other<br />
directorships and executive positions held<br />
by non-executive directors are set out on<br />
pages 31 to 32.<br />
Two of the non-executive directors have<br />
been employed by <strong>Woodside</strong> in the past,<br />
however a significant period of time has<br />
lapsed since they ceased employment. Dr<br />
Jamieson was seconded to <strong>Woodside</strong> as<br />
General Manager NWS Venture from 1997<br />
to 1999 and Mr Chaney was employed by<br />
<strong>Woodside</strong> as a petroleum geologist in the<br />
1970s.<br />
The independence status of directors<br />
standing for election or re-election is<br />
identified in the notice of AGM. If the<br />
Board’s assessment of a director’s<br />
independence changes, the change is<br />
disclosed to the market.<br />
2.5 Conflicts of Interest<br />
The Board has approved Directors’ Conflict<br />
of Interest Guidelines which apply if<br />
there is, or may be, a conflict between<br />
the personal interests of a director, or<br />
the duties a director owes to another<br />
company, and the duties the director owes<br />
to <strong>Woodside</strong>. A director with an actual<br />
or potential conflict of interest in relation<br />
to a matter before the Board does not<br />
receive the Board papers relating to that<br />
matter and when the matter comes before<br />
the Board for discussion, the director<br />
withdraws from the meeting for the period<br />
the matter is considered and takes no<br />
part in the discussions or decision-making<br />
process.<br />
Minutes <strong>report</strong>ing on matters in which a<br />
director is considered to have a conflict of<br />
interest are not provided to that director.<br />
However, the director is given notice of the<br />
broad nature of the matter for discussion<br />
and is updated in general terms on the<br />
progress of the matter.<br />
2.6 Board Succession Planning<br />
ASXCGC Recommendation 2.6<br />
The Board manages its succession<br />
planning with the assistance of the<br />
Nominations Committee. The committee<br />
reviews <strong>annual</strong>ly the size and composition<br />
of the Board and the mix of existing and<br />
desired competencies across members<br />
and <strong>report</strong>s its conclusions to the<br />
Board. Where the committee identifies<br />
existing or projected competency gaps,<br />
it recommends a succession plan to<br />
the Board that addresses those gaps.<br />
Recognising the importance of Board<br />
renewal, the committee takes each<br />
director’s tenure into consideration in its<br />
succession planning. As a general rule<br />
directors are not expected to serve on the<br />
Board beyond 10 years.<br />
The Nominations Committee is responsible<br />
for evaluating Board candidates and<br />
recommending individuals for appointment<br />
to the Board. The committee evaluates<br />
prospective candidates against a range<br />
of criteria including skills, experience and<br />
expertise that will best complement Board<br />
effectiveness at the time. The Board may<br />
engage an independent recruitment firm to<br />
undertake a search for suitable candidates.<br />
Directors appointed by the Board are<br />
subject to shareholder election at the next<br />
AGM.<br />
<strong>Woodside</strong> Petroleum Ltd | Annual Report 2009
2 Board of Directors (continued)<br />
Prior to appointment, preferred candidates<br />
must disclose to the Chairman the nature<br />
and extent of their other appointments<br />
and activities. Candidates must also<br />
demonstrate that they understand what<br />
is expected of them and confirm that<br />
they are willing to make the necessary<br />
commitments, and will have available<br />
the time required, to discharge their<br />
responsibilities as a director.<br />
A copy of the Nominations Committee<br />
charter and a description of <strong>Woodside</strong>’s<br />
procedure for the selection and<br />
appointment of new directors and the reelection<br />
of incumbent directors is available<br />
in the corporate governance section of<br />
<strong>Woodside</strong>’s website.<br />
2.7 Directors’ Retirement and Reelection<br />
ASXCGC Recommendation 2.6<br />
Non-executive directors must retire at<br />
the third AGM following their election or<br />
most recent re-election. At least one nonexecutive<br />
director must stand for election<br />
at each AGM. Any director appointed to<br />
fill a casual vacancy since the date of the<br />
previous AGM must submit themselves to<br />
shareholders for election at the next AGM.<br />
Board support for a director’s re-election is<br />
not automatic and is subject to satisfactory<br />
director performance (in accordance with<br />
the evaluation process described in section<br />
2.9).<br />
2.8 Terms of Appointment, Induction<br />
Training and Continuing<br />
Education<br />
All new directors are required to sign and<br />
return a letter of appointment which sets<br />
out the key terms and conditions of their<br />
appointment, including duties, rights and<br />
responsibilities, the time commitment<br />
envisaged and the Board’s expectations<br />
regarding their involvement with<br />
committee work.<br />
Induction training is provided to all new<br />
directors. It includes a comprehensive<br />
induction manual, meetings with the<br />
CEO and senior executives, information<br />
on the strategic plan and key corporate<br />
and Board policies and the option to visit<br />
<strong>Woodside</strong>’s principle operations either<br />
upon appointment or with the Board during<br />
its next site tour.<br />
All directors are expected to maintain<br />
the skills required to discharge their<br />
obligations to the company. Directors<br />
are encouraged to undertake continuing<br />
professional education including industry<br />
seminars and approved education<br />
courses. These are paid for by the<br />
company where appropriate. In addition,<br />
the company provides the Board with<br />
regular educational information papers and<br />
presentations on industry-related matters<br />
and new developments with the potential<br />
to affect <strong>Woodside</strong>.<br />
2.9 Board Performance Evaluation<br />
ASXCGC Recommendations 1.3, 2.5, 2.6<br />
The Nominations Committee is responsible<br />
for determining the process for evaluating<br />
Board performance. Evaluations are<br />
conducted every year and have produced<br />
improvements in Board processes and<br />
overall efficiency.<br />
The Board performance evaluation process<br />
is conducted by way of questionnaires<br />
appropriate in scope and content to<br />
effectively review:<br />
the performance of the Board and<br />
each of its committees against the<br />
requirements of their respective<br />
charters; and<br />
the individual performance of the<br />
Chairman and each director.<br />
The questionnaires are completed by each<br />
director and the responses compiled by an<br />
external consultant. The <strong>report</strong>s on Board<br />
and committee performance are provided<br />
to all directors and discussed by the Board.<br />
The <strong>report</strong> on the Chairman’s performance<br />
is provided to the Chairman and to two<br />
Committee Chairmen for discussion.<br />
The <strong>report</strong> on each individual director is<br />
provided to the individual and copied to the<br />
Chairman. The Chairman meets individually<br />
with each director to discuss the findings<br />
of their <strong>report</strong>.<br />
The performance of each director retiring<br />
at the next AGM is taken into account by<br />
the Board in determining whether or not<br />
the Board should support the re-election of<br />
the director.<br />
The Human Resources & Compensation<br />
Committee makes recommendations to<br />
the Board on the criteria for the evaluation<br />
of the performance of the CEO. The<br />
Board conducts the evaluation of the<br />
performance of the CEO.<br />
A description of the company’s process<br />
for evaluation of the Board, its committees<br />
and individual directors is available in<br />
the corporate governance section of<br />
<strong>Woodside</strong>’s website.<br />
The Remuneration Report on pages 45<br />
to 59 discloses the process for evaluating<br />
the performance of senior executives,<br />
including the CEO.<br />
In 2009, performance evaluations for the<br />
Board, its committees, directors and senior<br />
executives took place in accordance with<br />
the process disclosed above and in the<br />
Remuneration Report.<br />
2.10 Board Access to Information and<br />
Independent Advice<br />
ASXCGC Recommendation 2.6<br />
Subject to the Directors’ Conflict of<br />
Interest Guidelines referred to in section<br />
2.5, directors have direct access to<br />
members of company management and to<br />
company information in the possession of<br />
management.<br />
The Board has agreed a procedure under<br />
which directors are entitled to obtain<br />
independent legal, accounting or other<br />
professional advice at the company’s<br />
expense. Directors are entitled to<br />
reimbursement of all reasonable costs<br />
where a request for such advice is<br />
approved by the Chairman. In the case of a<br />
request made by the Chairman, approval is<br />
required by a majority of the non-executive<br />
directors.<br />
2.11 Directors’ Remuneration<br />
Details of remuneration paid to directors<br />
(executive and non-executive) are set out in<br />
the Remuneration Report on pages 45 to<br />
59. The Remuneration Report also contains<br />
information on the company’s policy for<br />
determining the nature and amount of<br />
remuneration for directors and senior<br />
executives and the relationship between<br />
the policy and company performance.<br />
Shareholders will be invited to consider<br />
and approve the Remuneration Report at<br />
the 2010 AGM.<br />
2.12 Board Meetings<br />
During the year ended 31 December 2009,<br />
the Board held six Board meetings. In<br />
addition a strategic planning session was<br />
held in conjunction with the June Board<br />
meeting. Details of directors’ attendance at<br />
Board and committee meetings are set out<br />
in Table 1 on page 39.<br />
The Chairman, in conjunction with the<br />
CEO and the Company Secretary, sets<br />
the agenda for each meeting. Any director<br />
may request matters be included on the<br />
agenda.<br />
Typically at Board meetings the agenda will<br />
include:<br />
minutes of the previous meeting and<br />
matters arising;<br />
the CEO’s <strong>report</strong>;<br />
the CFO’s <strong>report</strong>;<br />
<strong>report</strong>s on major projects and current<br />
issues;<br />
Governance<br />
37
38<br />
2 Board of Directors (continued)<br />
specific business proposals;<br />
<strong>report</strong>s from the chairs of the<br />
committees on matters considered at<br />
committee meetings; and<br />
minutes of previous committee<br />
meetings.<br />
The Board works to an <strong>annual</strong> agenda<br />
encompassing periodic reviews of<br />
<strong>Woodside</strong>’s operating business units,<br />
site visits, approval of strategy, business<br />
plans, budgets and financial statements,<br />
statutory obligations and other<br />
responsibilities identified in the Board<br />
Charter.<br />
The CFO, General Counsel and Company<br />
Secretary attend meetings of the Board<br />
by invitation. Other members of senior<br />
management attend Board meetings<br />
when a matter under their area of<br />
responsibility is being considered or as<br />
otherwise requested by the Board.<br />
At each scheduled Board meeting there<br />
is a session for non-executive directors to<br />
meet without management present. This<br />
session is presided over by the Chairman.<br />
Copies of Board papers are circulated<br />
in advance of the meetings in either<br />
electronic or hard copy form. Directors are<br />
entitled to request additional information<br />
where they consider further information is<br />
necessary to support informed decisionmaking.<br />
2.13 Company Secretaries<br />
Details of the Company Secretaries<br />
are set out on page 44 in the Directors’<br />
Report. The appointment and removal<br />
of a Company Secretary is a matter for<br />
decision by the Board. The Company<br />
Secretaries are responsible for ensuring<br />
that Board procedures are complied<br />
with and that governance matters are<br />
addressed.<br />
3 Committees of the<br />
Board<br />
3.1 Board Committees, Membership<br />
and Charters<br />
ASXCGC Recommendations 2.4, 2.6, 4.1,<br />
4.2, 4.3, 4.4, 8.1, 8.3<br />
The Board has four standing committees<br />
to assist in the discharge of its<br />
responsibilities. These are the:<br />
Audit & Risk Committee;<br />
Nominations Committee;<br />
Human Resources & Compensation<br />
Committee; and<br />
Sustainability Committee.<br />
The committees operate principally in<br />
a review or advisory capacity, except<br />
in cases where powers are specifically<br />
conferred on a committee by the Board.<br />
Each committee has a charter, detailing<br />
its role, duties and membership<br />
requirements. The committee charters<br />
are reviewed regularly and updated as<br />
required.<br />
The composition of each committee and<br />
the attendance of members at meetings<br />
held during the year, is set out in Table 1<br />
on page 39 of this <strong>report</strong>.<br />
Each committee’s charter is available<br />
in the corporate governance section of<br />
<strong>Woodside</strong>’s website.<br />
All directors are entitled to attend<br />
meetings of the standing committees.<br />
Papers considered by the standing<br />
committees are available on request to<br />
directors who are not on that committee.<br />
Minutes of the standing committee<br />
meetings are provided to all directors<br />
and the proceedings of each meeting are<br />
<strong>report</strong>ed by the chair of the committee at<br />
the next Board meeting.<br />
Each committee is entitled to seek<br />
information from any employee of the<br />
company and to obtain any professional<br />
advice it requires in order to perform its<br />
duties.<br />
Ad hoc committees are convened to<br />
consider matters of special importance or<br />
to exercise the delegated authority of the<br />
Board.<br />
3.2 Audit & Risk Committee<br />
ASXCGC Recommendations 4.1, 4.2, 4.3,<br />
4.4<br />
The role of the Audit & Risk Committee<br />
is to assist the Board to meet its<br />
oversight responsibilities in relation<br />
to the company’s financial <strong>report</strong>ing,<br />
compliance with legal and regulatory<br />
requirements, internal control structure,<br />
risk management procedures and the<br />
internal and external audit functions.<br />
Key activities undertaken by the Audit &<br />
Risk Committee during the year included:<br />
approval of the scope, plan and fees<br />
for the 2009 external audit;<br />
review of the independence and<br />
performance of the external auditor;<br />
review of significant accounting<br />
policies and practices;<br />
review of Internal Audit <strong>report</strong>s and<br />
approval of the 2010 Internal Audit<br />
program;<br />
review of the Group’s key risks and<br />
revised risk management framework;<br />
review of <strong>report</strong>s from management<br />
on the effectiveness of the Group’s<br />
management of its material business<br />
risks;<br />
review of updates from management<br />
on the revised <strong>Woodside</strong><br />
Management System; and<br />
review and recommendation to<br />
the Board for the adoption of the<br />
Group’s half year and <strong>annual</strong> financial<br />
statements.<br />
Members of the Audit & Risk Committee<br />
are identified in Table 1 on page 39. Their<br />
qualifications are listed on pages 31 and<br />
32.<br />
The external auditors, the Chairman, the<br />
CEO, the CFO, General Counsel, the<br />
Group Financial Controller, the head of<br />
Internal Audit and the head of Enterprise<br />
Risk attend Audit & Risk Committee<br />
meetings by invitation. At each committee<br />
meeting, time is scheduled for the<br />
committee to meet with the external<br />
auditors without management present.<br />
3.3 Nominations Committee<br />
ASXCGC Recommendations 2.4, 2.6<br />
The role of the Nominations Committee<br />
is to assist the Board to review Board<br />
composition, performance and succession<br />
planning. This includes the identifying,<br />
evaluating and recommending of<br />
candidates for the Board.<br />
Key activities undertaken by the<br />
Nominations Committee during the year<br />
included:<br />
review of the size and composition of<br />
the Board;<br />
review of Board succession plans; and<br />
approval of the process for the <strong>annual</strong><br />
Board performance evaluation.<br />
3.4 Human Resources &<br />
Compensation Committee<br />
ASXCGC Recommendations 8.1, 8.3<br />
The role of the Human Resources &<br />
Compensation Committee is to assist the<br />
Board in establishing human resources<br />
and compensation policies and practices<br />
which:<br />
enable the company to attract, retain<br />
and motivate employees who achieve<br />
operational excellence and create<br />
value for shareholders; and<br />
reward employees fairly and<br />
responsibly, having regard to the<br />
results of the Group, individual<br />
<strong>Woodside</strong> Petroleum Ltd | Annual Report 2009
3 Committees of the Board (continued)<br />
performance and general remuneration<br />
conditions.<br />
Key activities undertaken by the Human<br />
Resources & Compensation Committee<br />
during the year included:<br />
review of the effect of changes to the<br />
tax treatment of employee share plan;<br />
approval of the appointment and<br />
remuneration packages of executives<br />
<strong>report</strong>ing directly to the CEO; and<br />
reviewing and making<br />
recommendations to the Board on:<br />
the criteria for the evaluation of the<br />
performance of the CEO;<br />
the remuneration of the CEO;<br />
incentives payable to the CEO and<br />
senior executives; and<br />
the <strong>annual</strong> Remuneration Report.<br />
The Chairman, the CEO and the head of<br />
the Human Resources department attend<br />
Human Resources & Compensation<br />
Committee meetings by invitation.<br />
3.5 Sustainability Committee<br />
The role of the Sustainability Committee<br />
is to assist the Board to meet its oversight<br />
responsibilities in relation to the company’s<br />
sustainability policies and practices.<br />
Key activities undertaken by the<br />
Sustainability Committee during the year<br />
included:<br />
review of <strong>Woodside</strong>’s commitment<br />
to Indigenous communities and the<br />
<strong>Woodside</strong> Reconciliation Action Plan;<br />
review of the themes for <strong>Woodside</strong>’s<br />
community investment;<br />
review of the Group’s environmental,<br />
health, safety and technical integrity<br />
performance and incidents; and<br />
approval of the Sustainable<br />
Development Report.<br />
The Chairman, the CEO, General Counsel,<br />
the head of the Sustainability department<br />
and the head of the Health and Safety<br />
department attend Sustainability<br />
Committee meetings by invitation.<br />
4 Shareholders<br />
4.1 Shareholder Communication<br />
ASXCGC Recommendations 6.1, 6.2<br />
Directors recognise that shareholders, as<br />
the ultimate owners of the company, are<br />
entitled to receive timely and relevant high<br />
quality information about their investment.<br />
Similarly, prospective new investors are<br />
entitled to be able to make informed<br />
investment decisions when considering<br />
the purchase of shares.<br />
<strong>Woodside</strong>’s Continuous Disclosure<br />
and Market Communications Policy<br />
encourages effective communication with<br />
its shareholders by requiring:<br />
the disclosure of full and timely<br />
information about <strong>Woodside</strong>’s activities<br />
in accordance with the disclosure<br />
requirements contained in the ASX<br />
Listing Rules and the Corporations Act;<br />
all information released to the market<br />
to be placed on <strong>Woodside</strong>’s website<br />
promptly following release;<br />
the company’s market announcements<br />
to be maintained on <strong>Woodside</strong>’s<br />
website for at least three years; and<br />
that all disclosures, including notices<br />
of meetings and other shareholder<br />
communications, are drafted clearly<br />
and concisely.<br />
Briefings on the financial results, and<br />
other significant briefings with major<br />
institutional investors and analysts, are<br />
webcast live and made available on<br />
<strong>Woodside</strong>’s website. Presentation material<br />
from significant briefings or management<br />
speeches is also posted to the website.<br />
Table 1 - Directors in office, committee membership and directors’ attendance at meetings during 2009.<br />
Director Board Audit & Risk<br />
Committee<br />
Human Resources<br />
& Compensation<br />
Committee<br />
Sustainability<br />
Committee<br />
Nominations<br />
Committee<br />
(1) (2) Held Attended Held Attended Held Attended Held Attended Held Attended<br />
Executive director<br />
DR Voelte (CEO)<br />
Non-executive directors<br />
6 6 6 6 6 6 4 4 2 2<br />
MA Chaney 6 6 6 6 6 6 4 4 2 2<br />
MA Cilento 6 6 6 3 (3) 6 6 4 4 2 2<br />
E Fraunschiel 6 6 6 6 4 4 2 2<br />
A Jamieson 6 6 4 4 2 2<br />
PJMH Jungels 6 6 6 6 6 6 2 2<br />
DI McEvoy 6 6 6 6 4 4 2 2<br />
D Megat 6 6 6 6 4 4 2 2<br />
I Robertson 6 6 6 6 2 2<br />
Legend: Notes:<br />
Chairman<br />
Member<br />
(1) ‘Held’ indicates the number of meetings held during the period of each director’s tenure.<br />
(2) ‘Attended’ indicates the number of meetings attended by the director.<br />
(3) Ms Cilento attended three Audit & Risk Committee meetings by invitation.<br />
Governance<br />
39
40<br />
The company produces a short form<br />
<strong>annual</strong> and half year shareholder review.<br />
These reviews and the Annual Report<br />
are available on the company’s website<br />
or shareholders can elect to receive hard<br />
copies. Shareholders can elect to receive<br />
email notification when these <strong>report</strong>s are<br />
posted to the website.<br />
Any person wishing to receive email alerts<br />
of significant market announcements can<br />
subscribe through <strong>Woodside</strong>’s website.<br />
The company recognises the importance<br />
of shareholder participation in general<br />
meetings and supports and encourages<br />
that participation. The company introduced<br />
direct voting at its 2009 AGM allowing<br />
shareholders unable to attend the AGM<br />
to vote directly on resolutions without<br />
having to appoint someone else as a proxy.<br />
Shareholders are also able register their<br />
voting instructions electronically.<br />
The company’s AGM is webcast live and<br />
is archived for viewing on <strong>Woodside</strong>’s<br />
website. The company also makes<br />
available podcasts of the AGM. Copies of<br />
the addresses by the Chairman and CEO<br />
are disclosed to the market and posted to<br />
the company’s website.<br />
The company’s external auditor attends the<br />
company’s AGM to answer shareholder<br />
questions about the conduct of the audit,<br />
the preparation and content of the audit<br />
<strong>report</strong>, the accounting policies adopted<br />
by the company and the independence of<br />
the auditor in relation to the conduct of the<br />
audit.<br />
A copy of the Continuous Disclosure and<br />
Market Communications Policy is available<br />
in the corporate governance section of<br />
<strong>Woodside</strong>’s website.<br />
4.2 Continuous Disclosure and<br />
Market Communications<br />
ASXCGC Recommendations 5.1, 5.2<br />
<strong>Woodside</strong> is committed to ensuring that<br />
shareholders and the market are provided<br />
with full and timely information and that<br />
all stakeholders have equal opportunities<br />
to receive externally available information<br />
issued by <strong>Woodside</strong>.<br />
A Disclosure Committee manages<br />
compliance with market disclosure<br />
obligations and is responsible for<br />
implementing <strong>report</strong>ing processes and<br />
controls and setting guidelines for the<br />
release of information.<br />
<strong>Woodside</strong>’s Continuous Disclosure and<br />
Market Communications Policy, referred to<br />
in section 4.1, and associated guidelines<br />
reinforce <strong>Woodside</strong>’s commitment<br />
to continuous disclosure and outline<br />
management’s accountabilities and the<br />
processes to be followed for ensuring<br />
compliance. The policy also describes<br />
<strong>Woodside</strong>’s guiding principles for market<br />
communications.<br />
A copy of the Continuous Disclosure and<br />
Market Communications Policy is available<br />
in the corporate governance section of<br />
<strong>Woodside</strong>’s website.<br />
5 Promoting Responsible<br />
and Ethical Behaviour<br />
5.1 Code of Conduct and<br />
Whistleblower Policy<br />
ASXCGC Recommendations 3.1, 3.3<br />
<strong>Woodside</strong> has a Code of Conduct which<br />
outlines <strong>Woodside</strong>’s commitment to<br />
appropriate and ethical corporate practices.<br />
The Code of Conduct describes<br />
<strong>Woodside</strong>’s mission, vision and values<br />
together with the business principles<br />
approved by the Board. It sets out the<br />
principles, practices and standards<br />
of personal and corporate behaviour<br />
<strong>Woodside</strong> expects from people working<br />
for or with <strong>Woodside</strong> to adopt in their daily<br />
business activities. The Code of Conduct<br />
covers matters such as compliance with<br />
laws and regulations, responsibilities to<br />
shareholders and the community, sound<br />
employment practices, confidentiality,<br />
privacy, conflicts of interest, giving and<br />
accepting business courtesies and the<br />
protection and proper use of <strong>Woodside</strong>’s<br />
assets.<br />
All directors, officers and employees<br />
are required to comply with the Code of<br />
Conduct. Senior managers are expected<br />
to ensure that employees, contractors,<br />
consultants, agents and partners under<br />
their supervision are aware of the<br />
company’s expectations as set out in the<br />
Code of Conduct. Employees are required<br />
to complete online Code of Conduct<br />
training upon appointment and thereafter<br />
<strong>annual</strong>ly.<br />
The Code of Conduct is available in<br />
the corporate governance section of<br />
<strong>Woodside</strong>’s website.<br />
<strong>Woodside</strong> also has a Whistleblower<br />
Policy which documents <strong>Woodside</strong>’s<br />
commitment to maintaining an<br />
open working environment in which<br />
employees and contractors are able to<br />
<strong>report</strong> instances of unethical, unlawful<br />
or undesirable conduct without fear of<br />
intimidation or reprisal.<br />
The purpose of the Whistleblower Policy<br />
is to:<br />
help detect and address unacceptable<br />
conduct;<br />
help provide employees and<br />
contractors with a supportive working<br />
environment in which they feel able to<br />
raise issues of legitimate concern to<br />
them and to <strong>Woodside</strong>;<br />
provide an external helpline which can<br />
be used for <strong>report</strong>ing unacceptable<br />
conduct; and<br />
help protect people who <strong>report</strong><br />
unacceptable conduct in good faith.<br />
A summary of the Whistleblower Policy<br />
is available in the corporate governance<br />
section of <strong>Woodside</strong>’s website.<br />
5.2 Securities Ownership and<br />
Dealing<br />
ASXCGC Recommendations 3.2, 3.3, 8.3<br />
<strong>Woodside</strong>’s Securities Dealing Policy<br />
applies to all directors, employees,<br />
contractors, consultants and advisers. This<br />
policy provides a brief summary of the<br />
law on insider trading and other relevant<br />
laws, sets out the restrictions on dealing<br />
in securities by people who work for, or<br />
are associated with, <strong>Woodside</strong> and is<br />
intended to assist in maintaining market<br />
confidence in the integrity of dealings in<br />
the company’s securities.<br />
The policy prohibits directors and<br />
employees from dealing in the company’s<br />
securities when they are in possession<br />
of price sensitive information that is not<br />
generally available to the market.<br />
Directors are also required to seek the<br />
approval of the Chairman (or in the case<br />
of the Chairman, the CEO) before dealing<br />
in the company’s securities or entering<br />
into any financial arrangement by which<br />
<strong>Woodside</strong> securities are used as collateral.<br />
Restricted employees are required to<br />
notify their manager and the General<br />
Counsel before dealing in the company’s<br />
securities. In addition, executives <strong>report</strong>ing<br />
directly to the CEO, and the Company<br />
Secretaries, have notification requirements<br />
in respect of entering into any financial<br />
arrangement by which <strong>Woodside</strong> securities<br />
are used as collateral.<br />
Non-executive directors are encouraged<br />
to have a minimum holding of shares<br />
in <strong>Woodside</strong> equivalent in value to one<br />
year of the base fees for non-executive<br />
directors and which should be acquired<br />
within four years of appointment or<br />
significant remuneration change. This<br />
requirement does not apply to non-<br />
<strong>Woodside</strong> Petroleum Ltd | Annual Report 2009
executive directors that do not receive<br />
their directors’ fees directly.<br />
Under the terms of the non-executive<br />
directors share plan, non-executive<br />
directors (other than directors who are<br />
both nominated and employed by Shell)<br />
may elect to sacrifice a percentage of their<br />
remuneration to be applied to the purchase<br />
of shares in <strong>Woodside</strong>. These shares are<br />
acquired on market at market value. The<br />
purchases are made at predetermined<br />
intervals, but only after a determination has<br />
been made that the directors are not in<br />
possession of price-sensitive information<br />
that has not been released to the market.<br />
Participation in the plan is voluntary.<br />
Participants ceased contributing to the<br />
plan from April 2009, due to changes in tax<br />
legislation.<br />
Any dealing in <strong>Woodside</strong> securities by<br />
directors is notified to the ASX within five<br />
business days of the dealing.<br />
It is a condition of the Securities Dealing<br />
Policy that directors, and executives<br />
participating in an equity based incentive<br />
plan, are prohibited from entering into any<br />
transaction which would have the effect<br />
of hedging or otherwise transferring to<br />
any person the risk of any fluctuation in<br />
the value of any unvested entitlement<br />
in <strong>Woodside</strong> securities. This prohibition<br />
is also contained in the terms of the<br />
Executive Incentive Plan.<br />
A copy of the Securities Dealing Policy<br />
is available in the corporate governance<br />
section of <strong>Woodside</strong>’s website.<br />
5.3 Political Donations<br />
The Board’s policy is not to donate funds<br />
to any political party, politician or candidate<br />
for public office in any country. However,<br />
in certain circumstances <strong>Woodside</strong><br />
representatives may attend a party-political<br />
function which charges an attendance<br />
fee. Attendance at these functions must<br />
be approved by the relevant business unit<br />
manager and a register of attendances<br />
and the cost of attending each function is<br />
maintained by <strong>Woodside</strong> at a corporate<br />
level.<br />
6 Risk Management and<br />
Internal Control<br />
6.1 Approach to Risk Management<br />
and Internal Control<br />
ASXCGC Recommendations 7.1, 7.4<br />
The Board recognises that risk<br />
management and internal compliance and<br />
control are key elements of good corporate<br />
governance.<br />
<strong>Woodside</strong>’s Risk Management Policy<br />
describes the manner in which <strong>Woodside</strong>:<br />
identifies, assesses, monitors and<br />
manages risk;<br />
identifies material changes to the<br />
company’s risk profile; and<br />
designs, implements and monitors<br />
the effectiveness of the internal<br />
compliance and control system.<br />
A copy of the Risk Management Policy<br />
is available in the corporate governance<br />
section of <strong>Woodside</strong>’s website.<br />
<strong>Woodside</strong> considers that effective<br />
risk management is about achieving a<br />
balanced approach to risk and reward. Risk<br />
management enables the company to<br />
capitalise on potential opportunities while<br />
mitigating potential adverse effects. Both<br />
mitigation and optimisation strategies<br />
are considered equally important in risk<br />
management.<br />
The <strong>Woodside</strong> Group operates a<br />
standardised enterprise-wide risk<br />
management process that provides an<br />
over-arching and consistent framework for<br />
the identification, assessment, monitoring<br />
and management of material business<br />
risks. In 2009 the company reviewed<br />
its approach to risk management and<br />
formed the Enterprise Risk function,<br />
separate to Internal Audit. A review of<br />
the risk management process ensured<br />
it was aligned with the Australian/New<br />
Zealand Standard for risk management<br />
(AS/NZS 4360 Risk Management) and the<br />
International Standard for risk management<br />
(ISO 31000 Risk Management). Risks are<br />
identified, assessed and ranked using a<br />
common methodology. Where a risk is<br />
assessed as material it is <strong>report</strong>ed to and<br />
reviewed by senior executives.<br />
6.2 Risk Management Roles and<br />
Responsibilities<br />
ASXCGC Recommendations 7.2, 7.4<br />
The Board is responsible for reviewing and<br />
approving <strong>Woodside</strong>’s risk management<br />
strategy, policy and key risk parameters,<br />
including determining the Group’s appetite<br />
for country risk and major investment<br />
decisions.<br />
The Board is also responsible for satisfying<br />
itself that management has developed<br />
and implemented a sound system of risk<br />
management and internal control. The<br />
Board has delegated oversight of the Risk<br />
Management Policy, including review of<br />
the effectiveness of <strong>Woodside</strong>’s internal<br />
control system and risk management<br />
process, to the Audit & Risk Committee.<br />
Management is responsible for designing,<br />
implementing, reviewing and providing<br />
assurance as to the effectiveness of<br />
the Policy. This responsibility includes<br />
developing business risk identification,<br />
implementing appropriate risk treatment<br />
strategies and controls, monitoring<br />
effectiveness of controls and <strong>report</strong>ing<br />
on risk management capability and<br />
performance. Within each major business<br />
and functional area there is a designated<br />
risk and assurance person, with specific<br />
responsibilities designed to guide<br />
compliance and <strong>report</strong>ing.<br />
Every organisational unit has a risk<br />
management section within its <strong>annual</strong><br />
business plan, and these plans are<br />
discussed at regular performance reviews.<br />
In addition each business unit <strong>report</strong>s<br />
<strong>annual</strong>ly to the Board on its business plan,<br />
risk profile and management of risk.<br />
The Enterprise Risk function is responsible<br />
for the risk management process, risk<br />
management capability and providing<br />
<strong>report</strong>s to the Audit & Risk Committee on<br />
the corporate risk profile and the Group’s<br />
risk management performance.<br />
In 2009, both the Audit & Risk Committee<br />
and the Board reviewed the overall risk<br />
profile for the Group and received <strong>report</strong>s<br />
from management on the effectiveness of<br />
the Group’s management of its material<br />
business risks. The <strong>report</strong>ed risk categories<br />
included:<br />
financial and commercial;<br />
operational;<br />
health and safety;<br />
environmental;<br />
reputational;<br />
legal and compliance; and<br />
social and cultural risks.<br />
Internal Audit is responsible for providing<br />
an independent appraisal of the adequacy<br />
and effectiveness of the Group’s risk<br />
management and internal control system.<br />
6.3 Internal Audit<br />
Internal Audit is independent of both<br />
business management and of the<br />
activities it reviews. Internal Audit provides<br />
assurance that the design and operation of<br />
the Group’s risk management and internal<br />
control system is effective. A risk-based<br />
audit approach is used to ensure that<br />
the higher risk activities in each business<br />
unit are targeted by the audit program.<br />
All audits are conducted in a manner<br />
that conforms to international auditing<br />
Governance<br />
41
42<br />
standards. Internal Audit has all necessary<br />
access to management and information.<br />
It is staffed by a combination of Chartered<br />
Accountants and engineers.<br />
The Audit & Risk Committee oversees<br />
and monitors Internal Audit’s activities.<br />
It approves the <strong>annual</strong> audit program<br />
and receives <strong>report</strong>s from Internal<br />
Audit concerning the effectiveness of<br />
internal control and risk management.<br />
The Audit & Risk Committee approves<br />
the appointment of the head of Internal<br />
Audit. The head of Internal Audit is<br />
jointly accountable to the Audit & Risk<br />
Committee and the General Counsel.<br />
The Committee members have access<br />
to Internal Audit without the presence<br />
of other management. Internal Audit has<br />
unfettered access to the Audit & Risk<br />
Committee and its chairman.<br />
Internal Audit and external audit are<br />
separate and independent of each other.<br />
6.4 CEO and CFO Assurance<br />
ASXCGC Recommendations 7.3, 7.4<br />
The Board receives regular <strong>report</strong>s on the<br />
Group’s financial and operational results.<br />
Before the adoption by the Board of<br />
the 2009 half-year and full-year financial<br />
statements, the Board received written<br />
declarations from the CEO and CFO that<br />
the financial records of the company have<br />
been properly maintained in accordance<br />
with section 286 of the Corporations Act<br />
and the company’s financial statements<br />
and notes comply with accounting<br />
standards and give a true and fair view of<br />
the consolidated entity’s financial position<br />
and performance for the financial period.<br />
The CEO and CFO have also stated in<br />
writing to the Board that the statement<br />
relating to the integrity of <strong>Woodside</strong>’s<br />
financial statements is founded on a sound<br />
system of risk management and internal<br />
control and that the system is operating<br />
effectively in all material respects in<br />
relation to financial <strong>report</strong>ing risks.<br />
In addition all executives and key<br />
finance managers complete and sign a<br />
questionnaire from the directors on a<br />
half-yearly basis. The questions relate to<br />
the financial position of the company,<br />
disclosure, the application of company<br />
policies and procedures (including the Risk<br />
Management Policy), compliance with<br />
external obligations and other governance<br />
matters. This process assists the CEO<br />
and CFO in making the declarations to the<br />
Board referred to above.<br />
7 External Auditor<br />
Relationship<br />
ASXCGC Recommendation 4.4<br />
In accordance with <strong>Woodside</strong>’s<br />
External Auditor Policy, the Audit & Risk<br />
Committee oversees detailed External<br />
Auditor Guidelines covering the terms<br />
of engagement of <strong>Woodside</strong>’s external<br />
auditor. The guidelines include provisions<br />
directed to maintaining the independence<br />
of the external auditor and in assessing<br />
whether the provision of any non-audit<br />
services by the external auditor that<br />
may be proposed is appropriate. Such<br />
provisions are referenced to the Code<br />
of Ethics published by the International<br />
Federation of Accountants (IFAC).<br />
The External Auditor Guidelines contain a<br />
set of controls which address threats to<br />
the independence of the external auditor<br />
including, in particular, any threat which<br />
may arise by reason of self-interest, selfreview,<br />
advocacy, familiarity or intimidation.<br />
The External Auditor Guidelines classify a<br />
range of non-audit services which could<br />
potentially be provided by the external<br />
auditor as:<br />
acceptable within limits;<br />
requiring the approval of the CFO;<br />
requiring the approval of the Audit &<br />
Risk Committee; or<br />
not acceptable.<br />
The services considered not acceptable for<br />
provision by the external auditor include:<br />
internal audit;<br />
acquisition accounting due diligence<br />
where the external auditor is also the<br />
auditor of the other party;<br />
transactional support for acquisitions<br />
or divestments where the external<br />
auditor is also the auditor of the other<br />
party;<br />
book-keeping and financial <strong>report</strong>ing<br />
activities to the extent such activities<br />
require decision-making ability and/or<br />
posting entries to the ledger;<br />
the design, implementation, operation<br />
or supervision of information systems<br />
and provision of systems integration<br />
services;<br />
independent expert <strong>report</strong>s;<br />
financial risk management; and<br />
taxation planning and taxation<br />
transaction advice.<br />
The External Auditor Guidelines require<br />
rotation of the audit partner and audit<br />
review partner at least every five years and<br />
prohibit the reinvolvement of a previous<br />
audit partner in the audit service for<br />
two years following rotation. In addition<br />
to incorporating safeguards to ensure<br />
compliance with sections 324CI and<br />
324CK of the Corporations Act in respect<br />
of employment of a former partner of the<br />
audit firm or member of the audit team as<br />
a director or senior employee of <strong>Woodside</strong>,<br />
the Guidelines also require assessment<br />
of the significance of a potential threat to<br />
the external auditor’s independence before<br />
any employment of a former partner or<br />
audit team member. Any employment of a<br />
member of the audit team or a partner of<br />
the audit firm also requires the approval of<br />
the Audit & Risk Committee.<br />
Information on the procedures for the<br />
selection and appointment of the external<br />
auditor and for the rotation of external<br />
audit engagement partners is available<br />
in the corporate governance section of<br />
<strong>Woodside</strong>’s website.<br />
<strong>Woodside</strong> Petroleum Ltd | Annual Report 2009
8 ASX Corporate Governance Council Recommendations Checklist<br />
This table cross-references the ASXCGC Recommendations to the relevant sections of the Corporate Governance Statement and the Remuneration Report.<br />
ASX Corporate Governance Council Recommendations Reference Comply<br />
Principle 1: Lay solid foundations for management and oversight<br />
1.1 Companies should establish the functions reserved to the board and those delegated to senior<br />
executives and disclose those functions.<br />
2.1 �<br />
1.2 Companies should disclose the process for evaluating the performance of senior executives. Remuneration Report �<br />
1.3 Companies should provide the information indicated in Guide to Reporting on Principle 1. 2.1, 2.9, Remuneration<br />
Report<br />
�<br />
Principle 2: Structure the board to add value<br />
2.1 A majority of the board should be independent directors. 2.2, 2.4 �<br />
2.2 The chair should be an independent director. 2.2, 2.3 �<br />
2.3 The roles of chair and chief executive officer should not be exercised by the same individual. 2.2, 2.3 �<br />
2.4 The board should establish a nomination committee. 3.1, 3.3 �<br />
2.5 Companies should disclose the process for evaluating the performance of the board, its<br />
committees and individual directors.<br />
2.9 �<br />
2.6 Companies should provide the information indicated in Guide to Reporting on Principle 2. 2.2, 2.4, 2.6, 2.7, 2.9, 2.10,<br />
3.1, 3.3<br />
�<br />
Principle 3: Promote ethical and responsible decision-making<br />
3.1 Companies should establish a code of conduct and disclose the code or summary of the code<br />
as to:<br />
• the practices necessary to maintain confidence in the company’s integrity<br />
• the practices necessary to take into account their legal obligations and the reasonable<br />
expectations of their stakeholders<br />
• the responsibility and accountability of individuals for <strong>report</strong>ing and investigating <strong>report</strong>s of<br />
unethical practices.<br />
5.1 �<br />
3.2 Companies should establish a policy concerning trading in company securities by directors,<br />
senior executives and employees, and disclose the policy or a summary of that policy.<br />
5.2 �<br />
3.3 Companies should provide the information indicated in Guide to Reporting on Principle 3. 5.1,5.2 �<br />
Principle 4: Safeguard integrity in financial <strong>report</strong>ing<br />
4.1 The board should establish an audit committee. 3.1, 3.2 �<br />
4.2 The audit committee should be structured so that it:<br />
• consists only of non-executive directors<br />
• consists of a majority of independent directors<br />
• is chaired by an independent chair, who is not chair of the board<br />
• has at least three members.<br />
3.1, 3.2 �<br />
4.3 The audit committee should have a formal charter. 3.1, 3.2 �<br />
4.4 Companies should provide the information indicated in Guide to Reporting on Principle 4. 3.1, 3.2, 7 �<br />
Principle 5: Make timely and balanced disclosure<br />
5.1 Companies should establish written policies designed to ensure compliance with ASX Listing<br />
Rule disclosure requirements and to ensure accountability at a senior executive level for that<br />
compliance and disclose those policies or a summary of those policies.<br />
4.2 �<br />
5.2 Companies should provide the information indicated in Guide to Reporting on Principle 5. 4.2 �<br />
Principle 6: Respect the rights of shareholders<br />
6.1 Companies should design a communications policy for promoting effective communication with<br />
shareholders and encouraging their participation at general meetings and disclose their policy or<br />
a summary of that policy.<br />
4.1 �<br />
6.2 Companies should provide the information indicated in Guide to Reporting on Principle 6. 4.1 �<br />
Principle 7: Recognise and manage risk<br />
7.1 Companies should establish policies for the oversight and management of material business<br />
risks and disclose a summary of those policies.<br />
6.1 �<br />
7.2 The board should require management to design and implement the risk management<br />
and internal control system to manage the company’s material business risks and <strong>report</strong><br />
to it on whether those risks are being managed effectively. The board should disclose that<br />
management has <strong>report</strong>ed to it as to the effectiveness of the company’s management of its<br />
material business risks.<br />
6.2 �<br />
7.3 The board should disclose whether it has received assurance from the chief executive officer<br />
(or equivalent) and the chief financial officer (or equivalent) that the declaration provided in<br />
accordance with section 295A of the Corporations Act is founded on a sound system of risk<br />
management and internal control and that the system is operating effectively in all material<br />
respects in relation to financial <strong>report</strong>ing risks.<br />
6.4 �<br />
7.4 Companies should provide the information indicated in Guide to Reporting on Principle 7. 6.1, 6.2, 6.4 �<br />
Principle 8: Remunerate fairly and responsibly<br />
8.1 The board should establish a remuneration committee. 3.1, 3.4 �<br />
8.2 Companies should clearly distinguish the structure of non-executive directors’ remuneration<br />
from that of executive directors and senior executives.<br />
Remuneration Report �<br />
8.3 Companies should provide the information indicated in Guide to Reporting on Principle 8. 3.1, 3.4, 5.2 �<br />
Governance<br />
43
44<br />
Directors' <strong>report</strong><br />
The directors of <strong>Woodside</strong> Petroleum<br />
Ltd present their <strong>report</strong> (including the<br />
Remuneration Report) together with the<br />
Financial Report of the consolidated entity,<br />
being <strong>Woodside</strong> Petroleum Ltd and its<br />
controlled entities, for the year ended 31<br />
December 2009.<br />
Directors<br />
The directors of <strong>Woodside</strong> Petroleum Ltd<br />
in office at any time during or since the end<br />
of the 2009 financial year are set out in<br />
Table 1 on page 39. Additional information<br />
(including qualifications and experience) on<br />
the directors is set out on pages 31 to 32.<br />
The number of directors’ meetings held<br />
(including meetings of committees of<br />
the Board) and the number of meetings<br />
attended by each of the directors of<br />
<strong>Woodside</strong> Petroleum Ltd during the<br />
financial year are shown in Table 1 on page<br />
39.<br />
Details of director and senior executive<br />
remuneration is set out in the<br />
Remuneration Report on pages 45 to 59.<br />
The particulars of directors’ interests in<br />
shares of the company as at the date of<br />
this <strong>report</strong> are set out in Table 14 on<br />
page 60.<br />
Principal activities<br />
The principal activities and operations of<br />
the Group during the financial year were<br />
hydrocarbon exploration, evaluation,<br />
development, production and marketing.<br />
Other than as previously referred to in<br />
the Annual Report, there were no other<br />
significant changes in the nature of the<br />
activities of the consolidated entity during<br />
the year.<br />
Consolidated results<br />
The consolidated operating profit<br />
attributable to the company’s shareholders<br />
after provision for income tax and<br />
individually significant items was<br />
$1,824 million ($1,786 million in 2008).<br />
Review of operations<br />
A review of the operations of the<br />
<strong>Woodside</strong> Group during the financial year<br />
and the results of those operations are set<br />
out on pages 1 to 30.<br />
Significant changes in state of affairs<br />
The review of operations (pages 1 to<br />
30) sets out a number of matters which<br />
have had a significant effect on the state<br />
of affairs of the consolidated entity.<br />
Other than those matters, there were no<br />
significant changes in the state of affairs of<br />
the consolidated entity during the financial<br />
year.<br />
Events subsequent to end of<br />
financial year<br />
(a) Dividends<br />
Since the <strong>report</strong>ing date, the directors have<br />
declared a fully franked dividend of<br />
55 cents (2008: 55 cents), payable on<br />
31 March 2010. The amount of this<br />
dividend will be $427 million (2008:<br />
$384 million). No provision has been<br />
made for this dividend in the financial<br />
<strong>report</strong> as the dividend was not declared or<br />
determined by the directors on or before<br />
the end of the financial year.<br />
(b) Issue of shares<br />
On 11 February 2010, <strong>Woodside</strong> issued<br />
28,646,808 ordinary shares pursuant to<br />
the retail component of the renounceable<br />
rights issue announced in December 2009.<br />
Likely developments and expected<br />
results<br />
In general terms, the review of operations<br />
of the Group gives an indication of likely<br />
developments and the expected results of<br />
the operations.<br />
Environmental compliance<br />
<strong>Woodside</strong> is subject to a range of<br />
environmental legislation in Australia<br />
and other countries in which it operates.<br />
Details of <strong>Woodside</strong>’s environmental<br />
performance is provided on page 29 of this<br />
Annual Report.<br />
Through its Environment Policy, <strong>Woodside</strong><br />
plans and performs activities so that<br />
adverse effects on the environment are<br />
avoided or kept as low as reasonably<br />
practicable.<br />
<strong>Woodside</strong> did not incur any environmental<br />
fines or penalties during 2009.<br />
Dividends<br />
The directors have declared a final dividend<br />
out of profits of the company in respect<br />
of the year ended 31 December 2009 of<br />
55 cents per ordinary share (fully franked)<br />
payable on 31 March 2010.<br />
A fully franked final dividend of 55 cents<br />
per ordinary share was paid to<br />
shareholders on 6 April 2009 in respect<br />
of the year ended 31 December 2008.<br />
Together with the fully franked interim<br />
dividend of 55 cents per share paid to<br />
shareholders on 5 October 2009, the total<br />
dividend paid during the 2009 year was<br />
$1.10 per share fully franked.<br />
<strong>Woodside</strong>’s dividend reinvestment plan<br />
operated during the year.<br />
Company secretaries<br />
The following individuals have acted as<br />
company secretary during 2009:<br />
Robert J Cole<br />
BSc, LLB (Hons) (ANU)<br />
Executive Vice President Corporate Centre,<br />
General Counsel and Company Secretary<br />
Mr Cole joined <strong>Woodside</strong> in 2006 after<br />
14 years as a partner of international law<br />
firm, Mallesons Stephen Jaques, the last<br />
three years as partner in charge of the<br />
Perth office. Mr Cole holds Bachelor of<br />
Science and Bachelor of Laws degrees.<br />
Frances M Kernot<br />
BCom (Hons) (UWA), Grad. Dip. CSP, CA, ACIS<br />
Company Secretary<br />
Ms Kernot joined <strong>Woodside</strong> in 2003.<br />
She has more than 15 years experience<br />
in company secretarial, compliance and<br />
financial accounting roles. Ms Kernot holds<br />
a Bachelor of Commerce degree and is<br />
a Chartered Accountant and Chartered<br />
Secretary. She is a member of the<br />
Chartered Secretaries' Legislation Review<br />
Committee.<br />
<strong>Woodside</strong> Petroleum Ltd | Annual Report 2009
Overview<br />
This Remuneration Report forms part of<br />
the Directors’ Report for 2009 and outlines<br />
the remuneration arrangements for<br />
<strong>Woodside</strong>’s directors and senior executives<br />
who have the authority and responsibility<br />
for planning, directing and controlling the<br />
activities of the <strong>Woodside</strong> Group (Key<br />
Management Personnel). This <strong>report</strong> has<br />
been audited by Ernst & Young.<br />
<strong>Woodside</strong>'s Key Management Personnel<br />
comprise of the following individuals:<br />
Non-executive directors<br />
M Chaney (Chairman)<br />
M Cilento<br />
E Fraunschiel<br />
A Jamieson<br />
P Jungels<br />
D McEvoy<br />
D Megat<br />
I Robertson<br />
Executives<br />
Managing Director and Chief Executive<br />
Officer<br />
D Voelte<br />
Senior Managers<br />
F Ahmed (Executive Vice President<br />
Project Development)<br />
M Chatterji (Executive Vice President<br />
and Chief Financial Officer)<br />
R Cole (Executive Vice President<br />
Corporate Centre, General Counsel<br />
and Joint Company Secretary)<br />
L Della Martina (Executive Vice<br />
President Pluto)<br />
B Donaghey (Executive Vice President<br />
Browse) (1)<br />
E Howell (Executive Vice President<br />
North West Shelf)<br />
A Kantsler (Executive Vice President<br />
Health, Safety and Security) (2)<br />
V Santostefano (Executive Vice<br />
President Production)<br />
Summary of the remuneration structure for the Key Management Personnel<br />
Non-executive<br />
Element of Remuneration<br />
directors<br />
Fixed Annual Remuneration (FAR)<br />
(including superannuation)<br />
Salary<br />
Fees<br />
Variable Annual Reward (VAR)<br />
Directors fees,<br />
superannuation and<br />
other allowances<br />
(SEE PAGE 51)<br />
Category of Key Management Personnel<br />
CEO Senior Managers<br />
Salary, superannuation and other<br />
allowances (SEE PAGE 59)<br />
Short term incentive (STI)<br />
Variable Pay Rights Variable pay rights awarded each year<br />
based on individual performance against<br />
key performance indicators and the<br />
company’s scorecard performance which<br />
vest in either cash or shares at the<br />
Board’s discretion after a 3 year service<br />
period from allocation date (SEE PAGE 50)<br />
Cash<br />
Long term incentive (LTI)<br />
Cash award each year based on individual<br />
performance against key performance<br />
indicators and the company’s scorecard<br />
performance (SEE PAGE 50)<br />
Variable Pay Rights<br />
Variable pay rights (including accelerated<br />
variable pay rights) awarded which vest<br />
in cash or shares based on shareholder<br />
return on <strong>Woodside</strong> shares (SEE PAGE 50)<br />
Retention Plans<br />
Equity Based Pay Rights<br />
<strong>Woodside</strong> Employee<br />
Equity Plan<br />
General Employee Share Plans<br />
<strong>Woodside</strong> Share<br />
Purchase Plan<br />
Salary sacrifice to purchase <strong>Woodside</strong><br />
shares with a company matching<br />
component. Plan suspended in April 2009<br />
Directors' <strong>report</strong> :<br />
Remuneration <strong>report</strong><br />
(1) On 18 May 2009 Ms Donaghey became Key<br />
Management Personnel, and effective 31 October 2009<br />
Ms Donaghey departed from <strong>Woodside</strong>.<br />
(2) On 12 February 2009 Dr Kantsler was appointed as<br />
Executive Vice President, Health and Safety. On<br />
1 February 2010, Dr Kantsler’s title was changed to<br />
Executive Vice President, Health, Safety and Security.<br />
The five most highly remunerated<br />
executives in the <strong>Woodside</strong> Group in 2009<br />
are included in the above.<br />
The Human Resources & Compensation<br />
Committee (Committee) assists the Board<br />
to determine appropriate remuneration<br />
policies and structures for non-executive<br />
directors and executives. The role of the<br />
Committee is described in the Corporate<br />
Governance Statement set out in this<br />
Annual Report. The following table contains<br />
a broad summary of the remuneration<br />
structure for the Key Management<br />
Personnel. This structure and its elements<br />
are described in more detail in the<br />
Remuneration Report.<br />
Salary, superannuation and other allowances<br />
(SEE PAGE 59)<br />
Variable pay rights awarded each year under<br />
Executive Incentive Plan based on individual<br />
performance against key performance indicators<br />
and the company’s scorecard performance<br />
which vest in either cash or shares at the Board’s<br />
discretion after a 3 year service period from<br />
allocation date (SEE PAGE 47)<br />
Cash award each year under Executive Incentive<br />
Plan based on individual performance against<br />
key performance indicators and the company’s<br />
scorecard performance (SEE PAGE 47)<br />
Variable pay rights awarded each year under<br />
Executive Incentive Plan which vest in either<br />
shares or cash at the Board’s discretion based on<br />
shareholder return on <strong>Woodside</strong> shares after<br />
3 years (SEE PAGE 48)<br />
Grant of pay rights which vest in cash or shares<br />
at the Board’s discretion with vesting linked to<br />
company performance and/or retention (SEE PAGE 49)<br />
Grant of equity rights which vest in shares<br />
(subject to limited exceptions) with vesting linked<br />
to retention (SEE PAGE 49)<br />
Salary sacrifice to purchase <strong>Woodside</strong> shares<br />
with a company matching component. Plan<br />
suspended in April 2009<br />
Governance<br />
45
46<br />
Non-executive directors<br />
Remuneration Policy<br />
<strong>Woodside</strong>’s Remuneration Policy for nonexecutive<br />
directors aims to attract, retain<br />
and motivate talented and highly skilled<br />
non-executive directors and to remunerate<br />
fairly and responsibly having regard to:<br />
the level of fees paid to non-executive<br />
directors relative to other major<br />
Australian companies;<br />
the size and complexity of <strong>Woodside</strong>’s<br />
operations; and<br />
the responsibilities and work<br />
requirements of Board members.<br />
Fees paid to non-executive directors are<br />
recommended by the Committee based<br />
on advice from external remuneration<br />
consultants and determined by the<br />
Board, subject to an aggregate limit of<br />
$3 million per financial year, approved by<br />
shareholders at the 2007 Annual General<br />
Meeting (AGM).<br />
The <strong>annual</strong> base Board and Committee<br />
fees have not been changed since 1 July<br />
2008.<br />
The Board approved the introduction of<br />
a minimum <strong>Woodside</strong> Petroleum Ltd<br />
shareholding guideline for non-executive<br />
directors in December 2008. The guideline<br />
encourages non-executive directors to<br />
have a minimum holding of <strong>Woodside</strong><br />
shares equivalent in value to one year of<br />
the non-executive director’s base Board<br />
fee, which should be acquired within<br />
four years of appointment or significant<br />
remuneration change. This requirement<br />
does not apply to non-executive directors<br />
that do not receive their Board fees<br />
directly.<br />
Remuneration structure<br />
Non-executive director remuneration<br />
consists of base fees, committee fees,<br />
other payments for additional services<br />
outside the scope of Board and committee<br />
duties, and statutory superannuation<br />
contributions or payments in lieu (currently<br />
9%). Non-executive directors do not<br />
earn retirement benefits other than<br />
superannuation and are not entitled to any<br />
form of performance-linked remuneration.<br />
Table 1 on page 50 shows the <strong>annual</strong><br />
base Board and committee fees for nonexecutive<br />
directors.<br />
In addition to these fees, non-executive<br />
directors are entitled to reimbursement<br />
of reasonable travel, accommodation<br />
and other expenses incurred attending<br />
meetings of the Board, committees<br />
or shareholders, or while engaged on<br />
<strong>Woodside</strong> business. Non-executive<br />
directors are not entitled to compensation<br />
on termination of their directorships.<br />
Under the terms of the non-executive<br />
directors share plan (NEDSP), nonexecutive<br />
directors (other than directors<br />
who are both nominated and employed<br />
by the Shell Group) may elect to sacrifice<br />
a percentage of their remuneration to<br />
be applied to the purchase of shares in<br />
<strong>Woodside</strong>. These shares are acquired on<br />
market at market value. Participation in<br />
the NEDSP is voluntary and therefore the<br />
shares are not subject to any performance<br />
conditions. Contributions to the plan<br />
were suspended from April 2009, due to<br />
changes in tax legislation.<br />
Board fees are not paid to the CEO, as<br />
the time spent on Board work and the<br />
responsibilities of Board membership<br />
are considered in determining the<br />
remuneration package provided as part of<br />
his normal employment conditions.<br />
The total remuneration paid to, or in<br />
respect of, each non-executive director in<br />
2009 is set out in Table 2 on page 51.<br />
Executives<br />
Remuneration Policy<br />
<strong>Woodside</strong>’s Remuneration Policy aims to<br />
reward executives fairly and responsibly<br />
in accordance with the Australian (and in<br />
some instances, international) market and<br />
ensure that <strong>Woodside</strong>:<br />
provides competitive rewards that<br />
attract, retain and motivate executives<br />
of the highest calibre;<br />
sets demanding levels of performance<br />
which are clearly linked to an<br />
executive’s remuneration;<br />
structures remuneration at a level that<br />
reflects the executive’s duties and<br />
accountabilities;<br />
benchmarks remuneration against<br />
appropriate comparator groups;<br />
aligns executive incentive rewards with<br />
the creation of value for shareholders;<br />
and<br />
complies with applicable legal<br />
requirements and appropriate<br />
standards of governance.<br />
Executive remuneration is reviewed<br />
<strong>annual</strong>ly having regard to individual and<br />
business performance, and relevant<br />
comparative information.<br />
Executive remuneration and company<br />
performance<br />
The Committee assists the Board to<br />
strengthen the link between executive<br />
remuneration and <strong>Woodside</strong>’s<br />
performance.<br />
There are a number of internal and<br />
external factors relevant to <strong>Woodside</strong>’s<br />
performance over the past five years. In<br />
addition, the Board believes <strong>Woodside</strong>’s<br />
performance is also attributable to the<br />
ability to motivate and retain its executives<br />
and the effectiveness of the remuneration<br />
policies in place over that time.<br />
Table 3 on page 51 shows the key financial<br />
measures of company performance over<br />
the past five years.<br />
Remuneration structure<br />
<strong>Woodside</strong>’s remuneration structure for<br />
executives has several components:<br />
Fixed Annual Reward - the ‘not at risk’<br />
component (unrelated to performance)<br />
which includes base salary,<br />
superannuation contribution and other<br />
allowances such as motor vehicle and<br />
health insurance. Fixed Annual Reward<br />
is determined on the basis of the<br />
scope of the executive’s role and the<br />
individual level of knowledge, skill and<br />
experience.<br />
Variable Annual Reward - the ‘at risk’<br />
component (related to performance)<br />
which is awarded under the Executive<br />
Incentive Plan and comprises:<br />
a short-term incentive; and<br />
a long-term incentive.<br />
Participation in Retention Plans - Equity<br />
Based Pay Rights and <strong>Woodside</strong><br />
Employee Equity Plan.<br />
Participation in General Employee<br />
Share Plans - <strong>Woodside</strong> Share<br />
Purchase Plan.<br />
Table 4 sets out the allocation of<br />
remuneration between Fixed Annual<br />
Reward and Variable Annual Reward<br />
for <strong>Woodside</strong>’s executives assuming<br />
achievement of target performance for<br />
the short term incentive and the <strong>annual</strong><br />
allocation value of long term incentive.<br />
Participation in retention plans and<br />
participation in general employee share<br />
plans is not taken into account for the<br />
calculation of the percentages shown in<br />
the table.<br />
Refer to Table 4 on page 51<br />
<strong>Woodside</strong> Petroleum Ltd | Annual Report 2009
Variable Annual Reward - Executive<br />
Incentive Plan<br />
The Variable Annual Reward (VAR)<br />
component of executive remuneration is<br />
based on a percentage of an executive’s<br />
Fixed Annual Reward (FAR). This<br />
percentage is determined by the Board<br />
at the start of the year with reference<br />
to market comparator groups and the<br />
scope of the executive’s role (Variable<br />
Pay Percentage). For executives other<br />
than the CEO, VAR is delivered through<br />
the Executive Incentive Plan (EIP) (refer<br />
below). The delivery of awards of VAR for<br />
the CEO are discussed separately below.<br />
The EIP aims to reward executives for<br />
meeting or exceeding their individual<br />
performance targets, while at the same<br />
time linking the reward to the creation<br />
of long term sustainable wealth for<br />
shareholders.<br />
VAR has two elements:<br />
1. the short term incentive (STI) award<br />
(which links remuneration to short<br />
term performance) which is paid two<br />
thirds in cash and one third in an award<br />
of variable pay rights, the vesting of<br />
which is dependent on continuing<br />
service (Time-tested VPRs); and<br />
2. the long term incentive (LTI) award<br />
(which links remuneration to long term<br />
performance) which is paid by a grant<br />
of variable pay rights, the vesting of<br />
which is dependent on service and<br />
total shareholder return on <strong>Woodside</strong><br />
shares relative to an identified peer<br />
group (RTSR-tested VPRs).<br />
A variable pay right represents a right,<br />
if all vesting conditions have been met,<br />
to receive either cash or shares with a<br />
value equivalent to the market value of a<br />
<strong>Woodside</strong> share at the time of vesting.<br />
The number of variable pay rights awarded<br />
under the EIP for the 2009 performance<br />
year is calculated by dividing the value<br />
of the award (which is determined after<br />
the completion of the performance year)<br />
by the volume weighted average price<br />
(VWAP) of <strong>Woodside</strong> shares for the month<br />
of December in 2009. (For performance<br />
years up to and including the 2007<br />
performance year, the number of variable<br />
pay rights awarded was determined by<br />
reference to the VWAP of <strong>Woodside</strong><br />
shares in the last five trading days of the<br />
performance year.)<br />
The Board determines whether variable<br />
pay rights are to be satisfied in cash or<br />
shares at the time of vesting. If satisfied<br />
in shares, the shares will be purchased on<br />
market. If satisfied in cash, the amount<br />
paid is based on the market value of a<br />
<strong>Woodside</strong> share at the vesting date<br />
calculated by reference to the VWAP of<br />
<strong>Woodside</strong> shares in the five trading days<br />
prior to the vesting date. No amount is<br />
payable by the recipient executive on the<br />
grant or vesting of a variable pay right.<br />
The Board has power under the rules of<br />
the EIP to terminate, suspend or amend<br />
the EIP, and to alter the management or<br />
administration of the EIP. Board decisions<br />
about the operation of the EIP are made on<br />
the recommendation of the Committee.<br />
Short term incentive award<br />
The award of the STI component is<br />
determined by a scorecard which is set<br />
and approved <strong>annual</strong>ly by the Board<br />
(Scorecard), and individual performance.<br />
The Scorecard for 2009 based on four<br />
fundamental measures:<br />
safety – based on total recordable case<br />
frequency;<br />
production;<br />
operating expenditure; and<br />
<strong>Woodside</strong>’s one year total return<br />
to shareholders, ranked within an<br />
international peer group (STI Peer<br />
Group). Total return to shareholders is<br />
the growth in the value of shares over<br />
the performance year, plus the value of<br />
dividends, other distributions paid out<br />
over that year (assuming that dividends<br />
and other distributions are reinvested<br />
in shares on the payment date) and pro<br />
rata buybacks.<br />
The STI Peer Group (1) for the grant of the<br />
2009 STI comprises <strong>Woodside</strong> and the<br />
following companies:<br />
Apache Corporation<br />
Anadarko Petroleum Corporation<br />
BG Group PLC<br />
CNOOC Limited<br />
Marathon Oil Company<br />
Murphy Oil Corporation<br />
Pioneer Natural Resources Company<br />
Repsol YPF, S.A.<br />
Santos Ltd.<br />
Talisman Energy Inc.<br />
(1) As a consequence of the merger between Petro-Canada<br />
and Suncor Energy Inc. in August 2009, Petro-Canada<br />
(which was included in previous peer groups) was<br />
deleted from the 2009 STI Peer Group, leaving 10<br />
comparator companies.<br />
The financial measures for the Scorecard<br />
were chosen because of the impact they<br />
have on shareholder value. The nonfinancial<br />
measure of safety was chosen to<br />
align performance with <strong>Woodside</strong>’s values<br />
and reputation.<br />
The Board has the discretion to aggregate<br />
executives into pool groups to ensure<br />
a fair allocation of total STI between<br />
executives. The total STI award available<br />
for all participating executives is pooled in<br />
each pool group and the Scorecard result<br />
(with a possible value of between zero and<br />
two) is used as a multiple to adjust the<br />
value of the pool(s). The adjusted pool(s)<br />
are allocated among the executives in<br />
that pool group based on their individual<br />
performance relative to other executives.<br />
An executive’s performance during the<br />
year is assessed against their individual<br />
performance agreement, which is set at<br />
the start of each year and includes key<br />
performance indicators (KPIs) relevant<br />
to the executive’s areas of responsibility.<br />
KPIs may include the following:<br />
financial (e.g. revenue, operating costs,<br />
earnings before interest and tax, return<br />
on average capital employed, lifting<br />
costs, drilling costs);<br />
operational (e.g. production volumes,<br />
project progress);<br />
health and safety (e.g. total recordable<br />
case frequency, high potential incident<br />
frequency);<br />
environment (e.g. greenhouse gas<br />
emissions, flared gas); and<br />
human resources (e.g. voluntary<br />
turnover).<br />
These KPIs are chosen because they<br />
align individual performance with the<br />
achievement of <strong>Woodside</strong>’s business plan<br />
and objectives.<br />
The executive receives a performance<br />
rating in accordance with the <strong>annual</strong><br />
performance review process. This rating<br />
is then used to determine entitlement<br />
to the STI award. This assessment is<br />
conducted by the CEO and approved by<br />
the Committee.<br />
The performance assessment for the CEO<br />
is conducted by the Board.<br />
The STI award for a performance year is<br />
paid two thirds in cash and one third in an<br />
award of Time-tested VPRs. The Timetested<br />
VPRs require that the executive’s<br />
employment not be terminated with<br />
cause, which may arise from conduct<br />
and behaviour that constitutes serious<br />
misconduct, wilful failure or negligence,<br />
persistent breach or non-observance<br />
of a fundamental term of the contract<br />
including failure to comply with<br />
requirements in regard to confidentiality,<br />
intellectual property, non-competing and<br />
non-solicitation or being convicted of a<br />
criminal offence or have engaged in any<br />
conduct which would significantly injure<br />
the reputation or the business or by<br />
resignation for three years after allocation.<br />
Time-tested VPRs may vest prior to the<br />
expiry of the three years upon a change of<br />
Governance<br />
47
48<br />
control event, or on the death or total and<br />
permanent disablement of the executive.<br />
Time-tested VPRs granted in respect of<br />
performance years up to and including<br />
the 2008 performance year may also vest<br />
upon redundancy or retirement.<br />
There are no further performance<br />
conditions for vesting of Time-tested VPRs.<br />
Long-term incentive award<br />
The LTI award for the 2009 performance<br />
year is granted in the form of variable pay<br />
rights the vesting of which is linked to<br />
service and total shareholder return (RTSRtested<br />
VPRs).<br />
The vesting of the RTSR-tested VPRs is<br />
conditional on a satisfactory ranking of<br />
<strong>Woodside</strong>’s relative total shareholder<br />
return (RTSR), as calculated under the<br />
EIP rules, over a three or four year period<br />
in comparison with an international peer<br />
group (LTI Peer Group). The LTI Peer<br />
Group (1) for the grant of RTSR-tested VPRs<br />
for the 2009 performance year comprises<br />
<strong>Woodside</strong> and the following companies:<br />
Apache Corporation<br />
Anadarko Petroleum Corporation<br />
BG Group PLC<br />
CNOOC Limited<br />
Inpex Corporation<br />
Marathon Oil Company<br />
Murphy Oil Corporation<br />
Pioneer Natural Resources Company<br />
Repsol YPF, S.A.<br />
Santos Ltd.<br />
Talisman Energy Inc.<br />
(1) As a consequence of the merger between Petro-Canada<br />
and Suncor Energy Inc in August 2009, Petro-Canada<br />
was deleted from the Peer Group for the purposes of LTI<br />
awards made in March 2008 and February 2009, leaving<br />
10 comparator companies. For the 2009 Performance<br />
Year Inpex Corporation has been added to the LTI Peer<br />
Group.<br />
For the 2005 and 2006 performance years,<br />
the LTI component was paid in the form<br />
of VPRs linked to total shareholder return<br />
(TSR) on <strong>Woodside</strong> shares as against a<br />
hurdle rate set by the Board (TSR-tested<br />
VPRs). The TSR-tested VPRs vest when<br />
the <strong>Woodside</strong> TSR as calculated under<br />
the EIP rules, meets the hurdle set by the<br />
Board for a continuous 30 day period at<br />
any time during the two years following<br />
the third anniversary of the allocation<br />
date. If no TSR-tested VPRs vest by the<br />
fifth anniversary of the allocation date the<br />
TSR-tested VPRs will lapse. The hurdle rate<br />
for TSR-tested VPRs was 11% for the 2005<br />
performance year and is 11.5% for the<br />
2006 performance year. The TSR-tested<br />
VPRs granted in respect of the 2005<br />
performance year vested on 8 December<br />
2009.<br />
For the 2007 and subsequent performance<br />
years, the Board changed the performance<br />
measure to the total shareholder return<br />
relative to the LTI Peer Group. This<br />
measure was chosen because it aligns<br />
performance with achieving increased<br />
value to shareholders relative to a<br />
peer group. The RTSR is calculated in<br />
accordance with the EIP rules on the third<br />
anniversary of the allocation of these<br />
RTSR-tested VPRs.<br />
The outcome of the test is measured<br />
against the schedule shown in Table 5 on<br />
page 51.<br />
If no RTSR-tested VPRs vest at this time<br />
(because <strong>Woodside</strong> has not performed at<br />
or above the 50th percentile of the LTI Peer<br />
Group), the RTSR test is re-applied on the<br />
fourth anniversary of the allocation date. If<br />
no RTSR-tested VPRs vest on the fourth<br />
anniversary all VPRs for that performance<br />
year lapse.<br />
The RTSR-tested VPRs require that the<br />
executive’s employment not be terminated<br />
with cause, which may arise from conduct<br />
and behaviour that constitutes serious<br />
misconduct, wilful failure or negligence,<br />
persistent breach or non-observance of<br />
a fundamental term of the employment<br />
contract including failure to comply with<br />
requirements in regard to confidentiality,<br />
intellectual property, non-competing and<br />
non-solicitation or being convicted of a<br />
criminal offence or have engaged in any<br />
conduct which would significantly injure<br />
the reputation or the business or by<br />
resignation for three years after allocation.<br />
RTSR-tested VPRs and TSR-tested VPRs<br />
may vest prior to the satisfaction of the<br />
vesting conditions upon a change of<br />
control event, or on the death or total and<br />
permanent disablement of the executive.<br />
In the event of retirement and redundancy<br />
of a participant RTSR VPRs and TSR-tested<br />
VPRs continue in the plan and are subject<br />
to the normal vesting.<br />
A summary of the terms and conditions<br />
for the variable pay rights awarded under<br />
the EIP are in Table 11 on page 55.<br />
Summaries of executives’ interests in<br />
Time-tested VPRs, TSR-tested VPRs and<br />
RTSR-tested VPRs are in Table 12a, 12b<br />
and 12c on pages 56 to 58.<br />
As a consequence of the renounceable<br />
rights issue by the company in December<br />
2009, the Board exercised its discretion<br />
under the EIP rules to adjust the number<br />
of VPRs held by participants in the EIP<br />
to maintain the value equivalence of the<br />
unvested VPRs awarded for the 2006,<br />
2007 and 2008 performance years<br />
against <strong>Woodside</strong> shares. An additional<br />
allocation of VPRs was made for each<br />
tranche of granted VPRs in respect of<br />
these performance years. The terms and<br />
conditions of the underlying tranche apply<br />
to the additional VPRs.<br />
The summaries in Table 12 on pages 56<br />
to 58 include the additional VPRs granted<br />
pursuant to the exercise of this discretion.<br />
Retention plans<br />
Equity based pay rights<br />
As part of a retention strategy for senior<br />
executives, some executives participate in<br />
equity based retention plans (Pay Rights<br />
Plan) under which eligible executives are<br />
granted pay rights (PRs). A PR entitles the<br />
participant to an award of cash or shares<br />
on vesting.<br />
The amount of the award under the<br />
Pay Rights Plan is determined by the<br />
Board. Participating executives receive an<br />
allocation of PRs under the applicable Pay<br />
Rights Plan. The number of PRs granted<br />
is determined by dividing the amount of<br />
the award by the five day volume weighted<br />
average price of a <strong>Woodside</strong> share at a<br />
specified pricing date.<br />
The condition for award of PRs is<br />
outstanding individual performance, as<br />
assessed by the CEO by reference to the<br />
demonstrated capacity of the executive to<br />
contribute to the generation of sustainable<br />
value for shareholders.<br />
The primary intention of the allocation of<br />
PRs in March 2007 (Pay Rights Plan 1) was<br />
to provide a retention mechanism.<br />
PRs awarded under the retention plan<br />
in November 2007 (Pay Rights Plan<br />
2) require <strong>Woodside</strong>’s relative total<br />
shareholder return for the performance<br />
year immediately preceding the specified<br />
vesting date to be at or above the 50th<br />
percentile of the STI Peer Group (refer<br />
to short term incentives above) before<br />
vesting can occur. The purpose of the Pay<br />
Rights Plan 2 is to retain the executives<br />
and to align them to shareholder value.<br />
One third of the PRs under each Pay<br />
Rights Plan will vest on each of the first,<br />
second and third anniversaries of the<br />
allocation date if the vesting condition<br />
is satisfied on those dates. Entitlement<br />
to PRs is lost if a participating executive<br />
resigns or is terminated with cause before<br />
the due date for vesting. Vesting of PRs<br />
is also conditional on maintenance of<br />
acceptable individual performance. All<br />
PRs will immediately vest in the event of<br />
a change of control or upon the death or<br />
total and permanent disablement of the<br />
executive.<br />
<strong>Woodside</strong> Petroleum Ltd | Annual Report 2009
The Board will determine whether PRs<br />
are to be satisfied in cash or in <strong>Woodside</strong><br />
shares at the time of vesting. If satisfied<br />
in shares, the shares will be purchased on<br />
market. If satisfied in cash, the amount<br />
will be based on the five day VWAP of a<br />
<strong>Woodside</strong> share at the vesting date.<br />
As a consequence of the renounceable<br />
rights issue by the company in December<br />
2009, the Board exercised its discretion<br />
under the terms of the Pay Rights Plans<br />
to adjust the number of unvested PRs<br />
previously granted to executives to<br />
maintain the value equivalence of the<br />
unvested PRs against <strong>Woodside</strong> shares.<br />
An additional allocation of PRs was made<br />
to each tranche of granted PRs. The terms<br />
and conditions of the relevant Pay Rights<br />
Plan apply to the additional PRs granted<br />
under that plan.<br />
Table 6 on page 52 provides a summary<br />
of the terms and conditions for PRs under<br />
the Pay Rights Plans.<br />
<strong>Woodside</strong> employee equity plan<br />
In July 2009 <strong>Woodside</strong> introduced the<br />
<strong>Woodside</strong> Petroleum Ltd 2009 – 2012<br />
Employee Equity Plan (EEP) which is<br />
available to all employees including<br />
executives, other than the CEO. The EEP is<br />
intended to provide a retention mechanism<br />
for participating employees as well as<br />
provide an opportunity to share in the<br />
growth of the company. The Equity Rights<br />
(ERs) are a form of remuneration that is<br />
not dependent on individual performance<br />
or <strong>Woodside</strong>’s performance.<br />
Eligible participants receive a one-off<br />
allocation of ERs. Each ER entitles<br />
the participant to receive a <strong>Woodside</strong><br />
share on the vesting date of 1 August<br />
2012. ERs may vest prior to 1 August<br />
2012 on a change of control or, at the<br />
discretion of the CEO, limited to the<br />
following circumstances; redundancy,<br />
death, termination due to medical illness<br />
or capacity or total and permanent<br />
disablement of a participating employee.<br />
An employee whose employment is<br />
terminated by resignation, retirement or for<br />
cause prior to the 31 July 2012 will forfeit<br />
all of their ERs.<br />
Shares will either be issued by <strong>Woodside</strong><br />
or acquired on market to satisfy vesting ER<br />
entitlements. The number of ERs that vest<br />
may be adjusted for any interruptions to<br />
an employee’s service. Eligible participants<br />
who are on an international assignment<br />
may receive a cash amount subject to<br />
Board discretion.<br />
Participants in the EEP cannot dispose of<br />
or otherwise deal with an ER and do not<br />
receive any dividends or have voting rights<br />
in respect of an ER. Allocations of ERs to<br />
participants will be adjusted in the event of<br />
<strong>Woodside</strong> making a bonus issue of shares<br />
or upon reconstruction of the company’s<br />
share capital.<br />
As a consequence of the renounceable<br />
rights issue by <strong>Woodside</strong> in December<br />
2009, the Board resolved to issue<br />
additional ERs under the EEP to maintain<br />
the value of the ERs held by participating<br />
employees (including executives) against<br />
<strong>Woodside</strong> shares. An additional allocation<br />
of ERs will be made to each participant<br />
in March 2010. The same terms and<br />
conditions which apply to existing ERs will<br />
apply to these additional ERs.<br />
Table 7 on page 52 provides a summary of<br />
executives’ interests in ERs under the EEP.<br />
General employee share plans<br />
<strong>Woodside</strong> share purchase plan<br />
In April 2007 <strong>Woodside</strong> introduced the<br />
<strong>Woodside</strong> Share Purchase Plan (WSPP)<br />
which was available to all employees,<br />
including executives, up to March 2009.<br />
The plan was suspended in April 2009<br />
due to changes in tax legislation. The<br />
WSPP provided eligible employees with<br />
an opportunity to acquire <strong>Woodside</strong> shares<br />
and to share in the growth of the company.<br />
The WSPP year was based on a 1 July to<br />
30 June period (WSPP Year).<br />
Participants in the WSPP elected to<br />
sacrifice an amount of salary, and this<br />
amount was applied by the WSPP Trustee<br />
to purchase <strong>Woodside</strong> shares on market.<br />
The maximum amount that could be salary<br />
sacrificed in the 2008/09 WSPP Year was<br />
$12,000 and the minimum was $3000.<br />
<strong>Woodside</strong> provided funds to the WSPP<br />
Trustee to buy additional <strong>Woodside</strong> shares<br />
(matching shares) on market at a fixed ratio<br />
to the shares purchased with sacrificed<br />
funds (in the 2008/09 WSPP Year the ratio<br />
was one for one and a half; in the 2007/08<br />
WSPP Year the ratio was one for one).<br />
All shares purchased under the WSPP are<br />
held in trust. To become finally entitled to<br />
the matching shares funded by <strong>Woodside</strong>,<br />
a participant must remain a <strong>Woodside</strong><br />
employee for a three year qualification<br />
period. Participants cannot dispose of<br />
shares purchased with sacrificed funds<br />
within this three year qualification period<br />
unless they cease employment with<br />
<strong>Woodside</strong> (in which case they become<br />
entitled to deal with the shares purchased<br />
with sacrificed funds, but lose their<br />
entitlement to matching shares). After the<br />
three year qualification period participants<br />
may elect to have their WSPP shares<br />
retained in the trust for up to a further<br />
seven years, provided they remain in the<br />
employment of <strong>Woodside</strong>.<br />
Participants receive any dividends paid on<br />
shares held in the trust, have voting rights,<br />
may participate in any rights issues and<br />
receive any bonus issues.<br />
The matching shares were a form of<br />
remuneration that was not dependent on<br />
the employees’ individual performance<br />
or <strong>Woodside</strong>’s performance as it was<br />
intended to align eligible employees to<br />
shareholder value.<br />
Table 9 provides a summary of executives’<br />
interests in shares under the WSPP.<br />
Executives were entitled to participate<br />
in the 1 for 12 renounceable rights issue<br />
announced in December 2009 in respect<br />
of their shareholdings under the WSPP.<br />
Table 9 does not include any shares which<br />
may be acquired by executives in 2010<br />
pursuant to the rights issue.<br />
Refer to Table 9 on page 53<br />
Contracts for executives<br />
Each executive has a contract of<br />
employment.<br />
Table 8 on page 52 contains a summary<br />
of the key contractual provisions of<br />
the contracts of employment for the<br />
executives.<br />
Termination provisions<br />
Under each executive contract of<br />
employment <strong>Woodside</strong> may choose to<br />
terminate the contract immediately by<br />
making a payment equal to the ‘Company<br />
Notice Period’ of Fixed Annual Reward in<br />
lieu of notice as shown in Table 8.<br />
Refer to Table 8 on page 52.<br />
In 2009 the Board determined to amend<br />
new executive contracts to ensure that any<br />
payments made in the event of a company<br />
initiated termination of an executive<br />
contract would be consistent with the<br />
Corporations Amendment (Improving<br />
Accountability on Termination Payments)<br />
Act 2009.<br />
CEO remuneration<br />
The remuneration of the CEO is governed<br />
by his contract of employment.<br />
In 2009 the Committee was assisted by<br />
Mercer and PricewaterhouseCoopers in<br />
reviewing the remuneration package of<br />
the CEO. For 2009 the Board determined<br />
to maintain the CEO remuneration<br />
unchanged due to the local and<br />
international market conditions.<br />
Governance<br />
49
50<br />
From the time when the Executive<br />
Incentive Plan (EIP) was introduced until<br />
the end of the 2007 performance year,<br />
the CEO received the variable <strong>annual</strong><br />
remuneration (VAR) component of his<br />
<strong>annual</strong> remuneration through participation<br />
in the EIP.<br />
As part of its 2008 <strong>annual</strong> review of the<br />
CEO's remuneration, the Board resolved<br />
to restructure the VAR component of the<br />
CEO’s remuneration package. As the<br />
revised VAR structure for the CEO does<br />
not align with the structure applicable<br />
to other executives under the EIP, the<br />
CEO has not participated in the EIP for<br />
any performance year after the 2007<br />
performance year. The CEO remains<br />
entitled to all variable pay rights (VPRs)<br />
awarded to him under the EIP in respect of<br />
performance years up to and including the<br />
2007 performance year.<br />
For the 2009 performance year the CEO’s<br />
remuneration is comprised of:<br />
• one third fixed <strong>annual</strong> remuneration<br />
(FAR); and<br />
• two thirds VAR of which 50% is a<br />
short-term incentive component<br />
(STI) and 50% is long-term incentive<br />
component (LTI).<br />
Short-term incentive<br />
STI is allocated as two-thirds cash and onethird<br />
Time-tested VPRs. The Time-tested<br />
VPRs have the same terms and conditions<br />
as those awarded under the EIP.<br />
The grant of an STI award to the CEO<br />
is determined by the EIP Scorecard and<br />
individual performance as determined<br />
by the Board. For the 2009 performance<br />
year the CEO is entitled to receive an<br />
STI calculated and treated in all respects<br />
(including performance conditions, hurdles<br />
and timing), as if it was an entitlement<br />
arising under the EIP – except for the STI/<br />
LTI allocation referred to above.<br />
The performance of the CEO is reviewed<br />
by the Board against the following factors:<br />
• Setting and pursuing the growth<br />
agenda.<br />
• Achieving effective execution.<br />
• Building enterprise and organisational<br />
capacity.<br />
• Enhancing culture and reputation.<br />
• Ensuring shareholder focus.<br />
Long-term incentive<br />
In 2008, 50% of the CEO’s anticipated<br />
LTI VAR allocation ($1,312,500) for<br />
performance years 2008, 2009 and 2010<br />
(normally allocated in the year following the<br />
performance year) was brought forward<br />
and allocated in 2008 (Accelerated LTI).<br />
The Accelerated LTI is subject to the<br />
RTSR-test as for the 2007 VPR allocation<br />
under the EIP as described in Table 11 on<br />
page 55.<br />
This change was made to ensure retention<br />
of the CEO’s services and in recognition<br />
of the inability of the CEO to influence<br />
the RTSR performance of <strong>Woodside</strong> (and<br />
the consequential value of unvested LTI<br />
entitlements) after his departure.<br />
The remaining LTI VAR entitlement<br />
for the 2009 performance year (being<br />
the assessed entitlement for the 2009<br />
performance year, less the value of the<br />
Accelerated LTI for that performance<br />
year) (LTI VAR Balance) will be allocated in<br />
March 2010 and will be subject to RTSR<br />
testing in March 2013. The remaining LTI<br />
VAR entitlement for the 2010 performance<br />
year will be allocated in March 2011 and be<br />
subject to RTSR-testing after three years<br />
(in March 2014). The vesting conditions for<br />
these LTI VAR Balance allocations reflect<br />
those contained in the EIP.<br />
A summary of the terms and conditions<br />
of the CEO’s VAR for 2009 is contained in<br />
Table 10 on page 54.<br />
For the performance year ending<br />
31 December 2011 and each subsequent<br />
performance year, the CEO will be entitled<br />
to an amount of LTI VAR to be satisfied<br />
by the allocation of RTSR-tested VPRs<br />
with the same vesting and performance<br />
conditions as if they were allocated<br />
under the EIP, calculated in the way as<br />
described under the EIP section above and<br />
in accordance with the targets set out in<br />
Table 4.<br />
Table 1 - Annual base Board and committee fees for non-executive directors<br />
Position Board Audit & Risk<br />
Committee<br />
Chairman of the Board (1) $590,000 (3)<br />
Human Resources<br />
& Compensation<br />
Committee<br />
Refer to Table 4 on page 51.<br />
Securities Dealing Policy<br />
<strong>Woodside</strong>’s Securities Dealing Policy<br />
prohibits executives who participate<br />
in an equity-based executive incentive<br />
plan, from entering into any transaction<br />
which would have the effect of hedging<br />
(or otherwise transferring to any other<br />
person the risk of any fluctuation in the<br />
value of any unvested entitlement in<br />
<strong>Woodside</strong> securities). Directors proposing<br />
to deal in, charge, mortgage or otherwise<br />
encumber or use as collateral, <strong>Woodside</strong><br />
securities or enter into arrangements<br />
to limit the economic risk of a vested<br />
holding in <strong>Woodside</strong> securities, must<br />
obtain the approval of the Chairman (or,<br />
where the notifying executive is the<br />
Chairman, the CEO) prior to entering into<br />
the arrangement and immediately provide<br />
details of the arrangements entered<br />
into. Executives who <strong>report</strong> directly to<br />
the CEO and the Company Secretary/<br />
ies must submit a completed compliance<br />
certificate in respect of any dealing or<br />
other financial arrangement to their direct<br />
manager and then to the General Counsel<br />
for acknowledgement. Adherence to<br />
this policy by executives is monitored by<br />
six monthly directors’ questionnaires to<br />
management.<br />
2009 remuneration details<br />
Table 13 summarises the remuneration<br />
both paid and payable to the executives for<br />
the 2009 performance year, including the<br />
VAR allocation.<br />
Refer to Table 13 on page 59.<br />
The value of the Scorecard for 2009 was<br />
1.47 out of a maximum possible result of 2.<br />
The total potential amount of the STI pool<br />
for 2009 ranged from a minimum of $0 up<br />
to a maximum of $27,409,442. The actual<br />
STI pool for 2009 was $ 20,145,940 for 87<br />
participants (including the executives).<br />
Sustainability<br />
Committee<br />
Nominations<br />
Committee<br />
Non-executive directors (2) $175,000 (3)<br />
Committee Chairman $50,000 (3) $30,000 (3) $30,000 (3) Nil<br />
Committee member $25,000 (3) $20,000 (3) $20,000 (3) Nil<br />
(1) Inclusive of committee work. (2) Board fees, other than the Chairman. (3) Annual fee from 1 July 2008.<br />
<strong>Woodside</strong> Petroleum Ltd | Annual Report 2009
Table 2 - Total remuneration paid to non-executive directors in 2009<br />
Non-executive director Salaries,<br />
fees and<br />
allowances<br />
MA Chaney<br />
MA Cilento (4)<br />
E Fraunschiel<br />
A Jamieson (5)(6)<br />
PJMH Jungels<br />
DI McEvoy<br />
D Megat<br />
I Robertson (5)(8)<br />
J Stausholm (5)(9)<br />
JR Broadbent (10)<br />
(1) Non-executive directors elected to freeze their fees at<br />
the time of the 2009 review, therefore fees have not<br />
increased since 1 July 2008. The difference in the total<br />
paid in the 2009 year compared to the 2008 year reflects<br />
a whole year at the rates as increased from 1 July 2008<br />
whereas the 2008 figures only reflect 6 months at the<br />
increased rate.<br />
(2) Relates to participation in the NEDSP.<br />
Table 3 - <strong>Woodside</strong> five year performance<br />
(1) Basic and diluted earnings per share from total<br />
operations.<br />
Cash salary and fees Cash<br />
bonuses<br />
Short-term Post employment<br />
NEDSP (2) Short-term<br />
incentive /<br />
bonus (3)<br />
Non<br />
monetary<br />
Benefits and<br />
allowances<br />
Pension<br />
super<br />
Company<br />
contributions<br />
to superannuation<br />
Prescribed<br />
benefits<br />
Directors’<br />
retiring<br />
allowance (3)<br />
$ $ $ $ $ $ $<br />
Total (1)<br />
2009 590,000 - - - 53,100 - 643,100<br />
2008 545,001 - - - 49,050 - 594,051<br />
2009 219,950 - - - 19,796 - 239,746<br />
2008 10,069 - - - 906 - 10,975<br />
2009 245,001 - - - 22,050 - 267,051<br />
2008 234,500 - - - 21,105 - 255,605<br />
2009 212,550 - - - - - 212,550<br />
2008 206,555 - - - - - 206,555<br />
2009 294,803 4,997 - - - - 299,800<br />
2008 241,942 28,018 - - - - 269,960<br />
2009 230,000 - - - 20,700 - 250,700<br />
2008 276,500 (7) - - - 19,845 - 296,345<br />
2009 235,031 10,219 - - - - 245,250<br />
2008 199,791 30,656 - - - - 230,447<br />
2009 218,000 - - - - - 218,000<br />
2008 109,597 - - - - - 109,597<br />
2009 - - - - - - -<br />
2008 103,550 - - - - - 103,550<br />
2009 - - - - - - -<br />
2008 86,042 21,979 - - 9,722 - 117,743<br />
(3) Non-executive directors are not entitled to cash bonuses<br />
nor directors’ retiring allowance.<br />
(4) Appointed 11 December 2008.<br />
(5) Board fees for directors who are both nominated and<br />
employed by the Shell Group are paid directly to their<br />
employing company, not the individual.<br />
(6) Dr Andrew Jamieson retired from the Royal Dutch Shell<br />
Group on 30 June 2009. He continues to serve on the<br />
<strong>Woodside</strong> Board.<br />
(2) This calculation is <strong>annual</strong>ised and measured in Australian<br />
dollars. The significant change in the three year rolling<br />
TSR percentage for 2008 is due to the impact of the<br />
economic downturn.<br />
(7) This amount includes $56,000 which Mr McEvoy<br />
received during the year as consulting fees for extra<br />
services he provided outside his normal Board and<br />
committee duties. These fees were paid on commercial<br />
terms and conditions at market rates.<br />
(8) Appointed 30 June 2008.<br />
(9) Resigned 30 June 2008.<br />
(10) Retired 4 July 2008.<br />
Year ended 31 December 2009 2008 2007 2006 2005<br />
Net profit after tax ($ million) 1,824 1,786 1,030 1,427 1,107<br />
Earnings per share (cents) (1) 259 260 153 217 169<br />
Dividends per share (cents) 110 135 104 126 93<br />
Production (MMboe) 80.9 81.3 70.6 67.9 59.7<br />
Share closing price ($)<br />
(last trading day of the year)<br />
47.20 36.70 50.39 38.11 39.19<br />
3 year rolling TSR (%) (2) 56.86 0.98 41.25 42.55 54.71<br />
Relative TSR (3) (1 year) 1st Quartile 2nd Quartile 2nd Quartile 2nd Quartile 1st Quartile<br />
Table 4 - Allocation of remuneration between Fixed and Variable Annual Reward<br />
Not at Risk At Risk<br />
Fixed Annual Reward Variable Annual Reward<br />
Position STI LTI<br />
CEO 33.3% 33.3% 33.3%<br />
Executives 45%-50% 30%-33% 20%-22%<br />
(3) As discussed under the STI component of EIP on<br />
page 47.<br />
Table 5 - Vesting schedule<br />
<strong>Woodside</strong> RTSR percentile<br />
position within Peer Group<br />
Vesting of<br />
RTSR-tested<br />
VPRs<br />
Less than 50th percentile no vesting<br />
Equal to 50th percentile 50% vest<br />
Equal to 75th percentile 100% vest<br />
150% vest<br />
(i.e. 50% uplift<br />
Equal to 100th percentile<br />
for topping Peer<br />
Group)<br />
Vesting between these percentile points is<br />
on a pro rata basis.<br />
Governance<br />
51
52<br />
Table 6 – Summary of terms and conditions for PRs under equity based retention plans<br />
Terms and Conditions Offer 1 Offer 2<br />
Allocation Date 15 March 2007 1 November 2007<br />
Pricing Date 15 March 2007 1 November 2007<br />
Grant Date 15 March 2007 1 November 2007<br />
Volume Weighted Average Price $35.78 $49.25<br />
Performance condition (for allocation) Outstanding individual performance Outstanding individual performance<br />
Reason for performance condition<br />
(allocation)<br />
See above under ‘Executive Remuneration Policy’ See above under ‘Executive Remuneration Policy’<br />
Performance condition (for vesting) Maintenance of acceptable individual performance Maintenance of acceptable individual performance<br />
over period from allocation date to vesting date. over period from allocation date to vesting date.<br />
One third of the PRs will vest on each of the first, Minimum level of company RTSR performance at or<br />
second and third anniversaries of the allocation above 50th percentile of the Peer Group over period<br />
date.<br />
from allocation date to vesting date.<br />
One third of the PRs will vest on each of the first,<br />
second and third anniversaries of the allocation<br />
date, subject to satisfactory performance.<br />
Reason for performance condition (vesting) See above under ‘Executive Remuneration Policy’ See above under ‘Executive Remuneration Policy’<br />
Vesting Date (1) 15 March 2008; 15 March 2009; 15 March 2010 15 March 2009; 15 March 2010; 15 March 2011<br />
Lapse of PRs before Vesting Date If employment terminated for cause or by If employment terminated for cause or by<br />
resignation all unvested PRs will lapse.<br />
resignation all unvested PRs will lapse.<br />
(1) Provision is made for accelerated vesting in certain events such as total and permanent disability, death or a change in control of <strong>Woodside</strong>.<br />
Table 7 – Summary of executives' interests in Equity Rights under the EEP<br />
Shares<br />
Name Grant date Number of Equity<br />
Rights granted<br />
Number of Equity<br />
Rights which have<br />
lapsed/forfeited<br />
Number of Equity<br />
Rights which have<br />
vested during 2009<br />
Fair Value (1)<br />
of Equity Rights<br />
F Ahmed 31 October 2009 4,350 Nil Nil $44.56<br />
M Chatterji 31 October 2009 4,350 Nil Nil $44.56<br />
R Cole 31 October 2009 4,350 Nil Nil $44.56<br />
L Della Martina 31 October 2009 4,350 Nil Nil $44.56<br />
B Donaghey 31 October 2009 Nil Nil Nil $44.56<br />
E Howell 31 October 2009 4,350 Nil Nil $44.56<br />
A Kantsler 31 October 2009 4,350 Nil Nil $44.56<br />
V Santostefano 31 October 2009 4,350 Nil Nil $44.56<br />
(1) The fair value of Equity Rights as at their date of grant has been determined by reference to the share price at acquisition. The fair value of Equity Rights is amortised over the vesting period,<br />
such that 'Total remuneration' includes a portion of the fair value of unvested equity compensation during the year. The amount included as remuneration is not related to or indicative of the<br />
benefit (if any) the individual executives may ultimately realise should these equity instruments vest.<br />
Table 8 – Summary of contractual provisions for executives<br />
Name Employing company Contract duration Termination<br />
notice period<br />
company (4)(5)<br />
Termination<br />
notice period<br />
Executive (5)<br />
D Voelte (1) <strong>Woodside</strong> Petroleum Ltd Unlimited 12 months 6 months<br />
F Ahmed <strong>Woodside</strong> Energy Ltd Fixed Term Contract until 13 February 2012 12 months 6 months<br />
M Chatterji <strong>Woodside</strong> Energy Ltd Fixed Term Contract until 31 December 2010 (2) 12 months 6 months<br />
R Cole <strong>Woodside</strong> Energy Ltd Unlimited 12 months 6 months<br />
L Della Martina <strong>Woodside</strong> Energy Ltd Unlimited 12 months 6 months<br />
B Donaghey (6) <strong>Woodside</strong> Energy Ltd Unlimited 12 months 6 months<br />
E Howell <strong>Woodside</strong> Energy Ltd Unlimited (3) 12 months 6 months<br />
A Kantsler <strong>Woodside</strong> Energy Ltd Unlimited 12 months 6 months<br />
V Santostefano <strong>Woodside</strong> Energy Ltd Unlimited 12 months 6 months<br />
(1) Other benefits: Mr Voelte’s employment in Australia may have adverse tax consequences for Mr Voelte and his wife in respect of his non-Australian income. <strong>Woodside</strong> has agreed to a limited<br />
“taxation equalisation” provision to compensate for this. Mr Voelte and his wife may claim reimbursement of tax paid or payable to the Australian Taxation Office for income or gain in relation<br />
to certain disclosed investments in the US to a maximum of US$500,000 over the period of Mr Voelte’s employment.<br />
(2) Mr Chatterji's fixed term contract was extended from 31 March 2010 until 31 December 2010. Mr Chatterji intends to leave <strong>Woodside</strong> at this time.<br />
(3) Ms Howell’s contract was converted from a fixed term contract to an unlimited contract in September 2009.<br />
(4) Termination provisions – <strong>Woodside</strong> may choose to terminate the contract immediately by making a payment equal to the ‘Company Notice Period’ of FAR in lieu of notice. In the event of<br />
termination for serious misconduct or other nominated circumstances, executives are not entitled to this termination payment.<br />
(5) On termination of employment, executives will be entitled to the payment of any FAR calculated up to the termination date, any <strong>annual</strong> leave entitlement accrued at the termination date<br />
and any payment or award permitted under the EIP Rules. Executives are restrained from certain activities for specified periods after termination of their employment in order to protect<br />
<strong>Woodside</strong>’s interests.<br />
(6) On 18 May 2009 Ms Donaghey became key management personnel and effective 31 October 2009 Ms Donaghey departed from <strong>Woodside</strong>.<br />
<strong>Woodside</strong> Petroleum Ltd | Annual Report 2009
Table 9 – Summary of executives’ interests in shares under the WSPP (1)<br />
Name WSPP Year Opening balance Shares purchased under<br />
WSPP<br />
Matching<br />
shares<br />
Closing balance<br />
2009 WSPP<br />
D Voelte<br />
(2) 498 158 237 893<br />
2008 WSPP (3) 124 173 201 498<br />
2007 WSPP (4) - 62 62 124<br />
F Ahmed (6) 2009 WSPP<br />
2008 WSPP<br />
-<br />
-<br />
-<br />
-<br />
-<br />
-<br />
-<br />
-<br />
2009 WSPP 498 158 237 893<br />
M Chatterji<br />
2008 WSPP 124 173 201 498<br />
2007 WSPP - 62 62 124<br />
2009 WSPP 498 158 237 893<br />
R Cole<br />
2008 WSPP 124 173 201 498<br />
2007 WSPP - 62 62 124<br />
L Della Martina (5) 2009 WSPP<br />
2008 WSPP<br />
498<br />
124<br />
158<br />
173<br />
237<br />
201<br />
893<br />
498<br />
B Donaghey (7) 2009 WSPP - - - -<br />
2009 WSPP - - - -<br />
E Howell<br />
2008 WSPP - - - -<br />
2007 WSPP - - - -<br />
2009 WSPP 358 - - 358<br />
A Kantsler<br />
2008 WSPP 124 117 117 358<br />
2007 WSPP - 62 62 124<br />
2009 WSPP 498 158 237 893<br />
V Santostefano<br />
2008 WSPP 124 173 201 498<br />
2007 WSPP - 62 62 124<br />
(1) For a full summary of executives interests in shares see<br />
Table 14 on page 60.<br />
(2) 2009 WSPP refers to the purchases made in 2009 for<br />
the 2008/09 Plan. The matching shares for the 2009<br />
WSPP had a fair value of $35.21 and $38.60 per share<br />
respectively.<br />
(3) 2008 WSPP refers to the plan for the 2008/09 Plan Year<br />
as well as the purchases made in 2008 for the 2007/08<br />
Plan. The matching shares for the 2008 WSPP were<br />
granted on 20 June 2008 and had a fair value of $52.82<br />
per share.<br />
(4) 2007 WSPP refers to the plan for the 2007/08 Plan Year.<br />
The matching shares for the 2007 WSPP were granted<br />
on 29 August 2007 and had fair values of $48.25,<br />
$55.93, and $62.86 per share respectively. The last two<br />
purchases for 2007 WSPP were made in 2008.<br />
(5) Mr Della Martina did not meet the definition of KMP<br />
under AASB 124 for previous years but did fall within the<br />
As at 31 December 2009, no matching shares had vested or lapsed for any Key Management Personnel.<br />
definition for 2008 and 2009. Previous years comparative<br />
figures are not shown.<br />
(6) Mr Ahmed did not meet the definition of KMP under<br />
AASB 124 for the 2007 year. Previous years comparative<br />
figures are not shown.<br />
(7) Ms Donaghey did not meet the definition of KMP under<br />
AASB 124 for the 2008 year. Previous years comparative<br />
figures are not shown.<br />
Governance<br />
53
54<br />
Table 10 – Summary of terms and conditions of VPRs for the CEO’s 2009 VAR allocation<br />
Terms and Conditions 2009 VAR Allocation 2008 VAR Allocation<br />
STI time-tested VPRs LTI RTSR-tested VPRs STI time-tested VPRs LTI RTSR-tested VPRs Accelerated LTI<br />
Allocation Date 5 March 2010 27 February 2009 14 March 2008<br />
Pricing Date 31 December 2009 31 December 2008 31 December 2007<br />
Grant Date 1 January 2009 1 January 2008 19 February 2008<br />
Volume Weighted Average<br />
$47.86 $33.50 $48.25<br />
Price<br />
Performance condition (for EIP Scorecard and individual Not applicable EIP Scorecard and Not applicable<br />
allocation)<br />
performance assessment<br />
individual performance<br />
assessment<br />
Reason for performance See above under ‘Short term Not applicable See above under ‘Short Not applicable<br />
condition (allocation) incentive award’<br />
term incentive award’<br />
Performance condition Not applicable If <strong>Woodside</strong> TSR performance Not applicable If <strong>Woodside</strong> TSR performance equals or exceeds 50th Peer Group percentile for relevant<br />
(for vesting)<br />
equals or exceeds 50th Peer Group<br />
period, VPRs vest on sliding scale<br />
percentile for relevant period, VPRs<br />
vest on sliding scale<br />
Reason for performance Not applicable Relative TSR is independent of Not applicable Relative TSR is independent of market conditions and is considered a more relevant<br />
condition (vesting)<br />
market conditions and is considered<br />
measure of management performance in terms of value delivered to shareholders over<br />
a more relevant measure of<br />
the medium to long term<br />
management performance in terms<br />
of value delivered to shareholders<br />
over the medium to long term<br />
Vesting Date (2) 5 March 2013 Initial vesting 5 March 2013 27 February 2012 27 February 2012 31 March 2011 (1)<br />
Application of Retesting Not applicable If RTSR threshold not achieved as at Not applicable If RTSR threshold If RTSR threshold not achieved as at 14 March 2011, retest on<br />
5 March 2013 retest on 5 March 2014<br />
not achieved as at 27 14 March 2012<br />
February 2012, retest on<br />
27 February 2013.<br />
(3)<br />
Lapse of VPRs before If employment terminated for cause or by resignation all unvested VPRs will If employment terminated for cause or by resignation If employment terminated for cause or by resignation all<br />
Vesting Date<br />
lapse<br />
all unvested VPRs will lapse<br />
unvested VPRs will lapse<br />
Accelerated LTI is also subject to varied vesting conditions:<br />
Accelerated LTI allocated in respect of the 2008<br />
performance year will only vest where the CEO remains<br />
employed with <strong>Woodside</strong> on<br />
31 March 2009; and<br />
Accelerated LTI allocated in respect of the 2009<br />
performance year will only vest where the CEO remains<br />
employed with <strong>Woodside</strong> on<br />
31 March 2010; and<br />
Accelerated LTI allocated in respect of the 2010<br />
performance year will only vest where the CEO remains<br />
employed with <strong>Woodside</strong> on<br />
31 March 2011<br />
Lapse of VPRs if not Not applicable If threshold RTSR not achieved on Not applicable If threshold RTSR not If threshold RTSR not achieved Accelerated LTI VPRs will<br />
vested<br />
retest, TSR-tested VPRs will lapse<br />
achieved on retest, TSR- lapse<br />
tested VPRs will lapse<br />
(1) Vesting of the Accelerated LTI is also conditional on an RTSR-test in 2011 which is undertaken in the same way as under the EIP. Limited accelerated vesting applies to the Accelerated LTI if a change of control event occurs during the 2008, 2009 or 2010 performance years.<br />
(2) Provision is made for accelerated vesting in certain events such as total and permanent disability, death or a change in control of <strong>Woodside</strong>.<br />
<strong>Woodside</strong> Petroleum Ltd | Annual Report 2009<br />
(3) Correction to the information provided in the 2008 <strong>annual</strong> <strong>report</strong>.
Table11 – Summary of terms and conditions for VPRs under the EIP<br />
The following table summarises the terms and conditions of the VPRs awarded to the executives under the EIP for 2009, 2008, 2007, 2006 and 2005.<br />
2009 VPR Allocation 2008 VPR Allocation 2007 VPR Allocation 2006 VPR Allocation 2005 VPR Allocation<br />
Terms and<br />
Conditions STI time- LTI RTSR-<br />
STI time- LTI RTSR-<br />
STI time- LTI RTSR-<br />
STI time- LTI TSR-<br />
STI time- LTI TSRtested<br />
VPRs tested VPRs<br />
tested VPRs tested VPRs<br />
tested VPRs tested VPRs<br />
tested VPRs tested VPRs<br />
tested VPRs tested VPRs<br />
Allocation Date 5 March 2010 27 February 2009 14 March 2008 15 March 2007 13 March 2006<br />
Pricing Date 31 December 2009 31 December 2008 31 December 2007 15 March 2007 13 March 2006<br />
Grant Date 1 January 2009 1 January 2008 1 January 2007 1 January 2006 19 April 2005<br />
Volume<br />
Weighted $47.86 $33.50 $48.25 $35.78 $40.31<br />
Not applicable <strong>Woodside</strong> Economic Value Added (EVA) and individual performance<br />
EIP Scorecard<br />
and individual<br />
Not applicable<br />
performance<br />
assessment<br />
Not applicable See above<br />
under<br />
‘Short term<br />
incentives<br />
award’<br />
EIP Scorecard<br />
and individual<br />
Not applicable<br />
performance<br />
assessment<br />
Not applicable See above<br />
under<br />
‘Short term<br />
incentives<br />
award’<br />
EIP Scorecard<br />
and individual<br />
performance<br />
assessment<br />
See above<br />
under<br />
‘Short term<br />
Average Price<br />
Performance<br />
condition (for<br />
allocation)<br />
Not applicable <strong>Woodside</strong> EVA was adopted as a measure of the value added by <strong>Woodside</strong>’s<br />
operations during the relevant year, with a view to linking executive<br />
remuneration to value added for shareholders<br />
The individual performance measure assesses the contribution made by<br />
individual executives, against pre-set individual objectives aligned to <strong>Woodside</strong>’s<br />
strategic plan, which has as its ultimate objective the maximization of<br />
incentives<br />
award’<br />
Reason for<br />
performance<br />
condition<br />
(allocation)<br />
Not applicable If compounded TSR of<br />
<strong>Woodside</strong> is equal to<br />
or above TSR Hurdle<br />
Rate of 11%pa (1) for<br />
30 consecutive days<br />
ending on testing date<br />
Not applicable TSR was adopted<br />
because it is a widely<br />
accepted measure of<br />
shareholder wealth<br />
creation over the<br />
medium to long term<br />
– initial approach was<br />
to set an absolute TSR<br />
benchmark percentage<br />
shareholder returns<br />
Not applicable If compounded TSR of<br />
<strong>Woodside</strong> is equal to<br />
or above TSR Hurdle<br />
Rate of 11.5%pa (1) for<br />
30 consecutive days<br />
ending on testing date<br />
Not applicable TSR was adopted<br />
because it is a widely<br />
accepted measure of<br />
shareholder wealth<br />
creation over the<br />
medium to long term<br />
– initial approach was<br />
to set an absolute TSR<br />
benchmark percentage<br />
Not applicable If <strong>Woodside</strong> TSR<br />
performance equals<br />
or exceeds 50th Peer<br />
Group percentile for<br />
relevant period, VPRs<br />
vest on sliding scale<br />
Not applicable Relative TSR adopted in<br />
2007 - is independent<br />
of market conditions<br />
and is considered a<br />
more relevant measure<br />
of management<br />
performance in terms<br />
of value delivered to<br />
shareholders over the<br />
medium to long term<br />
14 March 2011 Initial vesting test<br />
14 March 2011<br />
Not applicable If <strong>Woodside</strong> TSR<br />
performance equals<br />
or exceeds 50th Peer<br />
Group percentile for<br />
relevant period, VPRs<br />
vest on sliding scale<br />
Not applicable Relative TSR is<br />
independent of<br />
market conditions and<br />
is considered a more<br />
relevant measure<br />
of management<br />
performance in terms<br />
of value delivered to<br />
shareholders over the<br />
medium to long term<br />
Performance<br />
condition (for<br />
vesting)<br />
Reason for<br />
performance<br />
condition<br />
(vesting)<br />
Initial vesting test as at<br />
14 March 2009 was not<br />
passed<br />
Vested 13<br />
March 2009 (3)<br />
15 March 2010 Initial vesting test as at<br />
16 March 2010<br />
medium to long term<br />
Initial vesting 27<br />
February 2012<br />
27 February<br />
2012<br />
Vesting Date (2) 5 March 2013 Initial vesting<br />
5 March 2013<br />
Not applicable Vested 8 December<br />
2009 (3)<br />
Not applicable If TSR-test not met<br />
as at 16 March 2010,<br />
retest over next two<br />
years until<br />
15 March 2012<br />
Not applicable If RTSR threshold not<br />
achieved as at<br />
14 March 2011, retest<br />
on 14 March 2012<br />
Not applicable If RTSR threshold not<br />
achieved as at<br />
27 February 2012,<br />
retest on<br />
27 February 2013<br />
Not applicable If RTSR threshold not<br />
achieved as at<br />
5 March 2013, retest<br />
on 5 March 2014<br />
Application of<br />
Retesting<br />
Lapse of VPRs If employment terminated for cause If employment terminated for cause If employment terminated for cause or If employment terminated for cause or If employment terminated for cause or<br />
before Vesting or by resignation all unvested VPRs or by resignation all unvested VPRs by resignation all unvested VPRs will by resignation all unvested VPRs will by resignation all unvested VPRs will<br />
Date<br />
will lapse<br />
will lapse<br />
lapse<br />
lapse<br />
lapse<br />
Lapse of VPRs Not applicable If threshold RTSR not Not applicable If threshold RTSR not Not applicable If threshold RTSR not Not applicable If TSR-test not met by Not applicable Not applicable<br />
if not vested<br />
achieved on retest,<br />
achieved on retest,<br />
achieved on retest,<br />
15 March 2012, TSR-<br />
RTSR-tested VPRs will<br />
RTSR-tested VPRs will<br />
TSR-tested VPRs will<br />
tested VPRs will lapse<br />
lapse<br />
lapse<br />
lapse<br />
(1) (2) (3) The Board set the TSR Hurdle Rate with reference to <strong>Woodside</strong>’s Cost of Equity Capital <strong>annual</strong>ly before VPRs were allocated. Provision is made for accelerated vesting in certain events such as total and permanent disability, death or a change in control of <strong>Woodside</strong>. 100% vested in WPL shares.<br />
Governance<br />
55
56<br />
Table 12a – Summary of the executives’ interests in time-tested VPRs (1)<br />
Name Allocation date Vesting date (2) Awarded<br />
but not<br />
vested<br />
D Voelte<br />
F Ahmed (6)<br />
M Chatterji<br />
R Cole<br />
L Della Martina (7)<br />
B Donaghey (8)<br />
E Howell (9)<br />
A Kantsler<br />
V Santostefano (9)<br />
Vested in<br />
2009<br />
% of<br />
total<br />
vested<br />
Fair value (3)(10) of VPR/PR by performance year<br />
2009 2008 2007 2006 2005<br />
March 2006 March 2009 12,827 100 17.75<br />
March 2007 (4) March 2010 20,122 34.61<br />
March 2008 March 2011 16,513 33.66<br />
February 2009 February 2012 28,209 44.56<br />
December 2009 (5) March 2010 167 46.89<br />
December 2009 (5) March 2011 137 45.75<br />
December 2009 (5) February 2012 234 44.68<br />
March 2010 March 2013 31,445 33.10<br />
February 2009 February 2012 3,245 42.59<br />
December 2009 (5) March 2011 8 42.55<br />
December 2009 (5) February 2012 27 44.68<br />
March 2010 March 2013 3,692 33.10<br />
March 2006 March 2009 3,429 100 17.75<br />
March 2007 March 2010 5,517 34.61<br />
March 2008 March 2011 4,313 33.66<br />
February 2009 February 2012 7,450 44.56<br />
December 2009 (5) March 2010 46 46.89<br />
December 2009 (5) March 2011 36 45.75<br />
December 2009 (5) February 2012 62 44.68<br />
March 2010 March 2013 7,535 33.10<br />
March 2007 March 2010 1,370 34.61<br />
March 2008 March 2011 1,756 33.66<br />
February 2009 February 2012 4,543 44.56<br />
December 2009 (5) March 2010 11 46.89<br />
December 2009 (5) March 2011 15 45.75<br />
December 2009 (5) February 2012 38 44.68<br />
March 2010 March 2013 4,599 33.10<br />
March 2006 March 2009 1,371 100 17.75<br />
February 2009 February 2012 2,916 44.56<br />
December 2009 (5) March 2010 14 46.89<br />
December 2009 (5) March 2011 14 45.75<br />
December 2009 (5) February 2012 24 44.68<br />
March 2010 March 2013 2,950 33.10<br />
March 2006 March 2009 850 100 17.75<br />
March 2010 March 2013 0 33.10<br />
March 2007 March 2010 525 34.61<br />
March 2008 March 2011 1,905 33.66<br />
February 2009 February 2012 3,110 44.56<br />
December 2009 (5) March 2010 4 46.89<br />
December 2009 (5) March 2011 16 45.75<br />
December 2009 (5) February 2012 26 44.68<br />
March 2010 March 2013 4,192 33.10<br />
March 2006 March 2009 3,277 100 17.75<br />
March 2007 March 2010 1,650 34.61<br />
March 2008 March 2011 2,542 33.66<br />
February 2009 February 2012 4,273 44.56<br />
December 2009 (5) March 2010 14 46.89<br />
December 2009 (5) March 2011 21 45.75<br />
December 2009 (5) February 2012 35 44.68<br />
March 2010 March 2013 5,763 33.10<br />
March 2006 March 2009 1,523 100 17.75<br />
March 2007 March 2010 1,327 34.61<br />
March 2008 March 2011 1,669 33.66<br />
February 2009 February 2012 2,910 44.56<br />
December 2009 (5) March 2010 11 46.89<br />
December 2009 (5) March 2011 14 45.75<br />
December 2009 (5) February 2012 24 44.68<br />
March 2010 March 2013 3,786 33.10<br />
(1) For valuation purposes all VPRs are treated as if they<br />
will be equity settled, with the exception of Mr Ahmed’s<br />
2008 VPRs which are to be settled in cash as a result<br />
of his international secondment. This fair value is<br />
recalculated at the end of every <strong>report</strong>ing period. In 2008<br />
the fair value was $47.92.<br />
(2) Vesting date and exercise date are the same. Vesting is<br />
subject to satisfaction of vesting conditions.<br />
(3) In accordance with the requirements of AASB 124<br />
Related Party Disclosures, the fair value of rights as at<br />
their date of grant has been determined by applying<br />
the Binomial or Black Scholes option pricing technique<br />
with the exception of Mr Ahmed as noted in (1). The fair<br />
value of rights is amortised over the vesting period, such<br />
that ‘Total remuneration’ includes a portion of the fair<br />
value of unvested equity compensation during the year.<br />
The amount included as remuneration is not related to or<br />
indicative of the benefit (if any) that individual executives<br />
may ultimately realise should these equity instruments<br />
vest.<br />
(4) Incorporates a VPR allocation of $900,000 in respect of<br />
the 2006 performance year, awarded in addition to the<br />
EIP entitlements.<br />
(5) Additional allocation of VPRs to each tranche of granted<br />
VPRs, following renounceable equity rights issue by the<br />
company.<br />
(6) Mr Ahmed was not within the definition of KMP under<br />
AASB 124 for the 2006 and 2007 years. Previous years<br />
comparative figures are not shown.<br />
(7) Mr Della Martina did not meet the definition of KMP<br />
under AASB 124 for previous years but did fall within<br />
the definition for 2008 and 2009. Previous year's<br />
comparative figures are not shown.<br />
(8) Ms Donaghey was not within the definition of KMP<br />
under AASB 124 for years prior to 2009. Previous years<br />
comparative figures are not shown. A total of 4,724 time<br />
tested VPRs were forfeit on Ms Donaghey's departure<br />
on 31 October 2009.<br />
(9) Ms Howell and Mr Santostefano did not meet the<br />
definition of KMP under AASB 124 for the 2006 financial<br />
year but are considered KMP for 2007, 2008 and 2009.<br />
2006 comparative figures are not shown.<br />
(10) Prior year fair values have been appropriately restated to<br />
reflect the terms and conditions.<br />
<strong>Woodside</strong> Petroleum Ltd | Annual Report 2009
Table 12b – RTSR-tested and TSR-tested VPRs (1)<br />
Name Allocation<br />
date<br />
D Voelte<br />
F Ahmed (11)<br />
M Chatterji<br />
R Cole<br />
Vesting<br />
date (2)(3)<br />
Awarded<br />
but not<br />
vested<br />
Vested in % of<br />
2009 total<br />
vested<br />
Fair value (4)(15) of VPR/PR for<br />
performance year<br />
Fair value of VPR pre peer<br />
group modification (5)<br />
performance year<br />
2009 2008 2007 2006 2005 2009 2008 2007<br />
March 2006 (6) March 2011 50,464 100 9.07<br />
March 2007 (7) March 2012 40,245 17.71<br />
March 2008 March 2012 33,160 32.67 22.64<br />
March 2008 (8) March 2011 81,606 32.67 31.30<br />
February 2009 (9) February 2013 39,179 27.58 29.78<br />
December 2009 March 2012 334 37.31<br />
December 2009 March 2012 275 31.26<br />
December 2009 March 2011 678 31.26<br />
December 2009 February 2013 325 26.37<br />
March 2010 (10) March 2014 27,425 29.34 22.40<br />
February 2009 February 2013 8,238 25.21 22.90<br />
December 2009 March 2012 17 29.95<br />
December 2009 February 2013 68 26.37<br />
March 2010 March 2014 6,017 29.34 22.40<br />
March 2006 March 2011 6,859 100 9.07<br />
March 2007 March 2012 11,034 17.71<br />
March 2008 March 2012 8,953 32.67 22.64<br />
February 2009 February 2013 14,185 27.58 29.78<br />
December 2009 March 2012 92 37.31<br />
December 2009 March 2012 74 31.26<br />
December 2009 February 2013 118 26.37<br />
March 2010 March 2014 10,330 29.34 22.40<br />
March 2007 March 2012 2,741 17.71<br />
March 2008 March 2012 4,862 32.67 22.64<br />
February 2009 February 2013 8,650 27.58 29.78<br />
December 2009 March 2012 23 37.31<br />
December 2009 March 2012 40 31.26<br />
December 2009 February 2013 72 26.37<br />
March 2010 March 2014 6,305 29.34 22.40<br />
L Della<br />
Martina (12)<br />
March 2006 (6) March 2011 2,743 100 9.07<br />
February 2009 February 2013 5,552 27.58 29.78<br />
December 2009 March 2012 29 37.31<br />
December 2009 March 2012 29 31.26<br />
December 2009 February 2013 46 26.37<br />
March 2010 March 2014 4,045 29.34 22.40<br />
B Donaghey (13) March 2010 March 2014 0 29.34 22.40<br />
E Howell (14)<br />
March 2007 March 2012 1,051 17.71<br />
March 2008 March 2012 3,954 32.67 22.64<br />
February 2009 February 2013 7,895 27.58 29.78<br />
December 2009 March 2012 9 37.31<br />
December 2009 March 2012 33 31.26<br />
December 2009 February 2013 66 26.37<br />
March 2010 March 2014 5,747 29.34 22.40<br />
March 2006 March 2011 6,554 100 9.07<br />
March 2007 March 2012 3,300 17.71<br />
March 2008 March 2012 7,035 32.67 22.64<br />
A Kantsler<br />
February 2009 February 2013<br />
December 2009 March 2012<br />
10,847<br />
27<br />
27.58<br />
37.31<br />
29.78<br />
December 2009 March 2012 58 31.26<br />
December 2009 February 2013 90 26.37<br />
March 2010 March 2014 7,901 29.34 22.40<br />
March 2006<br />
V Santostefano<br />
(14)<br />
(6) March 2011 3,047 100 9.07<br />
March 2007 March 2012 2,654 17.71<br />
March 2008 March 2012 3,465 32.67 22.64<br />
February 2009 February 2013 5,540 27.58 29.78<br />
December 2009 March 2012 22 37.31<br />
December 2009 March 2012 29 31.26<br />
December 2009 February 2013 46 26.37<br />
March 2010 March 2014 5,190 29.34 22.40<br />
.<br />
Governance<br />
57
58<br />
Table 12b - RTSR-tested and TSR-tested VPRs (1) (Footnotes)<br />
(1) For valuation purposes all VPRs are treated as if they will<br />
be equity settled, with the exception of Mr Ahmed's 2008<br />
VPRs which are to be settled in cash as a result of his<br />
international secondment fair value is recalculated at the<br />
end of every <strong>report</strong>ing period. In 2008 the fair value was<br />
$22.90.<br />
(2) Vesting date and exercise date are the same. Vesting is<br />
subject to satisfaction of vesting conditions.<br />
(3) Vesting date is from 13 March 2009 to 13 March 2011 in<br />
respect of 2006 allocations, from 15 March 2010 to 15<br />
March 2012 in respect of March 2007 allocations, on 14<br />
March 2011 or 14 March 2012 in respect of March 2008<br />
allocations, on 27 February 2012 or 27 February 2013 in<br />
respect of February 2009 allocations, and on 5 March<br />
2013 or 5 March 2014 in respect of March 2010<br />
allocations.<br />
(4) In accordance with the requirements of AASB 124<br />
Related Party Disclosures, the fair value of rights as at<br />
their date of grant has been determined by applying the<br />
Binomial or Black Scholes option pricing technique with<br />
the exception of Mr Ahmed as noted in (1). The fair value<br />
of rights is amortised over the vesting period, such that<br />
‘Total remuneration’ includes a portion of the fair value<br />
Table 12c – Time-tested PRs (1)<br />
of unvested equity compensation during the year. The<br />
amount included as remuneration is not related to or<br />
indicative of the benefit (if any) that individual executives<br />
may ultimately realise should these equity instruments<br />
vest.<br />
(5) Peer group modification impacted the fair values of RTSRtested<br />
VPRs only, performance years 2005 and 2006 are<br />
TSR-tested. The share price of <strong>Woodside</strong> Petroleum Ltd at<br />
the date of modification is $48.20.<br />
(6) Incorporates a TSR tested VPR allocation of $1,000,000<br />
in respect of the 2005 performance year, awarded in<br />
addition to the EIP entitlements.<br />
(7) Incorporates a VPR allocation of $900,000 in respect of<br />
the 2006 performance year, awarded in addition to the<br />
EIP entitlements.<br />
(8) Mr Voelte’s Accelerated LTIs.<br />
(9) This allocation represents the remaining 50% of<br />
Mr Voelte’s 2008 LTI VAR allocation (excludes the<br />
Accelerated LTI VARs).<br />
(10) This allocation represents the remaining 50% of<br />
Mr Voelte’s 2009 LTI VAR allocation (excludes the<br />
Accelerated LTI VARs).<br />
Name Allocation date Vesting Date Awarded but not<br />
vested<br />
F Ahmed<br />
M Chatterji<br />
R Cole<br />
L Della Martina<br />
B Donaghey<br />
E Howell<br />
A Kantsler<br />
V Santostefano<br />
November 2007<br />
December 2009 (3)<br />
March 2007<br />
(11) Mr Ahmed did not meet the definition of KMP under<br />
AASB 124 for the 2006 and 2007 years. Previous years<br />
comparative figures are not shown..<br />
(12) Mr Della Martina did not meet the definition of KMP<br />
under AASB 124 for previous years but did fall within the<br />
definition for 2008 and 2009. Previous year's comparative<br />
figures are not shown.<br />
(13) Ms Donaghey did not meet the definition of KMP<br />
under AASB 124 for years prior to 2009. Previous years<br />
comparative figures are not shown. A total of 4,208 TSR<br />
tested and 9,109 RTSR tested VPRs were forfeit on<br />
Ms Donaghey's departure on 31 October 2009.<br />
(14) Ms Howell and Mr Santostefano did not meet the<br />
definition of KMP under AASB 124 for the 2006 financial<br />
year but are considered KMP for 2007, 2008 and 2009.<br />
2006 comparative figures are not shown.<br />
(15) Prior years fair values have been appropriately restated to<br />
reflect the terms and conditions.<br />
Vested in 2009 Fair value of PR (5)(6)<br />
March 2009 2,031 51.41<br />
March 2010 (2) 2,030 30.38<br />
March 2011 (2) 2,030 28.68<br />
March 2010 17 35.49<br />
March 2011 17 30.54<br />
March 2009 8,756 34.21<br />
March 2010 8,756 33.22<br />
December 2009 (3) March 2010 73 46.89<br />
March 2007<br />
March 2009 4,004 34.21<br />
March 2010 4,004 33.22<br />
December 2009 (3) March 2010 33 46.89<br />
March 2007<br />
March 2009 3,725 34.21<br />
March 2010 3,725 33.22<br />
December 2009 (3) March 2010 31 46.89<br />
March 2007 March 2009 4,658 34.21<br />
March 2007 March 2010 4,656 (4)<br />
March 2007<br />
33.22<br />
March 2009 4,843 34.21<br />
March 2010 4,843 33.22<br />
December 2009 (3) March 2010 40 46.89<br />
March 2007<br />
March 2009 6,520 34.21<br />
March 2010 6,520 33.22<br />
December 2009 (3) March 2010 54 46.89<br />
March 2007<br />
March 2009 3,446 34.21<br />
March 2010 3,446 33.22<br />
December 2009 (3) March 2010 29 46.89<br />
(1) For valuation purposes all PRs are time tested and are treated as if they will be equity settled, with the exception of Mr Ahmed's PRs which are RTSR tested and are to be settled in cash, as a<br />
result of his international secondment. This fair value is recalculated at the end of every <strong>report</strong>ing period. In 2008 the fair value was 45.61.<br />
(2) Reflects the fair values of the PRs post peer group modification.<br />
(3 Additional allocation of VPRs to each tranche of granted VPRs, following renounceable equity rights issue by the company.<br />
(4) Ms Donaghey's third tranche of time tested pay rights (4,656) lapsed upon her departure on 31 October 2009.<br />
(5) In accordance with the requirements of AASB 124 Related Party Disclosures, the fair value of rights as at their date of grant has been determined by applying the Binomial or Black Scholes<br />
option pricing technique with the exception of Mr Ahmed as noted in (1). The fair value of rights is amortised over the vesting period, such that ‘Total remuneration’ includes a portion of the<br />
fair value of unvested equity compensation during the year. The amount included as remuneration is not related to or indicative of the benefit (if any) that individual executives may ultimately<br />
realise should these equity instruments vest.<br />
(6) Prior year fair values have been appropriately restated to reflect the terms and conditions.<br />
<strong>Woodside</strong> Petroleum Ltd | Annual Report 2009
Table 13 – Compensation of executives for the year ended 31 December 2009<br />
Short-term Post Share-based<br />
employment payments<br />
Cash salary and fees Cash bonuses Non monetary Pension super<br />
Executives Year Salaries, fees and Short-term<br />
allowances incentive<br />
bonus (2)<br />
Benefits and<br />
allowances (3)<br />
Company Share plan<br />
contributions to<br />
superannuation<br />
(4)(5) Termination / Total Performance<br />
benefits remuneration related<br />
$ $ $ $ $ $ $ %<br />
2009 2,694,276 3,009,825 92,045 0 2,547,193 8,343,339 67<br />
D Voelte,<br />
Managing Director and Chief Executive Officer<br />
2008 2,481,466 (1) 1,890,000 88,592 12,292 2,462,071 (6) 6,934,421 63<br />
2009 716,744 (7) 353,445 483,841 0 332,501 1,886,531 36<br />
2008 630,024 217,456 68,149 82,830 998,459 30<br />
F Ahmed,<br />
Executive Vice President Project Development<br />
2009 902,718 (8) 721,292 167,293 57,400 635,169 2,483,872 55<br />
2008 829,938 499,204 242,850 49,938 686,089 2,308,019 51<br />
M Chatterji,<br />
Executive Vice President and Chief Financial Officer<br />
2009 599,189 440,245 10,383 65,043 330,890 1,445,750 53<br />
2008 561,613 304,439 7,762 34,387 294,831 1,203,032 50<br />
R Cole,<br />
Executive Vice President Corporate Centre and Joint Company Secretary<br />
L Della Martina,<br />
2009 358,495 282,448 29,192 77,939 261,726 1,009,800 54<br />
Executive Vice President Pluto<br />
2008 344,135 195,396 38,142 12,752 257,658 848,083 53<br />
B Donaghey,<br />
Executive Vice President, Browse (10) 2009 327,808 0 8,627 72,576 (122,654) 126,819 413,176 NA<br />
2009 489,938 401,321 10,383 113,901 298,022 1,313,565 53<br />
2008 461,468 208,396 7,762 85,031 290,320 1,052,977 47<br />
E Howell,<br />
Executive Vice President North West Shelf<br />
2009 737,036 551,648 16,535 82,435 426,979 1,814,633 54<br />
2008 667,396 286,318 13,512 100,000 436,896 1,504,122 48<br />
A Kantsler,<br />
Executive Vice President Exploration, Health, Safety and Security (9)<br />
2009 400,205 362,397 10,854 79,969 263,900 1,117,325 56<br />
2008 374,173 194,975 8,233 12,722 243,136 833,239 53<br />
V Santostefano,<br />
Executive Vice President Production<br />
P Moore, Executive Vice President Emerging LNG 2008 290,640 126,737 4,783 53,831 137,037 1,015,577 1,628,605 16<br />
K Spence, Executive Vice President Emerging LNG 2008 325,629 148,413 2,614 72,357 434,267 983,280 22<br />
with the Superannuation Guarantee<br />
(Administration) Act 1992. The cash payment is<br />
subject to (PAYG) income tax and paid as part<br />
of their normal monthly salary. The amount is<br />
included in salaries, fees and allowances.<br />
(9) On 12 February 2009 Dr Kantsler was appointed<br />
to Executive Vice President, Health and Safety<br />
On 1 February 2010, Dr Kantsler’s title was<br />
changed to Executive Vice President, Health,<br />
Safety and Security.<br />
(10) On 18 May 2009 Ms Donaghey was appointed<br />
to KMP, and subsequently departed <strong>Woodside</strong><br />
on 31 October 2009. On departure remaining<br />
unvested VPRs lapsed.<br />
as described in the ‘CEO Variable Annual Reward’<br />
section above.<br />
(7) As a non-resident for Australian tax purposes<br />
Mr Ahmed has elected to receive a cash<br />
payment in lieu of all superannuation<br />
contributions, in accordance with the<br />
Superannuation Guarantee (Administration) Act<br />
1992. The cash payment is subject to (PAYG)<br />
income tax and paid as part of their normal<br />
monthly salary. The amount is included in<br />
salaries, fees and allowances.<br />
(8) As a non-resident for Australian tax purposes<br />
Mr Chatterji has elected to receive a cash<br />
payment in lieu of all superannuation<br />
contributions, from April 2009, in accordance<br />
‘Total remuneration’ includes a portion of the fair<br />
value of unvested equity compensation during<br />
the year. The amount included as remuneration<br />
is not related to or indicative of the benefit (if any)<br />
that individual executives may ultimately realise<br />
should these equity instruments vest.<br />
(5) Certain 2008 comparatives have been<br />
appropriately restated to reflect the revised fair<br />
values. The impact on total compensation of<br />
executives as <strong>report</strong>ed for the year ended<br />
31 December 2008 is an aggregate decrease<br />
of $268,441.<br />
(6) This incorporates VPRs comprising Mr Voelte’s<br />
2008 LTI VAR Balance and Accelerated LTI VPRs,<br />
(2) The amount represents the short-term incentive<br />
earned in the respective year, which is actually<br />
paid in the following year.<br />
(3) Reflects the value of allowances and benefits<br />
including but not limited to travel, motor vehicle<br />
and health insurance.<br />
(4) ‘Share plan’ incorporates all equity based<br />
plans. In accordance with the requirements<br />
of AASB 124 Related Party Disclosures, the<br />
fair value of rights as at their date of grant has<br />
been determined by applying the binomial<br />
valuation method combined with a Monte<br />
Carlo simulation. The fair value of rights is<br />
amortised over the vesting period, such that<br />
(1) Mr Voelte elected to receive the minimum<br />
contribution to superannuation and receive<br />
the balance paid as a superannuation-in-lieu<br />
allowance, from January 2008 to November<br />
2008. Subsequently, from December 2008,<br />
as a non Australian Tax Resident Mr Voelte<br />
elected to receive a cash payment in lieu of all<br />
superannuation contributions, in accordance with<br />
the Superannuation Guarantee (Administration)<br />
Act 1992. The cash payment is subject to Pay As<br />
You Go (PAYG) income tax and paid as part of his<br />
normal monthly salary. The amount is included in<br />
salaries, fees and allowances.<br />
Governance<br />
59
60<br />
Directors' <strong>report</strong> (continued)<br />
Indemnification and insurance of<br />
directors and officers<br />
The company’s constitution requires the<br />
company to indemnify each director,<br />
secretary, executive officer or employee<br />
of the company or its wholly owned<br />
subsidiaries against liabilities (to the<br />
extent the company is not precluded by<br />
law from doing so) incurred in or arising<br />
out of the conduct of the business of the<br />
company or the discharge of the duties<br />
of any such person. The company has<br />
entered into deeds of indemnity with each<br />
of its directors, secretaries, certain senior<br />
executives, and employees serving as<br />
officers on wholly owned or partly owned<br />
companies of <strong>Woodside</strong> in terms of the<br />
indemnity provided under the company’s<br />
constitution.<br />
From time to time, <strong>Woodside</strong> engages its<br />
external auditor, Ernst & Young, to conduct<br />
non-statutory audit work and provide other<br />
services in accordance with <strong>Woodside</strong>'s<br />
External Auditor Guidelines. The terms of<br />
engagement include an indemnity in favour<br />
of Ernst & Young:<br />
against all losses, claims, costs,<br />
expenses, actions, demands,<br />
damages, liabilities or any proceedings<br />
(liabilities) incurred by Ernst & Young<br />
in respect of third party claims arising<br />
from a breach by the Group under the<br />
engagement terms; and<br />
for all liabilities Ernst & Young has to<br />
the Group or any third party as a result<br />
of reliance on information provided by<br />
the Group that is false, misleading or<br />
incomplete.<br />
The company has paid a premium under<br />
a contract insuring each director, officer,<br />
secretary and employee who is concerned<br />
with the management of the company or<br />
its subsidiaries against liability incurred in<br />
that capacity. Disclosure of the nature of<br />
the liability covered by and the amount of<br />
the premium payable for such insurance<br />
is subject to a confidentiality clause under<br />
the contract of insurance. The company<br />
has not provided any insurance for the<br />
external auditor of the company or a body<br />
corporate related to the external auditor.<br />
Non-audit services and auditor<br />
independence declaration<br />
Details of the amounts paid or payable to<br />
the external auditor of the company, Ernst<br />
& Young, for audit and non-audit services<br />
provided during the year are disclosed in<br />
note 32 to the Financial Report.<br />
Based on advice provided by the Audit &<br />
Risk Committee, the directors are satisfied<br />
that the provision of non-audit services<br />
by the external auditor during the financial<br />
year is compatible with the general<br />
standard of independence for auditors<br />
imposed by the Corporations Act for the<br />
following reasons:<br />
all non-audit services were provided in<br />
accordance with <strong>Woodside</strong>’s External<br />
Auditor Policy and External Auditor<br />
Guidelines; and<br />
all non-audit services were subject to<br />
the corporate governance processes<br />
adopted by the company and have<br />
been reviewed by the Audit & Risk<br />
Committee to ensure that they do not<br />
affect the integrity or objectivity of the<br />
auditor.<br />
Further information on <strong>Woodside</strong>’s policy<br />
in relation to the provision of non-audit<br />
services by the auditor is set out in section<br />
7 of the Corporate Governance Statement<br />
on page 42.<br />
The auditor independence declaration,<br />
as required under section 307C of the<br />
Corporations Act, is set out on this page<br />
and forms part of this <strong>report</strong>.<br />
Proceedings on behalf of the company<br />
No proceedings have been brought<br />
on behalf of the company, nor has any<br />
application been made in respect of<br />
the company under section 237 of the<br />
Corporations Act.<br />
Rounding of amounts<br />
The amounts contained in this <strong>report</strong><br />
have been rounded to the nearest million<br />
dollars under the option available to the<br />
company under Australian Securities and<br />
Investments Commission Class Order<br />
98/0100 dated 10 July 1998.<br />
Table 14 - Directors’ relevant interests<br />
in <strong>Woodside</strong> shares as at date<br />
of <strong>report</strong>.<br />
Director Relevant interest<br />
in shares<br />
MA Chaney 20,000<br />
DR Voelte 133,663<br />
E Fraunschiel 81,930<br />
A Jamieson 3,000<br />
PJMH Jungels 9,205<br />
DI McEvoy 7,511<br />
D Megat 1,042<br />
MA Cilento -<br />
I Robertson -<br />
Signed in accordance with a resolution of<br />
the directors.<br />
Michael Chaney, AO<br />
Chairman<br />
24 February 2010<br />
Don Voelte<br />
Chief Executive Officer<br />
24 February 2010<br />
Auditor’s Independence<br />
Declaration<br />
In relation to our audit of the financial<br />
<strong>report</strong> of <strong>Woodside</strong> Petroleum Ltd for<br />
the year ended 31 December 2009, to<br />
the best of my knowledge and belief,<br />
there have been no contraventions of the<br />
auditor independence requirements of the<br />
Corporations Act 2001 or any applicable<br />
code of professional conduct.<br />
Ernst & Young<br />
G H Meyerowitz<br />
Partner<br />
Perth<br />
24 February 2010<br />
<strong>Woodside</strong> Petroleum Ltd | Annual Report 2009
2009 Financial Report<br />
Contents<br />
Income statement<br />
Statement of comprehensive income<br />
Statement of financial position<br />
Statement of cash flows<br />
Statement of changes in equity<br />
Notes to and forming part of the financial <strong>report</strong><br />
1. Summary of significant accounting policies 68<br />
2. Operating segments 80<br />
3. Revenue and expenses 83<br />
4. Taxes 85<br />
5. Earnings per share 88<br />
6. Dividends paid and proposed 88<br />
7. Cash and cash equivalents 89<br />
8. Receivables 90<br />
9. Inventories 90<br />
10. Other financial assets 90<br />
11. Other assets 91<br />
12. Exploration and evaluation assets 91<br />
13. Oil and gas properties 92<br />
14. Other plant and equipment 93<br />
15. Payables 93<br />
16. Interest-bearing liabilities 94<br />
17. Tax payable 94<br />
18. Other financial liabilities 94<br />
19. Other liabilities 94<br />
20. Provisions 95<br />
21. Contributed equity 95<br />
22. Other reserves 96<br />
23. Retained earnings 97<br />
24. Assets and liabilities of disposal group classified as<br />
held for sale<br />
97<br />
25. Financial and capital risk management 98<br />
26. Expenditure commitments 108<br />
27. Employee benefits 109<br />
28. Key management personnel compensation 118<br />
29. Events after the balance sheet date 122<br />
30. Related party disclosure 122<br />
31. Contingent liabilities 123<br />
32. Auditor remuneration 123<br />
33. Joint ventures 124<br />
34. Associated entities 125<br />
35. Subsidiaries 126<br />
36. Corporate information 128<br />
Directors’ declaration 129<br />
Independent audit <strong>report</strong> 130<br />
Shareholder information 131<br />
62<br />
63<br />
64<br />
65<br />
66<br />
68<br />
61
62<br />
Income statement<br />
For the year ended 31 December 2009<br />
Notes<br />
2009<br />
$m<br />
Consolidated Parent<br />
Revenue from sale of goods 3(a) 4,352 5,990 - -<br />
Cost of sales 3(b) (1,877) (1,969) - -<br />
Gross profit 2,475 4,021 - -<br />
Other income 3(c) 958 (222) 774 929<br />
Other expenses 3(d) (569) (501) (7) (6)<br />
Profit before tax and net finance costs 2,864 3,298 767 923<br />
Finance income 3(e) 7 9 61 7<br />
Finance costs 3(f) (23) (32) - (28)<br />
Profit before tax 2,848 3,275 828 902<br />
Taxes<br />
Income tax expense (938) (868) (15) 8<br />
Petroleum Resource Rent Tax (PRRT) expense (92) (621) - -<br />
Total taxes 4(a) (1,030) (1,489) (15) 8<br />
Profit after tax 1,818 1,786 813 910<br />
Profit/(loss) attributable to:<br />
Equity holders of the parent 1,824 1,786 813 910<br />
Minority interest (6) - - -<br />
Profit for the year 1,818 1,786 813 910<br />
Basic and diluted earnings per share attributable to the equity holders<br />
of the parent (cents)<br />
The accompanying notes form part of the Financial Report.<br />
2008<br />
$m<br />
5 259 260<br />
2009<br />
$m<br />
2008<br />
$m
2009<br />
$m<br />
Statement of<br />
comprehensive income<br />
For the year ended 31 December 2009<br />
Consolidated Parent<br />
Profit for the year 1,818 1,786 813 910<br />
Other comprehensive income<br />
Net foreign currency translation differences (272) 314 - -<br />
2008<br />
$m<br />
2009<br />
$m<br />
2008<br />
$m<br />
(272) 314 - -<br />
Net gain/(loss) on hedge of net investment 366 (350) - -<br />
Income tax (expense)/benefit (110) 107 - -<br />
Cash flow hedges:<br />
256 (243) - -<br />
Loss taken to equity (11) (11) - -<br />
Transferred to income statement (28) 220 - -<br />
Income tax benefit/(expense) 12 (64) - -<br />
(27) 145 - -<br />
Net change in fair value of available-for-sale financial assets 5 (19) - -<br />
Transferred realised gains to other income - (23) - -<br />
Income tax (expense)/benefit (5) 18 - -<br />
- (24) - -<br />
Other comprehensive (loss)/income for the year, net of tax (43) 192 - -<br />
Total comprehensive income for the year 1,775 1,978 813 910<br />
Total comprehensive income/(loss) attributable to:<br />
Equity holders of the parent 1,781 1,978 813 910<br />
Minority interest (6) - - -<br />
Total comprehensive income for the year 1,775 1,978 813 910<br />
The accompanying notes form part of the Financial Report.<br />
Financial Report<br />
63
64<br />
Statement of financial position<br />
As at 31 December 2009<br />
Notes<br />
2009<br />
$m<br />
Consolidated Parent<br />
Current assets<br />
Cash and cash equivalents 7 1,351 141 - -<br />
Receivables 8(a) 563 533 - -<br />
Inventories 9(a) 122 108 - -<br />
Other financial assets 10(a) - 44 - -<br />
Other assets 11(a) 73 19 - -<br />
Assets of disposal group classified as held for sale 24 587 - - -<br />
Non-current assets classified as held for sale 13 12 - - -<br />
Total current assets 2,708 845 - -<br />
Non-current assets<br />
Receivables 8(b) - - 4,878 2,675<br />
Inventories 9(b) 49 54 - -<br />
Other financial assets 10(b) 131 180 - -<br />
Other assets 11(b) 2 12 234 233<br />
Exploration and evaluation assets 12 1,298 1,172 - -<br />
Oil and gas properties 13 15,510 12,428 - -<br />
Other plant and equipment 14 92 111 - -<br />
Deferred tax assets 4(d) 84 127 10 -<br />
Total non-current assets 17,166 14,084 5,122 2,908<br />
Total assets 19,874 14,929 5,122 2,908<br />
Current liabilities<br />
Payables 15(a) 1,328 1,672 323 -<br />
Interest-bearing liabilities 16(a) - - - -<br />
Tax payable 17 222 542 122 445<br />
Other financial liabilities 18(a) 32 - - -<br />
Other liabilities 19(a) 18 22 - -<br />
Liabilities directly associated with assets of disposal group<br />
classified as held for sale<br />
24 41 - - -<br />
Provisions 20 127 127 - -<br />
Total current liabilities 1,768 2,363 445 445<br />
Non-current liabilities<br />
Payables 15(b) - - 208 178<br />
Interest-bearing liabilities 16(b) 5,529 2,957 - -<br />
Deferred tax liabilities 4(d) 1,488 1,110 - -<br />
Other financial liabilities 18(b) - 4 - -<br />
Other liabilities 19(b) 208 292 - -<br />
Provisions 20 505 1,271 - -<br />
Total non-current liabilities 7,730 5,634 208 178<br />
Total liabilities 9,498 7,997 653 623<br />
Net assets 10,376 6,932 4,469 2,285<br />
Equity<br />
Issued and fully paid shares 21(a) 4,163 2,104 4,163 2,104<br />
Shares reserved for employee share plans 21(b) (99) (142) (99) (142)<br />
Other reserves 22 61 53 84 41<br />
Retained earnings 23 5,740 4,690 321 282<br />
Equity attributable to equity holders of the parent 9,865 6,705 4,469 2,285<br />
Minority interest 511 227 - -<br />
Total equity 10,376 6,932 4,469 2,285<br />
The accompanying notes form part of the Financial Report.<br />
2008<br />
$m<br />
2009<br />
$m<br />
2008<br />
$m
Cash flows from/(used in) operating activities<br />
Notes<br />
2009<br />
$m<br />
Statement of cash flows<br />
For the year ended 31 December 2009<br />
Consolidated Parent<br />
Profit after tax for the year 1,818 1,786 813 910<br />
Adjustments for:<br />
Non-cash items<br />
Depreciation and amortisation 1,019 969 - -<br />
Impairment loss 119 132 - -<br />
Unrealised foreign exchange (gain)/loss (874) 543 - -<br />
Defined benefit superannuation plan net actuarial (gain)/loss (12) 39 - -<br />
Gain on sale of fixed assets (12) (19) - -<br />
Loss/(gain) on derivative financial instruments 69 (109) - -<br />
Net finance costs 16 23 (61) 21<br />
Dividend income - - (774) (929)<br />
Tax expense 1,030 1,489 15 (8)<br />
Other<br />
Changes in assets and liabilities<br />
11 45 1 -<br />
Increase in trade and other receivables (124) (9) - -<br />
Increase in inventories (23) (46) - -<br />
Increase in provisions 11 23 - -<br />
(Increase)/decrease in other assets and liabilities (9) 92 - -<br />
(Decrease)/increase in trade and other payables (27) 48 - -<br />
Cash generated from/(used in) operations 3,012 5,006 (6) (6)<br />
Amounts received from employees relating to employee share plans 55 30 54 30<br />
Purchases of shares relating to employee share plans (12) (35) (12) (35)<br />
Interest received 5 9 61 7<br />
Dividends received 5 5 774 929<br />
Interest paid (172) (46) - (29)<br />
Income tax paid (838) (1,009) (837) (994)<br />
Petroleum Resource Rent Tax paid (196) (176) - -<br />
Net cash from/(used in) operating activities 1,859 3,784 34 (98)<br />
Cash flows used in investing activities<br />
Payments for capital and exploration expenditure (6,022) (4,799) - -<br />
Proceeds from sale of/(payments for) investments in controlled entities - 102 (2) (5)<br />
Proceeds from sale of exploration and evaluation assets 22 32 - -<br />
Proceeds from sale of oil and gas properties 1 100 - -<br />
Payments for restorations (7) (3) - -<br />
Net cash used in investing activities (6,006) (4,568) (2) (5)<br />
Cash flows from/(used in) financing activities<br />
Proceeds from borrowings 3,771 1,060 - -<br />
Payment to cash reserve - (31) - -<br />
Proceeds from subsidiary shares issued to minority interest 290 152 - -<br />
Advances (to)/from controlled entities - - (1,325) 481<br />
Proceeds from rights issues 1,293 - 1,293 -<br />
Proceeds from underwriters of Dividend Reinvestment Plan (DRP) 368 254 - -<br />
Dividends paid (net of DRP) (368) (254) - -<br />
Dividends paid outside of DRP - (378) - (378)<br />
Net cash from/(used in) financing activities 5,354 803 (32) 103<br />
Net increase in cash held 1,207 19 - -<br />
Cash and cash equivalents at the beginning of the year 141 138 - -<br />
Effects of exchange rate changes on the balances of cash held in<br />
foreign currencies<br />
(2) (16) - -<br />
Cash and cash equivalents at the end of the year 7 1,346 141 - -<br />
The accompanying notes form part of the Financial Report.<br />
2008<br />
$m<br />
2009<br />
$m<br />
2008<br />
$m<br />
Financial Report<br />
65
66<br />
Statement of changes in equity<br />
For the year ended 31 December 2009<br />
Issued and<br />
fully paid<br />
shares<br />
(Note 21(a))<br />
Shares<br />
reserved for<br />
employee<br />
share plans<br />
(Note 21<br />
(b))<br />
Other<br />
reserves<br />
(Note 22)<br />
Retained<br />
earnings<br />
(Note 23)<br />
Equity<br />
holders of<br />
the parent<br />
Minority<br />
interest<br />
Consolidated $m $m $m $m $m $m $m<br />
Balance at 1 January 2008 1,553 (137) (155) 3,833 5,094 - 5,094<br />
Profit for the year - - - 1,786 1,786 - 1,786<br />
Other comprehensive income - - 192 - 192 - 192<br />
Total comprehensive income for the<br />
year<br />
Total<br />
equity<br />
- - 192 1,786 1,978 - 1,978<br />
Dividend Reinvestment Plan 551 - - - 551 - 551<br />
Shares issued - - - - - - -<br />
Disposal to minority interest - - - - - 227 227<br />
Employee share plan purchases - (38) - - (38) - (38)<br />
Employee share plan redemptions - 29 - - 29 - 29<br />
Dividends applied - 4 - - 4 - 4<br />
Share-based payments - - 16 - 16 - 16<br />
Dividends paid - - - (929) (929) - (929)<br />
Balance at 31 December 2008 2,104 (142) 53 4,690 6,705 227 6,932<br />
Balance at 1 January 2009 2,104 (142) 53 4,690 6,705 227 6,932<br />
Profit for the year - - - 1,824 1,824 (6) 1,818<br />
Other comprehensive income - - (43) - (43) - (43)<br />
Total comprehensive income for the<br />
year<br />
- - (43) 1,824 1,781 (6) 1,775<br />
Dividend Reinvestment Plan 774 - - - 774 - 774<br />
Shares issued 1,285 - - - 1,285 - 1,285<br />
Subsidiary shares issued to minority<br />
interest<br />
- - - - - 290 290<br />
Employee share plan purchases - (11) - - (11) - (11)<br />
Employee share plan redemptions - 51 - - 51 - 51<br />
Dividends applied - 3 - - 3 - 3<br />
Share-based payments - - 51 - 51 - 51<br />
Dividends paid - - - (774) (774) - (774)<br />
Balance at 31 December 2009 4,163 (99) 61 5,740 9,865 511 10,376<br />
The accompanying notes form part of the Financial Report.
Issued and<br />
fully paid<br />
shares<br />
(Note 21(a))<br />
Statement of changes in equity<br />
For the year ended 31 December 2009<br />
Shares<br />
reserved for<br />
employee<br />
share plans<br />
(Note 21(b))<br />
Other<br />
reserves<br />
(Note 22)<br />
Retained<br />
earnings<br />
(Note 23)<br />
Parent $m $m $m $m $m<br />
Total<br />
equity<br />
Balance at 1 January 2008 1,553 (137) 38 301 1,755<br />
Profit for the year - - - 910 910<br />
Other comprehensive income - - - - -<br />
Total comprehensive income for the year - - - 910 910<br />
Dividend Reinvestment Plan 551 - - - 551<br />
Shares issued - - - - -<br />
Employee share plan purchases - (38) - - (38)<br />
Employee share plan redemptions - 29 - - 29<br />
Dividends applied - 4 - - 4<br />
Share-based payments - - 3 - 3<br />
Dividends paid - - - (929) (929)<br />
Balance at 31 December 2008 2,104 (142) 41 282 2,285<br />
Balance at 1 January 2009 2,104 (142) 41 282 2,285<br />
Profit for the year - - - 813 813<br />
Other comprehensive income - - - - -<br />
Total comprehensive income for the year - - - 813 813<br />
Dividend Reinvestment Plan 774 - - - 774<br />
Shares issued 1,285 - - - 1,285<br />
Employee share plan purchases - (11) - - (11)<br />
Employee share plan redemptions - 51 - - 51<br />
Dividends applied - 3 - - 3<br />
Share-based payments - - 43 - 43<br />
Dividends paid - - - (774) (774)<br />
Balance at 31 December 2009 4,163 (99) 84 321 4,469<br />
The accompanying notes form part of the Financial Report.<br />
Financial Report<br />
67
68<br />
Notes to and forming part<br />
of the financial <strong>report</strong><br />
For the year ended 31 December 2009<br />
1. Summary of significant accounting policies<br />
(a) Basis of preparation<br />
The Financial Report is a general purpose financial <strong>report</strong>, which has been prepared in accordance with the requirements<br />
of the Corporations Act, Australian Accounting Standards and other authoritative pronouncements of the Australian<br />
Accounting Standards Board.<br />
The Financial Report has been prepared on a historical cost basis, except for derivative financial instruments and certain<br />
other financial assets, which have been measured at fair value.<br />
The Financial Report is presented in Australian dollars. The amounts contained in this <strong>report</strong> have been rounded to the<br />
nearest million dollars under the option available to the Group under Australian Securities and Investments Commission<br />
Class Order 98/0100 dated 10 July 1998, unless otherwise stated.<br />
The Financial Report was authorised for issue in accordance with a resolution of the directors on 24 February 2010.<br />
The nature of the operations and principal activities of the Group are described in the Directors' Report.<br />
Apart from changes in accounting policies noted below, the accounting policies adopted are consistent with those<br />
disclosed in the Annual Financial Report for the year ended 31 December 2008. Certain comparative information has been<br />
reclassified to be presented on a consistent basis with the current year's presentation.<br />
Changes in accounting policy and disclosure<br />
The adoption of new and amending Australian Accounting Standards and Interpretations mandatory for <strong>annual</strong> periods<br />
beginning on or after 1 January 2009 did not result in any significant changes to the accounting policies. The impact of<br />
new and amending Standards and Interpretations on the financial statements is as follows:<br />
• AASB 101 Presentation of Financial Statements (revised). The revised Standard separates owner and non-owner<br />
changes in equity and requires a statement of comprehensive income to be prepared which discloses all changes<br />
in equity during a period resulting from non-owner transactions. The Group has elected to present comprehensive<br />
income using the two statement approach;<br />
• AASB 8 Operating Segments. The Standard replaces AASB 114 Segment Reporting and requires a management<br />
approach to be used for segment <strong>report</strong>ing and also replaces the requirement to determine primary (business)<br />
and secondary (geographical) <strong>report</strong>ing segments of the Group. This approach identifies operating segments by<br />
reference to internal <strong>report</strong>s that are evaluated regularly by the chief operating decision maker in deciding how to<br />
allocate resources and in assessing performance. The Group concluded that the operating segments determined in<br />
accordance with AASB 8 are the same as the business segments <strong>report</strong>ed under AASB 114; and<br />
• AASB 7 Financial Instruments: Disclosure. The amended Standard requires disclosures about fair value<br />
measurement and liquidity risk. Fair value measurements related to all financial instruments recognised and<br />
measured at fair value are to be disclosed by source of inputs using a three level fair value hierarchy by class. The<br />
amendments also clarify the requirements for liquidity risk disclosures with respect to derivative transactions and<br />
assets used for liquidity management. The fair value measurement disclosures are presented in Note 25(h). The<br />
liquidity risk disclosures are not significantly impacted by the amendments and are presented in Note 25(c).<br />
(b) Statement of compliance<br />
The Financial Report complies with Australian Accounting Standards and International Financial Reporting Standards, as<br />
issued by the International Accounting Standards Board.<br />
(c) Basis of consolidation<br />
The consolidated financial statements comprise the financial statements of the Group as at 31 December each year.<br />
Subsidiaries are consolidated from the date on which control is transferred to the Group and cease to be consolidated<br />
from the date at which control is transferred out of the Group.<br />
At acquisition, the assets, liabilities and contingent liabilities of a subsidiary are measured at their fair values in accordance<br />
with the purchase method of accounting. Any excess of the cost of acquisition over the fair values of the identifiable net<br />
assets acquired is recognised as goodwill.<br />
The financial statements of subsidiaries are prepared for the same <strong>report</strong>ing period as the parent company, using<br />
consistent accounting policies. All intercompany balances and transactions, including unrealised profits and losses arising<br />
from intra-group transactions, have been eliminated in full.<br />
A change in ownership of a subsidiary that does not result in a loss of control is accounted for as an equity transaction.
1. Summary of significant accounting policies (continued)<br />
(c) Basis of consolidation (continued)<br />
Notes to and forming part<br />
of the financial <strong>report</strong><br />
For the year ended 31 December 2009<br />
Investments in subsidiaries are carried at cost less impairment charges in the separate financial statements of the parent<br />
company.<br />
Dividends received from subsidiaries are recorded as other income in the separate income statement of the parent<br />
company and do not impact the recorded cost of investment. The parent company will assess whether any indicators of<br />
impairment of the carrying amount of the investment in the subsidiary exist. Where such indicators exist, to the extent<br />
that the carrying amount of the investment exceeds its recoverable amount, an impairment loss is recognised.<br />
Minority interests are allocated their share of the net profit after tax in the consolidated income statement, their share of<br />
other comprehensive income, net of tax in the statement of comprehensive income and are presented within equity in<br />
the statement of financial position, separately from parent shareholders’ equity.<br />
(d) Revenue<br />
Revenue is recognised and measured at the fair value of consideration received or receivable to the extent that it is<br />
probable that the economic benefits will flow to the Group and the revenue can be reliably measured.<br />
Product revenue<br />
Revenue earned from the sale of oil, gas and condensate produced is recognised when the risks and rewards of<br />
ownership of the product are transferred to the customer. This policy is applied to the Group’s different operating<br />
arrangements as follows:<br />
• revenue earned under a lease or licence conferring ownership rights to production in which the Group has a working<br />
interest with other producers, is recognised in earnings on the basis of the Group’s interest in the relevant lease<br />
or licence (‘entitlements’ method). Revenue is not reduced for royalties and other taxes payable from production,<br />
except where royalties are payable ’in kind’;<br />
• revenue from ‘take or pay’ contracts is recognised in earnings when the product has been drawn by the customer<br />
or recorded as unearned revenue when not drawn by the customer;<br />
• revenue earned under a risk service contract is recognised when the Group has a legally enforceable entitlement to<br />
the proceeds; and<br />
• revenue earned under a production sharing contract is recognised on the basis of the Group’s share of oil, gas or<br />
condensate allocated to the contractor party or parties under the contract.<br />
Interest revenue<br />
Interest revenue is recognised as interest accrues, using the ‘effective interest’ method, which is the rate that exactly<br />
discounts estimated future cash receipts through the expected life of the financial instrument.<br />
Dividend revenue<br />
Dividend revenue is recognised when the right to receive payment is established.<br />
(e) Exploration and evaluation<br />
Expenditure on exploration and evaluation is accounted for in accordance with the ‘area of interest’ method. The Group’s<br />
application of the accounting policy for the cost of exploring and of evaluating discoveries is closely aligned to the US<br />
GAAP-based ‘successful efforts’ method.<br />
Exploration licence acquisition costs are capitalised and subject to half-yearly impairment testing.<br />
All exploration and evaluation expenditure, including general permit activity, geological and geophysical costs and new<br />
venture activity costs, is expensed as incurred except where:<br />
•<br />
•<br />
the expenditure relates to an exploration discovery that, at the <strong>report</strong>ing date, has not been recognised as an area<br />
of interest, as assessment of the existence or otherwise of economically recoverable reserves is not yet complete;<br />
or<br />
an area of interest is recognised, and it is expected that the expenditure will be recouped through successful<br />
exploitation of the area of interest, or alternatively, by its sale.<br />
Financial Report<br />
69
70<br />
Notes to and forming part<br />
of the financial <strong>report</strong><br />
For the year ended 31 December 2009<br />
1. Summary of significant accounting policies (continued)<br />
(e) Exploration and evaluation (continued)<br />
The costs of drilling exploration wells are initially capitalised pending the results of the well. Costs are expensed where<br />
the well does not result in the successful discovery of economically recoverable hydrocarbons and the recognition of an<br />
area of interest. Areas of interest are recognised at the field level. Subsequent to the recognition of an area of interest, all<br />
further evaluation costs relating to that area of interest are capitalised.<br />
Each potential or recognised area of interest is reviewed half-yearly to determine whether economic quantities of reserves<br />
have been found, or whether further exploration and evaluation work is underway or planned to support the continued<br />
carry forward of capitalised costs.<br />
Upon approval for the commercial development of an area of interest, accumulated expenditure for the area of interest is<br />
transferred to oil and gas properties.<br />
The recoverability of the carrying amount of the exploration and evaluation assets is dependent on successful<br />
development and commercial exploitation, or alternatively, sale of the respective areas of interest.<br />
Where a potential impairment is indicated, assessment is performed for each area of interest to which the exploration and<br />
evaluation expenditure is attributed. To the extent that capitalised expenditure is not expected to be recovered it is charged<br />
to the income statement.<br />
In the statement of cash flows, those cash flows associated with capitalised exploration and evaluation expenditure are<br />
classified as cash flows used in investing activities. Exploration and evaluation expenditure expensed is classified as cash<br />
flows used in operating activities.<br />
(f) Oil and gas properties<br />
Oil and gas properties are carried at cost and include construction, installation or completion of production and<br />
infrastructure facilities such as pipelines and platforms, capitalised borrowing costs, transferred exploration and<br />
evaluation assets, development wells, and the cost of dismantling and restoration.<br />
Subsequent capital costs, including major maintenance, are included in the asset’s carrying amount only when it is<br />
probable that future economic benefits associated with the item will flow to the Group and the cost of the item can be<br />
measured reliably. Otherwise costs are charged to the income statement during the financial period in which they are<br />
incurred.<br />
(g) Other plant and equipment<br />
Other plant and equipment is stated at cost less accumulated depreciation and any impairment in value.<br />
(h) Depreciation and amortisation<br />
Oil and gas properties and other plant and equipment are depreciated to their estimated residual values at rates based on<br />
their expected useful life. The major categories of assets are depreciated as follows:<br />
Category Method Estimated useful<br />
lives (years)<br />
Oil and gas properties<br />
Land Not depreciated -<br />
Buildings Straight line over useful life 40<br />
Transferred exploration and evaluation assets and<br />
offshore plant and equipment<br />
Units-of-production basis over proved plus<br />
probable reserves<br />
Onshore plant and equipment Straight line over the lesser of useful life and<br />
the life of proved plus probable reserves<br />
Marine vessels Straight line over useful life 10-40<br />
Other plant and equipment Straight line over useful life 5-15<br />
5-50<br />
5-50
1. Summary of significant accounting policies (continued)<br />
(i) Impairment of assets<br />
Notes to and forming part<br />
of the financial <strong>report</strong><br />
For the year ended 31 December 2009<br />
The carrying amounts of all assets, other than inventory, financial assets and deferred tax assets, are reviewed half-yearly<br />
to determine whether there is indication of an impairment loss. If any such indication exists, the asset’s recoverable<br />
amount is estimated.<br />
For any asset that does not generate largely independent cash flows, the recoverable amount is determined for the<br />
cash generating unit to which the asset belongs. If the carrying amount of an asset (or cash generating unit) exceeds its<br />
recoverable amount, the asset (or cash generating unit) is written down. Generally, the Group evaluates its oil and gas<br />
properties on a field-by-field basis.<br />
The recoverable amount of an asset is determined as the higher of its value in use and fair value less cost to sell. Value in use<br />
is determined by estimating future cash flows after taking into account the risks specific to the asset and discounting them<br />
to their present value using a pre-tax discount rate that reflects current market assessment of the time value of money.<br />
Where an impairment loss subsequently reverses, the carrying amount of the asset (or cash generating unit) is increased<br />
to the revised estimate of its recoverable amount, but only to the extent that the asset’s carrying amount does not exceed<br />
the carrying amount that would have been determined, net of depreciation or amortisation, if no impairment loss had been<br />
recognised.<br />
(j) Non-current assets and disposal groups held for sale and discontinued operations<br />
Non-current assets and disposal groups that are expected to be recovered primarily through a sale transaction rather than<br />
through continuing use, are classified as held for sale and measured at the lower of their carrying amount and fair value<br />
less cost to sell. They are not depreciated or amortised. To be classified as held for sale, an asset or disposal group must<br />
be available for immediate sale in its present condition and its sale must be highly probable.<br />
An impairment loss is recognised for any initial or subsequent write-down of the asset to its fair value less cost to<br />
sell. Impairment losses on initial classification as held for sale and subsequent gains or losses on remeasurement are<br />
recognised in the income statement. Gains are not recognised in excess of any cumulative impairment loss.<br />
(k) Derivative financial instruments and hedge accounting<br />
The Group uses derivative financial instruments such as swaps, options, futures and forward contracts to hedge its risks<br />
associated with commodity price, interest rate and foreign currency fluctuations.<br />
Derivatives are initially recognised at fair value on the date a derivative contract is entered into and are subsequently<br />
remeasured to their fair value in line with market fluctuations. The unrealised gain or loss on remeasurement is<br />
immediately recognised in the income statement, except where hedge accounting applies. The fair values of derivative<br />
financial instruments that are traded on an active market are based on quoted market prices at the balance sheet date.<br />
The fair values of financial instruments not traded on an active market are determined using a valuation technique based<br />
on cash flows discounted to present value using current market interest rates.<br />
Hedge accounting<br />
When a derivative is designated as a hedge for accounting purposes, the relationship between the derivative and the<br />
hedged item is documented, as is its risk management objective and strategy for undertaking the hedge transaction. Also<br />
documented is the assessment, both at hedge inception and on an ongoing basis, of whether the derivatives that are<br />
used in hedging transactions have been, and will continue to be, highly effective in offsetting changes in fair values or cash<br />
flows of hedged items.<br />
Financial Report<br />
71
72<br />
Notes to and forming part<br />
of the financial <strong>report</strong><br />
For the year ended 31 December 2009<br />
1. Summary of significant accounting policies (continued)<br />
(k) Derivative financial instruments and hedge accounting (continued)<br />
For the purposes of hedge accounting, hedges are classified and accounted for as follows:<br />
Hedge type and risk Accounting treatment<br />
Fair value hedge<br />
Exposure to changes in the fair value of<br />
a recognised asset, liability or committed<br />
transaction<br />
Cash flow hedge<br />
Exposure to variability in cash flows<br />
associated with a highly probable<br />
forecasted transaction or a committed<br />
foreign currency transaction<br />
Hedge of net investment<br />
Exposure to changes in the net assets of<br />
foreign operations from foreign exchange<br />
movements<br />
Changes in fair value of derivatives that are designated and qualify as fair<br />
value hedges are recorded in the income statement, together with any<br />
changes in the fair value of the hedged risk that are attributable to the<br />
asset, liability or committed transaction.<br />
The effective portion of changes in the fair value of derivatives is<br />
recognised in equity in the hedging reserve. The gain or loss relating to any<br />
ineffective portion is recognised in the income statement immediately.<br />
Amounts accumulated in equity are taken to the income statement in the<br />
periods when the hedged item affects income, for instance, when the<br />
forecast sale that is hedged takes place.<br />
The accounting treatment is substantially similar to a cash flow hedge.<br />
Hedge accounting is discontinued when the hedging instrument expires, no longer qualifies for hedge accounting or is<br />
terminated. At that point in time, any cumulative gain or loss on the hedging instrument recognised in equity remains in<br />
equity until the forecasted transaction occurs.<br />
If a hedged transaction is no longer expected to occur, the net cumulative gain or loss recognised in equity is transferred<br />
to the income statement for the year.<br />
Embedded derivatives<br />
Derivatives embedded in the Group’s contracts that change the nature of a host contract’s risk and are not clearly and<br />
closely related to the host contract, are initially recognised at fair value on the date the contract is entered into, with<br />
subsequent fair value movements <strong>report</strong>ed in the income statement.<br />
(l) Provision for restoration<br />
The Group records the present value of the estimated cost of legal and constructive obligations to restore operating<br />
locations in the period in which the obligation arises. The nature of restoration activities includes the removal of facilities,<br />
abandonment of wells and restoration of affected areas.<br />
A restoration provision is recognised and updated at different stages of the development and construction of a facility and<br />
then reviewed on an <strong>annual</strong> basis. When the liability is initially recorded, the estimated cost is capitalised by increasing<br />
the carrying amount of the related exploration and evaluation assets or oil and gas properties. Over time, the liability is<br />
increased for the change in the present value based on a pre-tax discount rate appropriate to the risks inherent in the<br />
liability. The unwinding of the discount is recorded as an accretion charge within finance costs. The carrying amount<br />
capitalised in oil and gas properties is depreciated over the useful life of the related asset (refer to Note 1(h)).<br />
Costs incurred that relate to an existing condition caused by past operations and do not have a future economic benefit<br />
are expensed.<br />
Changes in accounting estimates<br />
During the year, the Group re-evaluated its estimate of the costs to restore operating facilities, taking into account<br />
changes in the method of restoration. The change in estimate associated with the change in the method of restoration<br />
resulted in a decrease to the provision for restoration of $779 million and a decrease in the related assets of $779 million.
1. Summary of significant accounting policies (continued)<br />
(m) Joint ventures<br />
Notes to and forming part<br />
of the financial <strong>report</strong><br />
For the year ended 31 December 2009<br />
The Group’s interests in jointly controlled assets are accounted for by recognising its proportionate share in assets and<br />
liabilities from joint ventures, except where as operator <strong>Woodside</strong> takes on the role as independent contractor. In these<br />
instances, receivables and payables relating to jointly controlled operations are brought to account on a gross basis.<br />
Joint venture expenses and the Group’s entitlement to production are recognised on a pro rata basis according to the<br />
Group’s joint venture interest.<br />
Investments in jointly controlled entities, where the Group has significant influence, but not control, are accounted for<br />
using the equity method of accounting. Under the equity method, the cost of the investment is adjusted by the postacquisition<br />
changes in the Group's share of the net assets of the venture.<br />
(n) Borrowing costs<br />
Borrowing costs incurred for the acquisition or construction of qualifying assets are capitalised during the period of time<br />
that is required to complete and prepare the asset for its intended use or sale. Assets are considered to be qualifying<br />
assets when this period of time is substantial (greater than 12 months).<br />
The interest rate used to determine the amount of borrowing costs to be capitalised is the weighted average interest rate<br />
applicable to the Group’s outstanding borrowings during the period.<br />
(o) Foreign currency<br />
The functional currency and presentation currency of <strong>Woodside</strong> Petroleum Ltd and the majority of its Australian<br />
subsidiaries is Australian dollars (A$).<br />
Translation of foreign currency transactions<br />
Transactions in foreign currencies are initially recorded in the functional currency of the transacting entity at the exchange<br />
rates ruling at the date of transaction. Monetary assets and liabilities denominated in foreign currencies at the balance<br />
sheet date are translated at the rates of exchange ruling at that date. Exchange differences in the consolidated financial<br />
statements are taken to the income statement, with the exception of differences on foreign currency borrowings that<br />
provide an effective hedge against a net investment in subsidiaries with a functional currency other than Australian dollars.<br />
These are taken directly to the foreign currency translation reserve until the disposal of the net investment, at which time<br />
they are recognised in the income statement.<br />
Translation of the financial results of foreign operations<br />
Foreign subsidiaries and some Australian subsidiaries have a functional currency other than Australian dollars (usually US<br />
dollars) as a result of the economic environment in which they operate. As at the <strong>report</strong>ing date, the assets and liabilities<br />
of these subsidiaries are translated into the presentation currency of the Group at the rate of exchange ruling at the<br />
balance sheet date. The income statements are translated at the average exchange rates for the <strong>report</strong>ing period, or at the<br />
exchange rates ruling at the date of the transactions. Exchange differences arising on translation are taken to the foreign<br />
currency translation reserve.<br />
On disposal of a subsidiary with a functional currency other than Australian dollars, the deferred cumulative amount<br />
recognised in the foreign currency translation reserve relating to that particular subsidiary is recognised in the income<br />
statement.<br />
Hedge transactions<br />
Derivatives and other financial instruments are used to hedge foreign exchange risk relating to certain transactions (refer<br />
to Note 1(k)).<br />
(p) Leases<br />
The determination of whether an arrangement is or contains a lease, is based on the substance of the arrangement and<br />
requires an assessment of whether the fulfilment of the arrangement is dependent on the use of a specific asset or<br />
assets and the arrangement conveys a right to use the asset.<br />
Assets held under leases that transfer to the Group substantially all the risks and rewards of ownership of the leased<br />
asset, are classified as finance leases. Finance leases are capitalised at the inception of the lease, at the lower of the fair<br />
value of the leased asset and the present value of the minimum lease payments.<br />
Financial Report<br />
73
74<br />
Notes to and forming part<br />
of the financial <strong>report</strong><br />
For the year ended 31 December 2009<br />
1. Summary of significant accounting policies (continued)<br />
(p) Leases (continued)<br />
Lease payments are apportioned between the finance charges and reduction of the lease liability so as to achieve a<br />
constant rate of interest on the remaining balance of the liability. Finance charges are recognised in the income statement<br />
over the lease term.<br />
Capitalised leased assets are depreciated over the shorter of the estimated useful life of the asset and the lease term.<br />
Operating lease assets are not capitalised and payments are recognised in the income statement as an expense over<br />
the lease term. Lease incentives received are recognised in the income statement as an integral part of the total lease<br />
expense.<br />
(q) Cash and cash equivalents<br />
Cash and cash equivalents in the statement of financial position comprise cash at bank and short-term deposits with an<br />
original maturity of three months or less. Cash and cash equivalents are stated at face value in the statement of financial<br />
position.<br />
For the purposes of the statement of cash flows, cash and cash equivalents are <strong>report</strong>ed net of outstanding bank<br />
overdrafts.<br />
(r) Trade and other receivables<br />
Trade and other receivables, including receivables from related parties, are initially recognised at fair value and<br />
subsequently measured at amortised cost less an allowance for uncollectable amounts. Collectability and impairment are<br />
assessed on a regular basis. Subsequent recoveries of amounts previously written off are credited against other expenses<br />
in the income statement.<br />
(s) Inventories<br />
Inventories include hydrocarbon stocks, consumable supplies and maintenance spares. Inventories are valued at the<br />
lower of cost and net realisable value. Cost is determined on a weighted average basis and includes direct costs and an<br />
appropriate portion of fixed and variable production overheads where applicable. Inventories determined to be obsolete or<br />
damaged are written down to net realisable value.<br />
(t) Investments<br />
Investments are classified as either available-for-sale or held for trading, and are initially recognised at fair value plus, in the<br />
case of investments not held for trading, any directly attributable transaction costs.<br />
After initial recognition, investments are remeasured to fair value. Changes in the fair value of available-for-sale<br />
investments are recognised as a separate component of equity until the investment is sold, collected or otherwise<br />
disposed of, or until the investment is determined to be impaired, at which time the cumulative change in fair value<br />
previously <strong>report</strong>ed in equity is included in earnings. Changes in the fair value of held for trading investments are<br />
recognised in the income statement.<br />
For investments that are actively traded in organised financial markets, fair value is determined by reference to stock<br />
exchange quoted market bid prices at the close of business on the balance sheet date. Where investments are not<br />
actively traded, fair value is established by using other market accepted valuation techniques.<br />
(u) Investments in associates<br />
The Group’s investments in its associates are accounted for using the equity method of accounting in the consolidated<br />
financial statements. An associate is an entity in which the Group has significant influence and is neither a subsidiary nor<br />
a joint venture.<br />
The financial statements of associates, prepared for the same <strong>report</strong>ing period as the Group and applying consistent<br />
accounting policies, are used by the Group to apply the equity method. The investment in the associate is carried in the<br />
consolidated statement of financial position at cost plus post-acquisition changes in the Group’s share of net assets of<br />
the associate, less any impairment in value. The income statement reflects the Group’s share of the associate’s after tax<br />
profit or loss from operations.<br />
Where there has been a change recognised directly in the associate’s equity, the Group recognises its share of any<br />
changes and discloses this, when applicable, in the consolidated statement of changes in equity.
1. Summary of significant accounting policies (continued)<br />
(v) Employee provisions<br />
Notes to and forming part<br />
of the financial <strong>report</strong><br />
For the year ended 31 December 2009<br />
Provision is made for employee benefits accumulated as a result of employees rendering services up to the end of the<br />
<strong>report</strong>ing period. These benefits include wages and salaries, <strong>annual</strong> leave and long service leave.<br />
Liabilities in respect of employee services rendered that are not due to be settled within one year are recognised in the<br />
statement of financial position and measured at the present value of the estimated future cash outflow to be made to the<br />
employee using the projected unit credit method. In determining the present value of future cash outflows, consideration<br />
is given to expected future wage and salary levels, experience of employee departures, and periods of service. Expected<br />
future payments are discounted using appropriate discount rates. Liabilities expected to be settled within twelve months<br />
of the <strong>report</strong>ing date are measured at the amount expected to be paid.<br />
(w) Share-based payments<br />
Equity-settled transactions<br />
The Group provides benefits to its employees (including key management personnel) in the form of share-based<br />
payments, whereby employees render services for shares (equity-settled transactions). The cost of equity-settled<br />
transactions with employees is measured by reference to the fair value of the equity instruments at the date at which they<br />
are granted. The fair value is determined by using a Binomial or Black-Scholes option pricing technique combined with a<br />
Monte Carlo simulation methodology, where relevant. The cost of equity-settled transactions is recognised, together with<br />
a corresponding increase in equity, over the period in which the vesting conditions are fulfilled (the vesting period), ending<br />
on the date on which the relevant employees become fully entitled to the award (the vesting date).<br />
At each subsequent <strong>report</strong>ing date until vesting, the cumulative charge to the income statement is the result of:<br />
• the grant date fair value of the award;<br />
• the current best estimate of the number of awards that will vest, taking into account the likelihood of employee<br />
turnover; and<br />
• the expired portion of the vesting period.<br />
The charge to the income statement for the year is the cumulative amount as calculated above less the amounts charged<br />
in the previous years. There is a corresponding entry to equity.<br />
Until an award has vested, any amounts recorded are contingent and will be adjusted if more or fewer awards vest than<br />
were originally anticipated.<br />
An additional expense is recognised for any modification that increases the total fair value of the share-based payment<br />
arrangement, or is otherwise beneficial to the employee, as measured at the date of modification.<br />
If an equity-settled award is cancelled, it is treated as if it had vested on the date of cancellation, and any expense not yet<br />
recognised for the award is recognised immediately.<br />
Shares in the Group reacquired on-market are classified and disclosed as reserved shares and deducted from equity. No<br />
gain or loss is recognised in the income statement on the purchase, sale, issue or cancellation of the Group's own equity<br />
instruments.<br />
Cash-settled transactions<br />
The Group provides benefits to employees who have been on international assignment or secondment at any time during<br />
the vesting period in the form of cash-settled share-based payments. Employees render services in exchange for cash<br />
amounts which are determined by reference to the price of the shares of <strong>Woodside</strong> Petroleum Ltd.<br />
The ultimate cost of these cash-settled share-based payments will be equal to the actual cash paid to the employees<br />
which will be the fair value at settlement date. The cumulative cost recognised until settlement is held as a liability. All<br />
changes in the liability are recognised in the income statement for the year.<br />
The fair value of the liability is determined, initially and at each <strong>report</strong>ing date until it is settled, by using a Binomial or Black-<br />
Scholes option pricing technique combined with a Monte Carlo simulation methodology, where relevant.<br />
Financial Report<br />
75
76<br />
Notes to and forming part<br />
of the financial <strong>report</strong><br />
For the year ended 31 December 2009<br />
1. Summary of significant accounting policies (continued)<br />
(x) Retirement benefits<br />
All employees of the Group’s Australian entities are entitled to benefits under the Group’s superannuation plan due to<br />
retirement, disability or death. The Group has a defined benefit component and a defined contribution component within<br />
the plan. The defined benefit section of the plan is closed to new members.<br />
The defined benefit component provides defined lump sum benefits based on years of service and final average salary.<br />
The cost of providing benefits under the defined benefit plan is determined using the projected unit credit actuarial<br />
valuation method. A liability or asset in respect of the defined benefit component of the superannuation plan is recognised<br />
in the statement of financial position and is measured at the present value of the defined benefit obligation at the<br />
<strong>report</strong>ing date less the fair value of the superannuation fund’s assets at that date. The defined benefit obligation includes<br />
actuarial estimates of future variables such as employee turnover and the plan’s rate of return.<br />
The cost of the defined benefit component is charged to the income statement systematically over the employee’s<br />
service life.<br />
Gains and losses arising from changes in actuarial estimates are recognised immediately as income or expense in the<br />
income statement.<br />
The defined contribution component receives fixed contributions from Group companies and the Group’s legal or<br />
constructive obligation is limited to these contributions. Contributions to the defined contribution fund are recognised as<br />
an expense as incurred.<br />
(y) Financial liabilities<br />
Borrowings are initially recognised at fair value less transaction costs. Borrowings are subsequently carried at amortised<br />
cost, except for those designated in a fair value hedge relationship as described previously. Any difference between the<br />
proceeds received and the redemption amount is recognised in the income statement over the period of the borrowings<br />
using the effective interest method.<br />
Trade and other payables are carried at amortised cost when goods and services are received, whether or not billed to the<br />
Group.<br />
Dividends payable are recognised when declared by the Group.<br />
(z) Tax<br />
Income tax<br />
Income tax expense on the profit or loss for the year comprises current and deferred tax expense.<br />
Current tax expense is the expected tax payable on the taxable income for the year and any adjustment to tax payable in<br />
respect of previous years.<br />
Temporary differences arise between the tax bases of assets and liabilities and their carrying amounts in the financial<br />
statements. Deferred tax expense is determined based on changes in temporary differences.<br />
Deferred tax liabilities are recognised for taxable temporary differences. Deferred tax assets are recognised for deductible<br />
temporary differences, unused tax losses and unused tax credits only if it is probable that sufficient future taxable<br />
income will be available to utilise those temporary differences and losses. Such deferred tax liabilities and assets are<br />
not recognised if the temporary difference arises from goodwill or from the initial recognition (other than in a business<br />
combination) of other assets and liabilities in a transaction that affects neither the taxable profit nor the accounting profit<br />
or from investments in subsidiaries and associates and interests in joint ventures, to the extent that the Group is able to<br />
control the reversal of the temporary difference and the temporary difference is not expected to reverse in the foreseeable<br />
future.<br />
The carrying amount of deferred tax assets is reviewed at the end of each <strong>report</strong>ing period and reduced to the extent that<br />
it is no longer probable that sufficient taxable profits will be available to allow all or part of the asset to be recovered.<br />
Deferred tax assets and liabilities are measured at the tax rates that are expected to apply in the period in which the<br />
liability is settled or the asset is realised, based on tax rates (and tax laws) that have been enacted or substantially enacted<br />
by the end of the <strong>report</strong>ing period.<br />
Deferred tax assets and liabilities are offset when there is a legally enforceable right to set off current tax assets against<br />
current tax liabilities and when they relate to income taxes levied by the same taxation authority and the Group intends to<br />
settle its current tax assets and liabilities on a net basis.<br />
Current and deferred tax expenses are recognised in the income statement, except to the extent that they relate to items<br />
recognised directly in equity, in which case they are recognised in equity.
1. Summary of significant accounting policies (continued)<br />
(z) Tax (continued)<br />
Tax consolidation<br />
Notes to and forming part<br />
of the financial <strong>report</strong><br />
For the year ended 31 December 2009<br />
The parent and its wholly owned Australian controlled entities have elected to enter into tax consolidation, with <strong>Woodside</strong><br />
Petroleum Ltd as the head entity of the tax consolidated group.<br />
The tax expense/income, deferred tax liabilities and deferred tax assets arising from temporary differences of the<br />
members of the tax consolidated group are recognised in the separate financial statements of the members of the tax<br />
consolidated group, using the ‘stand alone’ approach.<br />
Petroleum Resource Rent Tax (PRRT)<br />
PRRT is considered, for accounting purposes, to be a tax based on income. Accordingly, current and deferred PRRT<br />
expense is measured and disclosed on the same basis as income tax.<br />
(aa) Goods and Services Tax (GST)<br />
Revenue, expenses and assets are recognised net of GST except where the GST incurred on a purchase of goods<br />
and services is not recoverable from the taxation authority, in which case the GST is recognised as part of the cost of<br />
acquisition of the asset or as part of the expense item.<br />
The net amount of GST recoverable from or payable to the taxation authority is included as part of receivables or payables<br />
in the statement of financial position.<br />
Cash flows are included in the statement of cash flows on a gross basis and the GST component of cash flows arising<br />
from investing and financing activities that is recoverable from, or payable to the taxation authority is classified as an<br />
operating cash flow.<br />
(ab) Royalties and excise duty<br />
Royalties and excise duty under existing regimes are considered to be production-based taxes and are therefore accrued<br />
on the basis of the Group’s entitlement to physical production.<br />
(ac) Issued capital<br />
Ordinary share capital is classified as equity and recorded at the value of consideration received. The costs of issuing<br />
shares are charged against share capital.<br />
(ad) Critical accounting estimates, assumptions and judgements<br />
In applying the Group’s accounting policies, management continually evaluates judgements, estimates and assumptions<br />
based on experience and other factors, including expectations of future events that may have an impact on the Group.<br />
All judgements, estimates and assumptions made are believed to be reasonable based on the most current set of<br />
circumstances available to management. Actual results may differ from those judgements, estimates and assumptions.<br />
Significant judgements, estimates and assumptions made by management in the preparation of these financial<br />
statements are outlined below.<br />
(i) Critical accounting estimates and assumptions<br />
(1) Impairment of assets<br />
In determining the recoverable amount of assets, in the absence of quoted market prices, estimates are<br />
made regarding the present value of future cash flows. For oil and gas properties, expected future cash flow<br />
estimation is based on reserves, future production profiles, commodity prices and costs.<br />
(2) Restoration obligations<br />
The Group estimates the future removal costs of offshore oil and gas platforms, production facilities,<br />
wells and pipelines at different stages of the development and construction of assets or facilities. In most<br />
instances, removal of assets occurs many years into the future. This requires judgemental assumptions<br />
regarding removal date, future environmental legislation, the extent of reclamation activities required, the<br />
engineering methodology for estimating cost, future removal technologies in determining the removal cost,<br />
and liability specific discount rates to determine the present value of these cash flows. For more detail<br />
regarding the policy in respect of provision for restoration refer to Note 1(l).<br />
Financial Report<br />
77
78<br />
Notes to and forming part<br />
of the financial <strong>report</strong><br />
For the year ended 31 December 2009<br />
1. Summary of significant accounting policies (continued)<br />
(ad) Critical accounting estimates, assumptions and judgements (continued)<br />
(3) Reserve estimates<br />
Estimation of <strong>report</strong>ed recoverable quantities of proven and probable reserves include judgemental<br />
assumptions regarding commodity prices, exchange rates, discount rates, and production and transportation<br />
costs for future cash flows. It also requires interpretation of complex geological and geophysical models<br />
in order to make an assessment of the size, shape, depth and quality of reservoirs, and their anticipated<br />
recoveries. The economic, geological and technical factors used to estimate reserves may change from<br />
period to period.<br />
Changes in <strong>report</strong>ed reserves can impact asset carrying values, the provision for restoration and the<br />
recognition of deferred tax assets due to changes in expected future cash flows. Reserves are integral to the<br />
amount of depreciation, amortisation and impairment charged to the income statement. Reserve estimates<br />
are prepared in accordance with <strong>Woodside</strong>’s Hydrocarbon Resource Inventory Management Process and<br />
guidelines prepared by the Society of Petroleum Engineers.<br />
(ii) Critical judgements in applying the Group’s accounting policies<br />
(1) Exploration and evaluation<br />
The Group’s accounting policy for exploration and evaluation assets is set out in Note 1(e). The application<br />
of this policy requires management to make certain estimates and assumptions as to future events and<br />
circumstances, in particular, the assessment of whether economic quantities of reserves have been found.<br />
Any such estimates and assumptions may change as new information becomes available. If, after having<br />
capitalised expenditure under the policy, the Group concludes that it is unlikely to recover the expenditure by<br />
future exploitation or sale, then the relevant capitalised amount will be written off to the income statement.<br />
(2) United States of America deferred tax asset<br />
The Group has recognised a net deferred tax asset in respect of tax losses and temporary differences<br />
associated with its operations in the United States of America. In accordance with the recognition criteria<br />
outlined in AASB 112 Income Taxes, the Group has exercised its judgement in deciding that it is probable that<br />
sufficient future taxable income will be available to utilise the deferred tax assets.
1. Summary of significant accounting policies (continued)<br />
Notes to and forming part<br />
of the financial <strong>report</strong><br />
For the year ended 31 December 2009<br />
(ae) New Accounting Standards issued but not yet effective<br />
The following new Standards have a potential impact on the Financial Report but have an effective date after the financial<br />
<strong>report</strong>ing date.<br />
Title Application date<br />
of the standard<br />
AASB 3 Business Combinations (revised<br />
2008), AASB 127 Consolidated and<br />
Separate Financial Statements (revised<br />
2008) and AASB 2008-3 Amendments to<br />
Australian Accounting Standards arising<br />
from AASB 3 and AASB 127<br />
Summary<br />
1 July 2009 AASB 3 (revised) and AASB 127 (revised) are the result<br />
of the joint IASB-FASB Business Combinations Phase II<br />
project. These Standards alter the manner in which business<br />
combinations and changes in ownership interests in<br />
subsidiaries are accounted for. Consequential amendments<br />
to other Standards are made through AASB 2008-3. Changes<br />
to the Standards apply prospectively.<br />
AASB 9 Financial Instruments 1 January 2013 AASB 9 includes requirements for the classification and<br />
measurement of financial assets resulting from the first part<br />
of Phase I of the IASB's project to replace IAS 39 Financial<br />
Instruments: Recognition and Measurement (AASB 139<br />
Financial Instruments: Recognition and Measurement).<br />
These requirements improve and simplify the approach for<br />
classification and measurement of financial assets.<br />
AASB 2008-6 Further Amendments to<br />
Australian Accounting Standards arising<br />
from the Annual Improvements Process<br />
AASB 2008-8 Amendments to Australian<br />
Accounting Standards - Eligible Hedged<br />
Items (AASB 139)<br />
AASB 2009-4 Amendments to Australian<br />
Accounting Standards arising from the<br />
Annual Improvements Project<br />
AASB 2009-5 Further Amendments to<br />
Australian Accounting Standards arising<br />
from the Annual Improvements Project<br />
AASB 2009-7 Amendments to Australian<br />
Accounting Standards (AASB 5, 7, 107, 112,<br />
136, 139 and Interpretation 17)<br />
AASB 2009-8 Amendments to Australian<br />
Accounting Standards - Group Cash-settled<br />
Share-based Payment Transactions<br />
1 July 2009 This Standard is the result of the IASB’s first Annual<br />
Improvements Project. It makes amendments to several<br />
Accounting Standards which may result in changes for<br />
presentation, recognition or measurement.<br />
1 July 2009 This Standard makes amendments to AASB 139 Financial<br />
Instruments: Recognition and Measurement. The<br />
amendments to AASB 139 clarify the accounting for and the<br />
application of the principles that determine whether a hedged<br />
risk or portion of cash flows is eligible for designation as a<br />
hedged item.<br />
1 July 2009 This Standard makes amendments to AASB 2 Sharebased<br />
Payment, AASB 138 Intangible Assets and AASB<br />
Interpretations 9 Reassessment of Embedded Derivatives<br />
and 16 Hedges of a Net Investment in a Foreign Operation.<br />
These amendments are a consequence of the <strong>annual</strong><br />
improvements project.<br />
1 January 2010 This Standard makes amendments to several Australian<br />
Accounting Standards. The amendments to some Standards<br />
result in accounting changes for presentation, recognition<br />
or measurement purposes, while some amendments are<br />
related to terminology and editorial changes.<br />
1 July 2009 This Standard clarifies the amendments to several Australian<br />
Accounting Standards. The amendments arise from editorial<br />
corrections by the AASB and IASB.<br />
1 January 2010 AASB 2009-8 clarifies the accounting for group cashsettled<br />
share-based payment transactions in the separate<br />
or individual financial statements of the entity receiving the<br />
goods or services when the entity has no obligation to settle<br />
the share-based payment transaction.<br />
The potential effect of these Standards is yet to be fully determined. However, it is not expected that the new Standards<br />
will significantly affect the Group’s financial position.<br />
Financial Report<br />
79
80<br />
Notes to and forming part<br />
of the financial <strong>report</strong><br />
For the year ended 31 December 2009<br />
2. Operating segments<br />
The Group has identified its operating segments based on the internal <strong>report</strong>s that are reviewed and used by the executive<br />
management team (the chief operating decision makers) in assessing performance and in determining the allocation of<br />
resources. The following operating segments are identified by management based on the nature and geographical location of<br />
the business or venture.<br />
North West Shelf Business Unit<br />
Exploration, evaluation, development, production and sales of Liquefied Natural Gas, pipeline natural gas, condensate, Liquefied<br />
Petroleum Gas and crude oil from the North West Shelf ventures.<br />
Australia Business Unit<br />
Exploration, evaluation, development, production and sale of crude oil, condensate, Liquefied Petroleum Gas and pipeline natural<br />
gas in assigned permit areas including Laminaria, Mutineer–Exeter, Enfield, Vincent, Otway, and Stybarrow ventures.<br />
Pluto Business Unit<br />
Exploration, evaluation and development of Liquefied Natural Gas in assigned permit areas.<br />
United States Business Unit<br />
Exploration, evaluation, development, production and sale of pipeline natural gas, condensate and crude oil in assigned permit<br />
areas.<br />
Other<br />
This segment comprises the activities undertaken by all other Business Units.<br />
No operating segments have been aggregated to form the above <strong>report</strong>able operating segments.<br />
Performance monitoring and evaluation<br />
Management monitors the operating results of the Business Units separately for the purpose of making decisions about<br />
resource allocation and performance assessment. The performance of operating segments is evaluated based on profit before<br />
tax and net finance costs (profit before tax and interest) and is measured in accordance with the Group’s accounting policies.<br />
Financing requirements, finance income, finance costs and taxes are managed at a Group level. Unallocated items comprise<br />
non-segmental items of revenue and expenses and associated assets and liabilities not allocated to operating segments as they<br />
are not considered part of the core operations of any segment.
2. Operating segments (continued)<br />
(a) Revenue and profit after tax for the year ended 31 December 2009<br />
Other Unallocated items Consolidated<br />
United States<br />
Business Unit<br />
Pluto<br />
Business Unit<br />
Australia<br />
Business Unit<br />
North West Shelf<br />
Business Unit<br />
2008<br />
$m<br />
2009<br />
$m<br />
2008<br />
$m<br />
2009<br />
$m<br />
2008<br />
$m<br />
2009<br />
$m<br />
2008<br />
$m<br />
2009<br />
$m<br />
2008<br />
$m<br />
2009<br />
$m<br />
2008<br />
$m<br />
2009<br />
$m<br />
2008<br />
$m<br />
2009<br />
$m<br />
Revenue<br />
Revenue from external customers 2,493 3,102 1,633 2,586 - - 156 237 70 65 - - 4,352 5,990<br />
Cost of sales<br />
Cost of production (547) (697) (275) (269) (1) - (22) (23) (8) (8) 2 (13) (851) (1,010)<br />
Shipping and direct sales costs (54) (73) (1) (8) (4) (4) (13) (10) - - (5) (3) (77) (98)<br />
Oil and gas properties depreciation and<br />
(206) (226) (595) (507) 8 (8) (114) (87) (38) (33) (4) - (949) (861)<br />
amortisation<br />
Total cost of sales (807) (996) (871) (784) 3 (12) (149) (120) (46) (41) (7) (16) (1,877) (1,969)<br />
Gross profit 1,686 2,106 762 1,802 3 (12) 7 117 24 24 (7) (16) 2,475 4,021<br />
Exploration and evaluation (7) (5) (15) (40) (71) (23) (116) (110) (109) (168) (2) (2) (320) (348)<br />
Share of profits of associates 4 6 - - - - - - - - - - 4 6<br />
Change in fair value of embedded derivative (4) 10 - - - - - - - - - - (4) 10<br />
Gain/(loss) on derivative financial instruments - - (34) 60 - - - - - - (31) 39 (65) 99<br />
Depreciation of other plant and equipment - - - - - - (3) (3) (1) (2) (13) (18) (17) (23)<br />
Defined benefit superannuation plan net<br />
- - - - - - - - - - 12 (39) 12 (39)<br />
actuarial gain/(loss)<br />
Exchange gain/(loss) – other 22 (14) (8) 60 23 (7) - - 4 (6) 850 (268) 891 (235)<br />
Notes to and forming part<br />
of the financial <strong>report</strong><br />
For the year ended 31 December 2009<br />
Impairment loss - - (7) - - - (21) (132) (91) - - - (119) (132)<br />
Other income 27 11 - 13 (4) 15 (2) (12) 22 19 8 72 51 118<br />
Other expense (6) (20) - (12) - - (28) (22) (11) (2) 1 (123) (44) (179)<br />
Profit before tax and net finance costs 1,722 2,094 698 1,883 (49) (27) (163) (162) (162) (135) 818 (355) 2,864 (1) 3,298 (1)<br />
Finance income 7 9<br />
Finance costs (23) (32)<br />
Profit before tax 2,848 3,275<br />
Taxes (1,030) (1,489)<br />
Profit after tax 1,818 1,786<br />
(1) The performance of operating segments is evaluated based on profit before tax, finance income and finance costs. Financing requirements, finance income, finance costs and taxes are managed on a Group basis.<br />
There were no significant inter-segment transactions during the year.<br />
Financial Report<br />
81
82<br />
Notes to and forming part<br />
of the financial <strong>report</strong><br />
For the year ended 31 December 2009<br />
2. Operating segments (continued)<br />
(b) Segment assets and liabilities and other segment information at 31 December 2009<br />
North West Shelf<br />
Business Unit<br />
2009<br />
$m<br />
2008<br />
$m<br />
Australia<br />
Business Unit<br />
2009<br />
$m<br />
2008<br />
$m<br />
Pluto<br />
Business Unit<br />
2009<br />
$m<br />
2008<br />
$m<br />
United States<br />
Business Unit<br />
2009<br />
$m<br />
2008<br />
$m<br />
2009<br />
$m<br />
Other Unallocated items Consolidated<br />
Segment assets/<br />
(liabilities)<br />
3,891 4,007 2,837 3,198 10,358 5,472 666 963 2,637 2,640 (714) (1) (1,691) (1) 19,675 (4) 14,589 (5)<br />
Segment<br />
liabilities/(assets) 1,788 2,446 438 652 652 910 117 87 (252)(2) (134) (2) (516) (3) (577) (3) 2,227 (6) 3,384 (7)<br />
Other segment<br />
information<br />
Investment in<br />
associates<br />
Additions to<br />
oil and gas<br />
2 4 - - - - - - - - - - 2 4<br />
properties<br />
Additions to<br />
(65) 1,084 196 734 4,617 3,777 21 115 19 (2) - - 4,788 5,708<br />
exploration<br />
and evaluation<br />
assets<br />
Additions to<br />
18 18 17 - 62 85 48 102 204 269 - - 349 474<br />
other plant and<br />
equipment<br />
- 3 - - - - 2 3 - 6 - - 2 12<br />
(1) 2009 and 2008 figures include a fair value adjustment to exploration and evaluation assets at corporate level ($1,304 million).<br />
(2) 2009 and 2008 figures include inter-company amounts (2009: $304 million; 2008: $232 million).<br />
(3) 2009 and 2008 figures include inter-company amounts (2009: $15,865 million; 2008: $15,865 million).<br />
(4) Segment assets do not include deferred tax ($84 million), derivatives ($81 million) and cash held in reserves ($34 million) as these assets are managed on a Group basis.<br />
(5) Segment assets do not include deferred tax ($127 million), derivatives ($170 million) and cash held in reserves ($43 million) as these assets are managed on a Group basis.<br />
(6) Segment liabilities do not include interest-bearing liabilities ($5,529 million), tax payables ($222 million), deferred tax ($1,488 million) and derivatives ($32 million) as these<br />
liabilities are managed on a Group basis.<br />
(7) Segment liabilities do not include interest-bearing liabilities ($2,957 million), tax payables ($542 million), deferred tax ($1,110 million) and derivatives ($4 million) as these<br />
liabilities are managed on a Group basis<br />
(c) Geographical information<br />
Revenue from external customers by geographical locations is detailed below. Revenue is attributable to geographic<br />
location based on the location of the customers.<br />
2009<br />
$m<br />
Australia Asia<br />
2008<br />
$m<br />
2009<br />
$m<br />
2008<br />
$m<br />
2008<br />
$m<br />
United States of<br />
America<br />
2009<br />
$m<br />
2008<br />
$m<br />
2009<br />
$m<br />
2009<br />
$m<br />
2008<br />
$m<br />
2009<br />
$m<br />
2008<br />
$m<br />
Other Consolidated<br />
Revenue from external customers 841 886 3,123 4,109 226 520 162 475 4,352 5,990<br />
Non-current assets 16,304 12,671 - - 607 935 90 225 17,001 (1) 13,831 (2)<br />
(1) Non-current assets excluding derivatives ($81 million) and deferred tax ($84 million).<br />
(2) Non-current assets excluding derivatives ($126 million) and deferred tax ($127 million).<br />
(d) Major customer information<br />
A major customer to which the Group, through the North West Shelf Business Unit and the Australia Business Unit<br />
segments, provides goods that are more than 10% of external revenue, accounts for 13% (2008: 13%) of external<br />
revenue totalling $577 million (2008: $778 million).<br />
2008<br />
$m<br />
2009<br />
$m<br />
2008<br />
$m
3. Revenue and expenses<br />
(a) Revenue from sale of goods<br />
2009<br />
$m<br />
Notes to and forming part<br />
of the financial <strong>report</strong><br />
For the year ended 31 December 2009<br />
Consolidated Parent<br />
Liquefied Natural Gas<br />
North West Shelf 983 1,252 - -<br />
Pipeline natural gas<br />
North West Shelf 372 303 - -<br />
Otway 88 75 - -<br />
United States of America 55 120 - -<br />
2008<br />
$m<br />
2009<br />
$m<br />
2008<br />
$m<br />
515 498 - -<br />
Condensate<br />
North West Shelf 687 741 - -<br />
Otway 17 24 - -<br />
Ohanet 42 39 - -<br />
United States of America 6 15 - -<br />
752 819 - -<br />
Oil<br />
North West Shelf 353 687 - -<br />
Laminaria 267 183 - -<br />
Mutineer–Exeter 22 39 - -<br />
Enfield (1) 481 813 - -<br />
Vincent (1) 295 103 - -<br />
Stybarrow (1) 440 1,331 - -<br />
United States of America 95 102 - -<br />
1,953 3,258 - -<br />
Liquefied Petroleum Gas<br />
North West Shelf 98 119 - -<br />
Otway 23 18 - -<br />
Ohanet 28 26 - -<br />
149 163 - -<br />
Total revenue from sale of goods 4,352 5,990 - -<br />
(b) Cost of sales<br />
Cost of production<br />
Production costs (482) (484) - -<br />
Royalties and excise (345) (505) - -<br />
Insurance (31) (41) - -<br />
Inventory movement 7 20 - -<br />
(851) (1,010) - -<br />
Shipping and direct sales costs<br />
Oil and gas properties depreciation and amortisation<br />
(77) (98) - -<br />
Land and buildings (3) (17) - -<br />
Transferred exploration and evaluation (50) (50) - -<br />
Plant and equipment (890) (783) - -<br />
Marine vessels and carriers (6) (11) - -<br />
(949) (861) - -<br />
Total cost of sales (1,877) (1,969) - -<br />
Gross profit 2,475 4,021 - -<br />
(1) 2009 figures include crude oil hedging gain of $28 million (2008: hedging loss of $220 million), resulting from settlement of Greater Exmouth area Zero Cost Collars.<br />
Refer to Note 25(f) for further detail.<br />
Financial Report<br />
83
84<br />
Notes to and forming part<br />
of the financial <strong>report</strong><br />
For the year ended 31 December 2009<br />
3. Revenue and expenses (continued)<br />
(c) Other income<br />
2009<br />
$m<br />
Consolidated Parent<br />
Dividend - controlled entities - - 774 929<br />
Other fees and recoveries 39 23 - -<br />
Share of associates’ net profit 4 6 - -<br />
Gain on sale of available-for-sale financial assets - 12 - -<br />
Gain on sale of fixed assets 12 7 - -<br />
Defined benefit superannuation plan net actuarial gain/(loss) 12 (39) - -<br />
Exchange gain/(loss) - other 891 (235) - -<br />
Cash flow hedge ineffectiveness - 4 - -<br />
Total other income 958 (222) 774 929<br />
(d) Other expenses<br />
Exploration and evaluation<br />
Exploration (268) (269) - -<br />
Amortisation of licence acquisition costs (46) (71) - -<br />
Evaluation (6) (8) - -<br />
Total exploration and evaluation (320) (348) - -<br />
Other costs<br />
Depreciation of other plant and equipment (17) (23) - -<br />
Exchange loss on cash balances (2) (16) - -<br />
Change in fair value of embedded derivatives (4) 10 - -<br />
(Loss)/gain on derivative financial instruments (65) 95 - -<br />
General, administrative and other costs (42) (87) (7) (6)<br />
Impairment of oil and gas properties (22) (54) - -<br />
Impairment of exploration and evaluation assets (90) - - -<br />
Impairment of other assets (7) (78) - -<br />
Total other costs (249) (153) (7) (6)<br />
Total other expenses (569) (501) (7) (6)<br />
Profit before tax and net finance costs 2,864 3,298 767 923<br />
(e) Finance income<br />
Interest<br />
Financial institutions 7 9 - -<br />
Controlled entities - - 61 7<br />
Total finance income 7 9 61 7<br />
(f) Finance costs<br />
Borrowing costs<br />
Financial institutions (4) (6) - -<br />
Controlled entities - - - (28)<br />
Unwinding of present value discount (accretion) (19) (26) - -<br />
Total finance costs (23) (32) - (28)<br />
Profit before tax 2,848 3,275 828 902<br />
2008<br />
$m<br />
2009<br />
$m<br />
2008<br />
$m
4. Taxes<br />
(a) Tax expense/(income) comprises:<br />
Current tax expense<br />
2009<br />
$m<br />
Notes to and forming part<br />
of the financial <strong>report</strong><br />
For the year ended 31 December 2009<br />
Consolidated Parent<br />
Income tax 544 1,125 14 (8)<br />
PRRT 185 308 - -<br />
(Over)/under provided in prior years<br />
Income tax (22) 4 (1) -<br />
PRRT 9 (5) - -<br />
Deferred tax expense relating to the movement in deferred tax<br />
balances<br />
Income tax 376 (261) 2 -<br />
PRRT (102) 318 - -<br />
Write-downs of deferred tax assets 40 - - -<br />
Total tax expense/(income) <strong>report</strong>ed in the<br />
income statement<br />
(b) Reconciliation of tax expense to<br />
prima facie tax payable<br />
2008<br />
$m<br />
2009<br />
$m<br />
2008<br />
$m<br />
1,030 1,489 15 (8)<br />
Profit before tax 2,848 3,275 828 902<br />
PRRT expense (92) (621) - -<br />
Profit after PRRT expense 2,756 2,654 828 902<br />
Tax expense calculated at 30% 827 796 249 271<br />
Tax effect of items which are non-deductible/(assessable)<br />
Sale of assets - (8) - -<br />
Research and development (6) (12) - -<br />
Intercompany dividends - - (233) (279)<br />
Other (6) 13 - -<br />
Foreign tax losses brought to account - - - -<br />
Foreign expenditure not brought to account 102 78 - -<br />
Tax rate differential on non-Australian income 3 (3) - -<br />
(Over)/under provided in prior years (22) 4 (1) -<br />
Write-downs of deferred tax assets 40 - - -<br />
PRRT expense 92 621 - -<br />
Tax expense/(income) 1,030 1,489 15 (8)<br />
The tax rate used in the above reconciliation is that applied to resident companies pursuant to the income tax statutes in force in<br />
Australia as at the <strong>report</strong>ing date. There has been no change in the corporate tax rate when compared with the previous <strong>report</strong>ing<br />
year.<br />
(c) Tax recognised directly in equity<br />
The following current and deferred amounts were charged<br />
directly to equity during the year:<br />
Deferred tax 122 (83) (12) -<br />
Financial Report<br />
85
86<br />
Notes to and forming part<br />
of the financial <strong>report</strong><br />
For the year ended 31 December 2009<br />
4. Taxes (continued)<br />
(d) Deferred tax<br />
Consolidated<br />
Balance at<br />
1 January<br />
Charged/<br />
(credited)<br />
to income<br />
statement<br />
Charged/<br />
(credited) to<br />
equity<br />
Acquisition/<br />
(disposal)<br />
Reclassification<br />
Balance at<br />
31 December<br />
$m $m $m $m $m $m<br />
2009<br />
Deferred tax assets<br />
Arising from temporary<br />
differences<br />
and tax losses<br />
Foreign jurisdiction 127 (40) (30) - - 57<br />
Domestic jurisdiction - 28 - - (1) 27<br />
127 (12) (30) - (1) 84<br />
Deferred tax liabilities<br />
Arising from temporary<br />
differences<br />
Exploration and evaluation<br />
assets<br />
225 71 - - (2) 294<br />
Oil and gas properties 789 (220) - - (24) 545<br />
Financial instruments (95) 231 104 - 1 241<br />
Other liabilities (287) 31 - - (6) (262)<br />
Provisions (390) 222 - - (9) (177)<br />
Other 8 54 (12) - (24) 26<br />
Assets classified as held for sale - - - - 63 63<br />
Arising from PRRT 860 (102) - - - 758<br />
1,110 287 92 - (1) 1,488<br />
2008<br />
Deferred tax assets<br />
Arising from temporary<br />
differences and tax losses<br />
Foreign jurisdiction 208 - 39 - (120) 127<br />
Domestic jurisdiction - - - - - -<br />
208 - 39 - (120) 127<br />
Deferred tax liabilities<br />
Arising from temporary<br />
differences<br />
Exploration and evaluation<br />
assets<br />
235 67 9 1 (87) 225<br />
Oil and gas properties 720 157 6 (21) (73) 789<br />
Financial instruments 69 (123) (57) - 16 (95)<br />
Other liabilities (154) (133) - - - (287)<br />
Provisions (190) (200) - - - (390)<br />
Other (5) (9) (2) - 24 8<br />
Arising from PRRT 542 346 - (28) - 860<br />
1,217 105 (44) (48) (120) 1,110<br />
As at 31 December 2009, the parent entity had recognised deferred tax assets of $10 million (2008: nil).
4. Taxes (continued)<br />
(e) Unrecognised deferred tax assets<br />
Tax losses not recognised<br />
2009<br />
$m<br />
Notes to and forming part<br />
of the financial <strong>report</strong><br />
For the year ended 31 December 2009<br />
Consolidated Parent<br />
Revenue 126 109 - -<br />
Capital 111 159 111 159<br />
Tax credits not recognised 15 17 15 17<br />
Temporary differences associated with investments 2 2 - -<br />
2008<br />
$m<br />
2009<br />
$m<br />
2008<br />
$m<br />
254 287 126 176<br />
(f) Tax losses<br />
At the balance sheet date the Group has unused (recognised and not recognised) tax losses and credits of $915 million<br />
(2008: $1,115 million) that are available for offset against future taxable profits.<br />
A deferred tax asset of $56 million (2008: $88 million) has been recognised because it is probable that sufficient future<br />
taxable profit will be available for use against such losses.<br />
No deferred tax asset has been recognised in respect of the remaining tax losses and credits due to the uncertainty of<br />
future profit streams.<br />
Tax credits of $15 million (2008: $17 million) are held and will expire in 2010.<br />
(g) Tax consolidation<br />
The parent and its wholly-owned Australian controlled entities have elected to enter tax consolidation, with <strong>Woodside</strong><br />
Petroleum Ltd as the head entity of the tax consolidated group. The members of the tax consolidated group are identified<br />
at Note 35(a).<br />
Entities within the tax consolidated group have entered into a tax funding arrangement and a tax sharing agreement with<br />
the head entity. Under the terms of the tax funding arrangement, <strong>Woodside</strong> Petroleum Ltd and each of the entities in<br />
the tax consolidated group have agreed to pay a tax equivalent payment to or from the head entity calculated on a stand<br />
alone basis, based on the current tax liability or current tax asset of the entity. Such amounts are reflected in amounts<br />
receivable from or payable to other entities in the tax consolidated group.<br />
The tax sharing agreement entered into between members of the tax consolidated group provides for the determination<br />
of the allocation of income tax liabilities between the entities, should the head entity default on its tax payment<br />
obligations. No amounts have been recognised in the financial statements in respect of this agreement as payment of<br />
any amounts under the tax sharing agreement is considered remote.<br />
Financial Report<br />
87
88<br />
Notes to and forming part<br />
of the financial <strong>report</strong><br />
For the year ended 31 December 2009<br />
5. Earnings per share<br />
Consolidated<br />
2009 2008<br />
Profit attributable to equity holders of the parent ($m) 1,824 1,786<br />
Weighted average number of shares on issue (1) 703,310,697 685,179,496<br />
Basic and diluted earnings per share (cents) 259 260<br />
(1) Earnings per share is calculated by dividing net profit for the year attributable to ordinary equity holders of the parent by the weighted average number of ordinary shares outstanding<br />
during the year. The weighted average number of shares makes allowance for shares reserved for employee share plans. Diluted earnings per share is not significantly different from<br />
basic earnings per share.<br />
Prior year earnings per share have been restated with an adjustment factor of 1.0047 as a result of the fully underwritten<br />
accelerated renounceable entitlement offer announced on 14 December 2009. Current year earning per share have been<br />
adjusted by a factor of 1.0002 reflecting the retail portion of the fully underwritten accelerated renounceable entitlement offer.<br />
The Group announced a fully underwritten 1 for 12 accelerated renounceable entitlement offer on 14 December 2009 at a price<br />
of $42.10 per share, which included institutional and retail portions.<br />
On settlement of the institutional portion of the entitlement offer and placement on 23 December 2009, the Group issued 31.2<br />
million shares at a price of $42.10 per share.<br />
After settlement of the retail portion of the entitlement offer on 10 February 2010, the Group issued 28.6 million shares at a price<br />
of $42.10 per share.<br />
The total amount raised was $2,520 million with 59.8 million shares issued.<br />
6. Dividends paid and proposed<br />
(a) Dividends paid during the year (1)<br />
Prior year fully franked final dividend<br />
55 cents, paid 6 April 2009<br />
(2008: 55 cents, paid 31 March 2008)<br />
Current year fully franked interim dividend<br />
55 cents, paid 5 October 2009<br />
(2008: 80 cents, paid 1 October 2008)<br />
(b) Dividend declared (not recorded as a liability) (1)<br />
Fully franked final dividend 55 cents,<br />
to be paid 31 March 2010<br />
(2008: 55 cents, paid 6 April 2009)<br />
Dividend per share in respect of<br />
financial year (cents)<br />
(1) Fully franked at 30.0% (2008: 30.0%).<br />
2009<br />
$m<br />
Consolidated Parent<br />
2008<br />
$m<br />
2009<br />
$m<br />
2008<br />
$m<br />
384 378 384 378<br />
390 551 390 551<br />
774 929 774 929<br />
427 384 427 384<br />
110 135 110 135
6. Dividends paid and proposed (continued)<br />
(c) Franking credit balance<br />
2009<br />
$m<br />
Notes to and forming part<br />
of the financial <strong>report</strong><br />
For the year ended 31 December 2009<br />
Consolidated Parent<br />
Franking credits available for the subsequent financial year arising<br />
from:<br />
Franking account balance as at 1 January 2,147 1,452 2,147 1,452<br />
Current year tax payment instalments and adjustments 408 667 408 667<br />
Interim dividends paid (167) (236) (167) (236)<br />
Franking account balance as at 31 December 2,388 1,883 2,388 1,883<br />
Current year income tax payable 124 429 124 429<br />
Dividends declared (183) (165) (183) (165)<br />
Franking account balance after payment of tax and dividends 2,329 2,147 2,329 2,147<br />
7. Cash and cash equivalents (current)<br />
2009<br />
$m<br />
2008<br />
$m<br />
2009<br />
$m<br />
Consolidated Parent<br />
Components of cash and cash equivalents<br />
Cash at bank (1) 55 139 - -<br />
Money market deposits (2) 1,296 2 - -<br />
Total cash and cash equivalents 1,351 141 - -<br />
(1) Cash at bank earns on average 1.2% (2008: 0.6%).<br />
(2) Money market deposits are denominated in Australian dollars and US dollars with an average maturity of 2.1 days (2008: 2.1 days) and effective interest rate of 0.1% to 5.3% (2008:<br />
0.1% to 8.1%).<br />
Reconciliation to statement of cash flows<br />
For the purpose of the statement of cash flows, cash and cash equivalents comprise the following at 31 December 2009:<br />
2008<br />
$m<br />
2009<br />
$m<br />
Consolidated Parent<br />
Cash at bank 55 139 - -<br />
Money market deposits 1,296 2 - -<br />
1,351 141 - -<br />
Cash at bank attributable to disposal group held for sale (Note 24) (5) - - -<br />
2009<br />
$m<br />
2008<br />
$m<br />
2009<br />
$m<br />
2008<br />
$m<br />
2008<br />
$m<br />
2008<br />
$m<br />
1,346 141 - -<br />
Financial Report<br />
89
90<br />
Notes to and forming part<br />
of the financial <strong>report</strong><br />
For the year ended 31 December 2009<br />
8. Receivables<br />
(a) Receivables (current)<br />
2009<br />
$m<br />
Consolidated Parent<br />
Trade receivables (1) 329 309 - -<br />
Other receivables<br />
Other entities (3) 230 222 - -<br />
Dividends receivable<br />
Other entities (4) 3 2 - -<br />
Interest receivable<br />
Other entities (4) 1 - - -<br />
(b) Receivables (non-current)<br />
9. Inventories<br />
2008<br />
$m<br />
2009<br />
$m<br />
2008<br />
$m<br />
563 533 - -<br />
Other receivables - controlled entities (2) - - 4,878 2,675<br />
(1) Denominated in a mixture of Australian dollars and US dollars, interest free, and settlement terms of between 7 and 30 days.<br />
(2) For terms and conditions relating to receivables from controlled entities, refer to Note 30(b).<br />
(3) Receivables are interest free with various maturities.<br />
(4) Dividends and interest receivable from other entities are receivable within 30 days of period end.<br />
(a) Inventories (current)<br />
2009<br />
$m<br />
Consolidated Parent<br />
Petroleum products (at cost)<br />
Work in progress 1 1 - -<br />
Goods in transit 4 5 - -<br />
Finished stocks 55 49 - -<br />
Warehouse stores and materials (at cost) 62 53 - -<br />
(b) Inventories (non-current)<br />
2008<br />
$m<br />
2009<br />
$m<br />
2008<br />
$m<br />
122 108 - -<br />
Warehouse stores and materials (at cost) 49 54 - -<br />
10. Other financial assets<br />
(a) Other financial assets (current)<br />
2009<br />
$m<br />
Consolidated Parent<br />
Derivative instruments (2) - 44 - -<br />
(b) Other financial assets (non-current)<br />
Other investments (available-for-sale)<br />
Listed (fair value) 10 5 - -<br />
Unlisted (cost) 6 6 - -<br />
Cash held in reserve (1) 34 43 - -<br />
Derivative instruments (2) 20 53 - -<br />
Embedded derivatives (3) 61 73 - -<br />
(1) Represents restricted cash associated with JBIC facility, refer to Note 25(e).<br />
(2) For details relating to derivative instruments, refer to Note 25(f).<br />
131 180 - -<br />
(3) Embedded derivatives relate to sale contracts, details of which cannot be disclosed due to confidentiality obligations.<br />
2008<br />
$m<br />
2009<br />
$m<br />
2008<br />
$m
11. Other assets<br />
(a) Other assets (current)<br />
2009<br />
$m<br />
Notes to and forming part<br />
of the financial <strong>report</strong><br />
For the year ended 31 December 2009<br />
Consolidated Parent<br />
Prepayments 69 19 - -<br />
Other 4 - - -<br />
(b) Other assets (non-current)<br />
2008<br />
$m<br />
2009<br />
$m<br />
2008<br />
$m<br />
73 19 - -<br />
Investment in controlled entities - - 234 233<br />
Investment in associated entities 2 4 - -<br />
Development asset - 8 - -<br />
12. Exploration and evaluation assets (non-current)<br />
(a) Reconciliations of the carrying amounts of exploration and<br />
evaluation assets at the beginning and end of the financial<br />
year:<br />
2009<br />
$m<br />
2 12 234 233<br />
Consolidated Parent<br />
Carrying amount at 1 January 1,172 737 - -<br />
Additions 349 474 - -<br />
Amortisation of licence acquisition costs (46) (71) - -<br />
Expensed (previously capitalised) (4) (51) - -<br />
Impairment loss (90) - - -<br />
Disposals at written down value - (16) - -<br />
Transferred exploration and evaluation - 11 (1) - -<br />
Currency translation differences (83) 88 - -<br />
Carrying amount as at 31 December 1,298 1,172 - -<br />
2008<br />
$m<br />
(1) Balance of $11 million comprises $12 million transferred to oil and gas properties and $23 million fixed asset reclassification.<br />
(b) Carrying amounts of exploration and evaluation assets<br />
Regions<br />
Australia<br />
Browse Basin 639 515 - -<br />
Carnarvon Basin 307 186 - -<br />
Bonaparte Basin 123 105 - -<br />
The Americas<br />
Gulf of Mexico 204 246 - -<br />
Brazil 25 6 - -<br />
Africa<br />
West Africa (Sierra Leone, Liberia) - 4 - -<br />
North Africa (Algeria, Libya) - 109 - -<br />
East Africa (Kenya) - 1 - -<br />
Carrying amount at 31 December 1,298 1,172 - -<br />
2009<br />
$m<br />
2008<br />
$m<br />
Financial Report<br />
91
92<br />
Notes to and forming part<br />
of the financial <strong>report</strong><br />
For the year ended 31 December 2009<br />
13. Oil and gas properties (non-current)<br />
Land and<br />
buildings<br />
Transferred<br />
exploration<br />
and<br />
evaluation<br />
Plant and<br />
equipment<br />
Marine<br />
vessels and<br />
carriers<br />
Projects in<br />
development<br />
Consolidated $m $m $m $m $m $m<br />
At 1 January 2008<br />
Historical cost 324 426 7,413 417 2,946 11,526<br />
Accumulated depreciation and<br />
impairment<br />
(172) (176) (3,313) (246) - (3,907)<br />
Net carrying amount 152 250 4,100 171 2,946 7,619<br />
Year ended 31 December 2008<br />
Carrying amount at<br />
1 January 2008<br />
152 250 4,100 171 2,946 7,619<br />
Additions 1 (5) 849 5 4,858 5,708<br />
Disposals at written down value - - (26) - (90) (116)<br />
Depreciation and amortisation (2) (54) (816) (11) - (883)<br />
Impairment loss - - (54) - - (54)<br />
Completions and transfers 213 101 1,963 - (2,306) (29) (1)<br />
Currency translation differences 4 2 142 - 35 183<br />
Carrying amount at<br />
31 December 2008<br />
At 31 December 2008<br />
Total<br />
368 294 6,158 165 5,443 12,428<br />
Historical cost 557 522 10,351 422 5,443 17,295<br />
Accumulated depreciation and<br />
impairment<br />
(189) (228) (4,193) (257) - (4,867)<br />
Net carrying amount 368 294 6,158 165 5,443 12,428<br />
Year ended 31 December 2009<br />
Carrying amount at<br />
1 January 2009<br />
368 294 6,158 165 5,443 12,428<br />
Additions - 1 (691) - 5,478 4,788 (2)<br />
Transfer to non-current assets held for<br />
sale (3) (12) - - - - (12)<br />
Transfer to disposal group<br />
held for sale (Note 24)<br />
(36) (54) (456) - (16) (562)<br />
Disposals at written down value - - (4) - (6) (10)<br />
Depreciation and amortisation (3) (50) (890) (6) - (949)<br />
Impairment loss (3) - (19) - - (22)<br />
Completions and transfers 111 (7) 726 (5) (825) -<br />
Currency translation differences (4) (11) (136) - - (151)<br />
Carrying amount at<br />
31 December 2009<br />
421 173 4,688 154 10,074 15,510<br />
At 31 December 2009<br />
Historical cost 642 430 9,564 417 10,074 21,127<br />
Accumulated depreciation and<br />
impairment<br />
(221) (257) (4,876) (263) - (5,617)<br />
Net carrying amount 421 173 4,688 154 10,074 15,510<br />
(1) Balance of $29 million comprises $12 million transferred from exploration and evaluation assets, $17 million transferred from other plant and equipment and $58 million of fixed asset<br />
reclassification.<br />
(2) Additions include a decrease in restoration provision assets of $779 million, associated with the change in the method of restoration (refer to Note 1(l)).<br />
(3) Impairment of assets attributable to non-current assets held for sale recognised in the income statement was $3 million (refer to Note 3(d)). Immediately before the classification as<br />
non-current assets held for sale, the recoverable amount was estimated based on fair value less cost to sell. The net carrying amount of the non-current assets was $15 million. As a<br />
result, an impairment loss of $3 million was recognised to reduce the carrying amount to the recoverable amount.<br />
Borrowing costs capitalised in oil and gas properties during the year were $200 million (2008: $82 million), at a weighted average<br />
interest rate of 4.2% (2008: 4.9%).
14. Other plant and equipment (non-current)<br />
(a) Other plant and equipment<br />
2009<br />
$m<br />
Notes to and forming part<br />
of the financial <strong>report</strong><br />
For the year ended 31 December 2009<br />
Consolidated Parent<br />
Plant and equipment 182 184 - -<br />
Less: Accumulated depreciation (90) (79) - -<br />
2008<br />
$m<br />
2009<br />
$m<br />
2008<br />
$m<br />
92 105 - -<br />
Assets under construction - 6 - -<br />
92 111 - -<br />
(b) Reconciliations of the carrying amounts of other<br />
plant and equipment at the beginning and end of the<br />
financial year:<br />
Carrying amount at 1 January 111 130 - -<br />
Additions 2 12 - -<br />
Disposals at written down value (1) - - -<br />
Impairment loss (1) - - -<br />
Completions and transfers (1) (12) (1) - -<br />
Depreciation and amortisation (17) (20) - -<br />
Currency translation differences (1) 1 - -<br />
Carrying amount at 31 December 92 111 - -<br />
15. Payables<br />
(1) Balance of $12 million comprises $17 million transferred to oil and gas properties and $5 million fixed asset reclassification.<br />
2009<br />
$m<br />
Consolidated Parent<br />
(a) Payables (current)<br />
Trade payables (1) 386 454 - -<br />
Other payables (1) 878 1,167 - -<br />
Amounts payable – controlled entities (2) - - 323 -<br />
Interest payable – other entities (3) 64 51 - -<br />
1,328 1,672 323 -<br />
(b) Payables (non-current)<br />
Amounts payable – controlled entities (2) - - 208 178<br />
(1) Trade and other payables are non interest-bearing and normally settled on 30 day terms.<br />
(2) For terms and conditions relating to payables to controlled entities, refer to Note 30(b).<br />
(3) Details regarding interest-bearing liabilities are contained in Note 25(e).<br />
2008<br />
$m<br />
2009<br />
$m<br />
2008<br />
$m<br />
Financial Report<br />
93
94<br />
Notes to and forming part<br />
of the financial <strong>report</strong><br />
For the year ended 31 December 2009<br />
16. Interest-bearing liabilities<br />
(a) Interest-bearing liabilities (current)<br />
2009<br />
$m<br />
Consolidated Parent<br />
Bridge facility - - - -<br />
Bonds - - - -<br />
(b) Interest-bearing liabilities (non-current) (1)<br />
2008<br />
$m<br />
2009<br />
$m<br />
2008<br />
$m<br />
- - - -<br />
Bonds 2,485 788 - -<br />
Debt facilities 3,044 2,169 - -<br />
(1) Detail regarding interest-bearing liabilities is contained in Note 25(e).<br />
17. Tax payable (current)<br />
5,529 2,957 - -<br />
2009<br />
$m<br />
Consolidated Parent<br />
Income tax payable 124 442 122 445<br />
PRRT payable 98 100 - -<br />
18. Other financial liabilities<br />
2009<br />
$m<br />
2008<br />
$m<br />
2009<br />
$m<br />
2008<br />
$m<br />
222 542 122 445<br />
Consolidated Parent<br />
(a) Other financial liabilities (current)<br />
Derivative instruments (1) 32 - - -<br />
32 - - -<br />
(b) Other financial liabilities (non-current)<br />
Derivative instruments (1) - 4 - -<br />
- 4 - -<br />
(1) For details relating to derivative instruments refer to Note 25(f).<br />
19. Other liabilities<br />
(a) Other liabilities (current)<br />
2009<br />
$m<br />
2008<br />
$m<br />
2009<br />
$m<br />
Consolidated Parent<br />
Unearned revenue 17 17 - -<br />
Gas purchase commitments 1 5 - -<br />
(b) Other liabilities (non-current)<br />
2008<br />
$m<br />
2009<br />
$m<br />
2008<br />
$m<br />
2008<br />
$m<br />
18 22 - -<br />
Unearned revenue 172 215 - -<br />
Gas purchase commitments 20 30 - -<br />
Defined benefit superannuation plan 16 47 - -<br />
208 292 - -
20. Provisions<br />
Consolidated<br />
Restoration<br />
of operating<br />
locations (1)<br />
Notes to and forming part<br />
of the financial <strong>report</strong><br />
For the year ended 31 December 2009<br />
Employee<br />
benefits (2)<br />
Other Total<br />
$m $m $m $m<br />
At 1 January 2009 1,265 126 7 1,398<br />
Change in provision (774) 9 4 (761)<br />
Unwinding of present value discount 19 - - 19<br />
Transferred to liabilities held for sale (24) - - (24)<br />
At 31 December 2009 486 135 11 632<br />
2008<br />
Current 10 110 7 127<br />
Non-current 1,255 16 - 1,271<br />
1,265 126 7 1,398<br />
2009<br />
Current 7 109 11 127<br />
Non-current 479 26 - 505<br />
486 135 11 632<br />
(1) Details regarding restoration of operating locations are contained in Note 1(l) and 1(ad).<br />
(2) Details regarding employee benefits are contained in Note 1(v) and 27.<br />
21. Contributed equity<br />
2009<br />
$m<br />
Consolidated Parent<br />
(a) Issued and fully paid shares<br />
748,598,989 (2008: 698,553,001) ordinary shares (1) 4,163 2,104 4,163 2,104<br />
(b) Shares reserved for employee share plans<br />
2,830,721 (2008: 5,459,269) (2) ordinary shares (3) (99) (142) (99) (142)<br />
(1) All shares are a single class with equal rights to dividends, capital distributions and voting. The company does not have authorised capital nor par value in respect of its<br />
issued shares.<br />
(2) 2008 figure has been restated to correctly reflect the number of shares.<br />
(3) Information relating to the number of <strong>Woodside</strong> Petroleum Ltd shares reserved for employee share plans can be found in Note 27(a) and (b).<br />
(c) Movements in issued and fully paid shares<br />
2009<br />
Shares<br />
2008<br />
$m<br />
2008<br />
Shares<br />
Balance at 1 January 698,553,001 688,330,535 2,104 1,553<br />
DRP underwriting agreement<br />
DRP<br />
Ordinary shares issued at $54.24 (2008 interim dividend) - 4,685,312 - 255<br />
Ordinary shares issued at $36.25 (2008 final dividend) 5,165,380 - 187 -<br />
Ordinary shares issued at $48.48 (2009 interim dividend) 3,769,777 - 183 -<br />
Ordinary shares issued at $53.48 (2008 interim dividend) - 5,537,154 - 295<br />
Ordinary shares issued at $35.50 (2008 final dividend) 5,555,235 - 197 -<br />
Ordinary shares issued at $47.67 (2009 interim dividend) 4,343,965 - 207 -<br />
Rights Issue<br />
Ordinary shares issued at $42.10 31,211,631 - 1,314 -<br />
Share issue costs (net of tax) - - (29) 1<br />
Balance at 31 December 748,598,989 698,553,001 4,163 2,104<br />
2009<br />
$m<br />
2009<br />
$m<br />
2008<br />
$m<br />
2008<br />
$m<br />
Financial Report<br />
95
96<br />
Notes to and forming part<br />
of the financial <strong>report</strong><br />
For the year ended 31 December 2009<br />
22. Other reserves<br />
Consolidated<br />
Employee<br />
benefits<br />
reserve<br />
Foreign<br />
currency<br />
translation<br />
reserve<br />
Hedge of net<br />
investment<br />
reserve<br />
Hedging<br />
reserve<br />
Investment<br />
fair value<br />
reserve<br />
Total<br />
$m $m $m $m $m $m<br />
Balance at 1 January 2008 47 (159) 73 (134) 18 (155)<br />
Share-based payments 16 - - - - 16<br />
Cash flow hedges<br />
Net deferred loss recognised in equity - - - (11) - (11)<br />
Loss recognised in revenue - - - 156 - 156<br />
Available-for-sale financial assets - - - - (24) (24)<br />
Net loss on hedge of net investment - - (243) - - (243)<br />
Currency translation differences - 314 - - - 314<br />
Balance at 31 December 2008 63 155 (170) 11 (6) 53<br />
Balance at 1 January 2009 63 155 (170) 11 (6) 53<br />
Share-based payments 51 - - - - 51<br />
Cash flow hedges<br />
Net deferred loss recognised in equity - - - (11) - (11)<br />
Gain recognised in revenue - - - (16) - (16)<br />
Available-for-sale financial assets - - - - - -<br />
Net gain on hedge of net investment - - 256 - - 256<br />
Currency translation differences - (272) - - - (272)<br />
Balance at 31 December 2009 114 (117) 86 (16) (6) 61<br />
Parent<br />
Balance at 1 January 2008 38 - - - - 38<br />
Share-based payments 3 - - - - 3<br />
Balance at 31 December 2008 41 - - - - 41<br />
Balance at 1 January 2009 41 - - - - 41<br />
Share-based payments 43 - - - - 43<br />
Balance at 31 December 2009 84 - - - - 84<br />
Nature and purpose of reserves<br />
Employee benefits reserve<br />
Used to record share-based payments associated with the employee share plans.<br />
Foreign currency translation reserve<br />
Used to record foreign exchange differences arising from the translation of the financial statements of subsidiaries with<br />
functional currencies other than Australian dollars.<br />
Hedge of net investment reserve<br />
Used to record gains and losses on hedges of net investments in foreign operations.<br />
Hedging reserve<br />
Used to record the effective portion of changes in the fair value of cash flow hedges.<br />
Investment fair value reserve<br />
Used to record changes in the fair value of the Group’s available-for-sale financial assets.
23. Retained earnings<br />
2009<br />
$m<br />
Notes to and forming part<br />
of the financial <strong>report</strong><br />
For the year ended 31 December 2009<br />
Consolidated Parent<br />
Movements in retained earnings<br />
Balance at 1 January 4,690 3,833 282 301<br />
Net profit for the year 1,824 1,786 813 910<br />
Dividends (774) (929) (774) (929)<br />
Balance at 31 December 5,740 4,690 321 282<br />
24. Assets and liabilities of disposal group classified as held for sale<br />
(a) Details of disposal group held for sale<br />
On 31 October 2009, <strong>Woodside</strong> Energy Ltd executed a Sale and Purchase Agreement to dispose of <strong>Woodside</strong>'s 51.55%<br />
interest in the Otway project (disposal group), being Exploration Permits Vic/P43 and T/30P and Production Licences Vic/<br />
L23, T/L2, T/L3 and T/34P, to Origin Energy Resources Ltd.<br />
The transaction was subject to pre-emptive rights held by other joint venture participants. Prior to the end of 2009, Benaris<br />
International Pty Ltd advised that it would exercise its pre-emptive right in relation to some of its interests. Origin and<br />
Benaris will proportionately increase their interests in the Joint Venture as a result of the sale.<br />
As at 31 December 2009, the sale remained subject to the satisfaction of a number of Conditions Precedent including the<br />
assignment of third party contracts. The transaction is expected to complete in the first quarter of 2010. The consideration<br />
receivable is $712.5 million, which will be adjusted for transactions that occur between the effective date and the<br />
completion date.<br />
The disposal group forms part of the Australia Business Unit. As at 31 October 2009, the disposal group was classified as<br />
a disposal group held for sale.<br />
(b) Assets and liabilities of disposal group held for sale<br />
The major classes of assets and liabilities of the disposal group as at 31 December 2009 are as follows:<br />
Assets<br />
Cash and cash equivalents (5)<br />
Receivables 28<br />
Inventories 2<br />
Oil and gas properties 562<br />
Assets classified as held for sale 587<br />
Liabilities<br />
Payables (17)<br />
Provisions (24)<br />
Liabilities directly associated with assets classified as held for sale (41)<br />
Net assets attributable to disposal group held for sale 546<br />
2008<br />
$m<br />
2009<br />
$m<br />
2008<br />
$m<br />
2009<br />
$m<br />
Financial Report<br />
97
98<br />
Notes to and forming part<br />
of the financial <strong>report</strong><br />
For the year ended 31 December 2009<br />
25. Financial and capital risk management<br />
(a) Financial risk management objectives and policies<br />
Market (including foreign exchange, commodity price and interest rate risk), liquidity and credit risks arise in the<br />
normal course of the Group’s business. Primary responsibility for identification and control of financial risk rests with a<br />
central treasury department (Treasury) under directives approved by the Board.<br />
The Group’s management of financial risk is aimed at ensuring net cash flows are sufficient to:<br />
• meet all its financial commitments as and when they fall due;<br />
• maintain the capacity to fund its committed project developments;<br />
• pay a reasonable dividend; and<br />
• maintain a long-term credit rating of not less than ‘investment grade’.<br />
The Group monitors and tests its forecast financial position against these criteria and, in general, will undertake<br />
hedging activity only when necessary to ensure that these objectives are achieved. Other circumstances that may<br />
lead to hedging activities include the purchase of reserves and the underpinning of the economics of a new project.<br />
The Group’s principal financial instruments, other than derivatives, comprise interest-bearing debt, cash and shortterm<br />
deposits. Other financial instruments include trade receivables and trade payables, which arise directly from<br />
operations.<br />
It is, and has been throughout the period under review, the Group Treasury policy that no speculative trading in<br />
financial instruments shall be undertaken. The Group’s forecast financial risk position with respect to key financial<br />
objectives and compliance with treasury policy are regularly <strong>report</strong>ed to the Board. The Audit & Risk Committee<br />
oversees the internal auditor review of the treasury function.<br />
(b) Market risk<br />
(i) Foreign exchange risk<br />
Foreign exchange risk arises from future commitments, assets and liabilities that are denominated in a currency<br />
that is not a functional currency. The Group operates internationally and is exposed to foreign exchange risk<br />
arising from various currency exposures, primarily with respect to the US dollar. Measuring the exposure to<br />
foreign exchange risk is achieved by regularly monitoring and performing sensitivity analysis on the Group’s<br />
financial position.<br />
The Group seeks to mitigate the effect of its foreign currency exposure by borrowing in US dollars. Currently<br />
there are no foreign exchange hedge programs in place. It is the Group's policy not to enter into forward foreign<br />
currency contracts until a firm commitment is in place. The Group Treasury manages the purchase of foreign<br />
currency to meet operational requirements.<br />
The following table shows financial instruments by currency. The Group is principally exposed to foreign<br />
exchange risk on those financial instruments denominated in US dollars, held by entities with Australian dollar<br />
functional currency.
25. Financial and capital risk management (continued)<br />
(b) Market risk (continued)<br />
Notes to and forming part<br />
of the financial <strong>report</strong><br />
For the year ended 31 December 2009<br />
2009 2008<br />
Total AUD USD Other Total AUD USD Other<br />
$m $m $m $m $m $m $m $m<br />
Consolidated<br />
Financial assets<br />
Cash 1,351 1,293 42 16 141 38 92 11<br />
Receivables 563 187 351 25 533 99 428 6<br />
Other financial assets 131 33 91 7 224 113 91 20<br />
2,045 1,513 484 48 898 250 611 37<br />
Financial liabilities<br />
Payables 1,328 738 372 218 1,672 583 659 430<br />
Interest-bearing liabilities (1) 5,585 - 5,303 282 2,967 - 2,967 -<br />
Other financial liabilities 32 - 32 - 4 - 4 -<br />
6,945 738 5,707 500 4,643 583 3,630 430<br />
Parent<br />
Financial assets<br />
Receivables 4,878 4,878 - - 2,675 2,675 - -<br />
Financial liabilities<br />
Payables<br />
(1) Excludes deferred borrowing costs.<br />
531 531 - - 178 178 - -<br />
Borrowings of US$1,160 million (2008: US$1,313 million) are designated as a hedge of the net investments in the US<br />
dollar functional currency subsidiaries outlined in Note 35(a). Foreign exchange gains or losses on these borrowings are<br />
recognised in equity to offset the gains or losses on translation of the net investments in the subsidiaries, to the extent<br />
that they represent an effective hedge.<br />
The following table summarises the sensitivity of financial instruments held at the balance sheet date to movement in the<br />
exchange rate of the Australian dollar to the US dollar, with all other variables held constant. The 10% sensitivity is based<br />
on reasonably possible changes, over a financial year, using the observed range of actual historical rates for the preceding<br />
five-year period.<br />
Judgements of reasonably<br />
possible movements:<br />
Post tax profits<br />
(decrease)/increase<br />
Other comprehensive income<br />
(decrease)/increase)<br />
Consolidated Parent Consolidated Parent<br />
2009<br />
$m<br />
2008<br />
$m<br />
2009<br />
$m<br />
AUD:USD +10% (2008:+10%) 257 80 - - 78 120 - -<br />
AUD:USD -10% (2008:-10%) (314) (98) - - (95) (146) - -<br />
2008<br />
$m<br />
2009<br />
$m<br />
2008<br />
$m<br />
2009<br />
$m<br />
2008<br />
$m<br />
Financial Report<br />
99
100<br />
Notes to and forming part<br />
of the financial <strong>report</strong><br />
For the year ended 31 December 2009<br />
25. Financial and capital risk management (continued)<br />
(b) Market risk (continued)<br />
(ii) Commodity price risk<br />
The Group’s revenue is exposed to commodity price fluctuations, in particular oil and gas prices.<br />
The Group Treasury measures exposure to commodity price risk by monitoring and stress testing the Group’s<br />
forecast financial position to sustained periods of low oil and gas prices. This analysis is regularly performed on the<br />
Group’s portfolio and, as required, for discrete projects and acquisitions.<br />
The Group’s oil commodity hedging program utilises financial instruments based on New York Mercantile Exchange<br />
(NYMEX) West Texas Intermediate (WTI). Note 25(f) details existing hedging programs. No hedging programs were<br />
placed during 2009.<br />
The following table summarises the sensitivity of the fair value of financial instruments held at the balance sheet<br />
date to movement in the relevant forward commodity price, with all other variables held constant. The 35%<br />
sensitivity is based on reasonably possible changes, over a financial year, using the observed range of actual<br />
historical prices for the preceding five-year period.<br />
Judgements of<br />
reasonably possible<br />
movements:<br />
Post tax profits<br />
(decrease)/increase<br />
Other comprehensive income<br />
(decrease)/increase)<br />
Consolidated Parent Consolidated Parent<br />
2009<br />
$m<br />
2008<br />
$m<br />
2009<br />
$m<br />
35% Increase:<br />
(2008:+25%)<br />
Oil forward price (1) (49) - - (50) (23) - -<br />
35% Decrease:<br />
(2008:-25%)<br />
Oil forward price 14 1 - - 20 75 - -<br />
For 2009, a 35% sensitivity is used. The sensitivity in 2009 reflects the increase in volatility of commodity prices<br />
during the year.<br />
(iii) Interest rate risk<br />
Interest rate risk is the risk that the Group’s financial position will be adversely affected by movements in interest<br />
rates that will increase the cost of floating rate debt or opportunity losses that may arise on fixed rate borrowings<br />
in a falling interest rate environment. Cash and short term deposits are short term in nature and are therefore<br />
monitored by the Group Treasury to achieve the optimal outcome.<br />
The Group’s main interest rate risk arises from long-term debt. Floating rate debt exposes the Group to cash flow<br />
interest rate risk. Interest rate risk is managed by maintaining an appropriate mix of fixed and floating rate debt.<br />
The Group may enter into interest rate swaps to manage the ratio of fixed rate debt to floating rate debt. Hedging<br />
is undertaken against specific rate exposures only, as disclosed in Note 25(f). No hedging programs were placed<br />
during 2009.<br />
At balance sheet date, the Group had the following mix of financial assets and liabilities exposed to variable interest<br />
rate risk that were not designated in cash flow hedges:<br />
Financial assets<br />
2008<br />
$m<br />
2009<br />
$m<br />
2008<br />
$m<br />
2009<br />
$m<br />
Consolidated Parent<br />
Other financial assets 20 51 - -<br />
Financial liabilities<br />
Interest-bearing liabilities (1) (3,067) (2,171) - -<br />
(1) Excludes deferred borrowing costs.<br />
2009<br />
$m<br />
2008<br />
$m<br />
2009<br />
$m<br />
2008<br />
$m<br />
2008<br />
$m
25. Financial and capital risk management (continued)<br />
Notes to and forming part<br />
of the financial <strong>report</strong><br />
For the year ended 31 December 2009<br />
(iii) Interest rate risk (continued)<br />
The following table summarises the sensitivity of the financial instruments held at the balance sheet date, following<br />
a movement to London Interbank Offered Rate (LIBOR), with all other variables held constant. The LIBOR +/-<br />
1.5% sensitivity is based on reasonably possible changes, over a financial year, using the observed range of actual<br />
historical rates for the preceding five-year period.<br />
Judgements of reasonably<br />
possible movements:<br />
Post tax profits<br />
(decrease)/increase<br />
Other comprehensive income<br />
(decrease)/increase)<br />
Consolidated Parent Consolidated Parent<br />
2009<br />
$m<br />
2008<br />
$m<br />
2009<br />
$m<br />
LIBOR +1.5% (2008:+1.5%) (12) (1) (19) (1) - - - - - -<br />
LIBOR -1.5% (2008:-1.5%) 12 (1) 20 (1) - - - - - -<br />
2008<br />
$m<br />
(1) Excludes impact of sensitivities on interest-bearing liabilities as borrowing costs are capitalised to qualifying assets.<br />
(c) Liquidity risk<br />
The liquidity position of the Group is managed to ensure sufficient liquid funds are available to meet its financial<br />
commitments in a timely and cost-effective manner.<br />
The Group Treasury continually reviews the Group’s liquidity position including cash flow forecasts to determine the<br />
forecast liquidity position and maintain appropriate liquidity levels. Note 25(g) details the repayment obligations in respect<br />
of the amount of facilities drawndown.<br />
2009<br />
$m<br />
2008<br />
$m<br />
2009 2008<br />
2009<br />
$m<br />
Payables maturity analysis Payables maturity analysis<br />
2008<br />
$m<br />
Total < 30 days 30-60 days > 60 days Total < 30 days 30-60 days > 60 days<br />
$m $m $m $m $m $m $m $m<br />
Consolidated<br />
Trade payables 386 293 93 - 454 430 19 5<br />
Other payables 878 878 - - 1,167 1,167 - -<br />
Interest payable 64 64 - - 51 51 - -<br />
Total payables 1,328 1,235 93 - 1,672 1,648 19 5<br />
Parent<br />
Amounts payable –<br />
Controlled entities<br />
531 - - 531 178 - - 178<br />
Total payables 531 - - 531 178 - - 178<br />
Financial Report<br />
101
102<br />
Notes to and forming part<br />
of the financial <strong>report</strong><br />
For the year ended 31 December 2009<br />
25. Financial and capital risk management (continued)<br />
(d) Credit risk<br />
Credit risk is the risk that a contracting entity will not complete its obligation under a financial instrument, resulting in a<br />
financial loss to the Group.<br />
The Group manages its credit risk on trade debtors and financial instruments by predominantly dealing with counterparties<br />
with a credit rating equal to or better than the Group. Customers who wish to trade on unsecured credit terms are subject<br />
to credit verification procedures. Receivable balances are monitored on an ongoing basis. As a result the Group’s exposure<br />
to bad debts is not significant. The Group’s maximum credit risk is limited to the carrying value of its financial assets and<br />
the financial guarantees granted (refer to Note 31). At the balance sheet date there were no significant concentrations of<br />
credit risk.<br />
Consolidated<br />
2009 2008<br />
Receivables maturity analysis (1) Receivables maturity analysis<br />
Total < 30 days 30-60 days > 60 days Total < 30 days 30-60 days > 60 days<br />
$m $m $m $m $m $m $m $m<br />
Trade receivables 329 329 - - 309 308 1 -<br />
Other receivables 230 194 3 33 222 157 13 52<br />
Dividends receivable 3 3 - - 2 2 - -<br />
Interest receivable 1 1 - - - - - -<br />
Total receivables 563 527 3 33 533 467 14 52<br />
Parent<br />
Other receivables 4,878 - - 4,878 2,675 - - 2,675<br />
Total receivables 4,878 - - 4,878 2,675 - - 2,675<br />
(1) No significant receivables are past due at the balance sheet date.<br />
(e) Financing facilities<br />
364-day revolving credit facilities<br />
The Group has three dual currency (US and Australian dollars) 364-day revolving credit facilities totalling US$200 million.<br />
Interest rates are based on LIBOR and are fixed at the commencement of the drawdown period. Interest is paid at the<br />
end of the drawdown period. The 364-day revolving credit facilities are subject to various covenants and a negative pledge<br />
restricting future secured borrowings, subject to a number of permitted lien exceptions. Neither the covenants nor the<br />
negative pledges have been breached at any time during the <strong>report</strong>ing period.<br />
Bi-lateral loan facilities<br />
The Group has 16 bi-lateral loan facilities, with 15 facilities totalling US$1,200 million and one facility totalling EUR€78<br />
million. The Euro facility has a two-year term and is not an evergreen facility. There are five facilities with a three-year<br />
term and all are evergreen facilities. The remaining ten facilities have a five-year term with nine being evergreen facilities.<br />
Evergreen facilities may be extended continually by a year subject to the bank's agreement. All facilities except two<br />
are dual currency facilities denominated in US dollars and Australian dollars, with six of these facilities also being multicurrency<br />
facilities. Of the other two facilities, one is denominated soley in US dollars and one is denominated soley in<br />
Euros. Interest rates are based on LIBOR and are fixed at the commencement of the drawdown period. The European<br />
Interbank Offered Rate (EURIBOR) is used for the Euro facility. Interest is paid at the end of the drawdown period. The bilateral<br />
loan facilities are subject to various covenants and a negative pledge restricting future secured borrowings, subject<br />
to a number of permitted lien exceptions. Neither the covenants nor the negative pledges have been breached at any time<br />
during the <strong>report</strong>ing period.
25. Financial and capital risk management (continued)<br />
(e) Financing facilities (continued)<br />
Notes to and forming part<br />
of the financial <strong>report</strong><br />
For the year ended 31 December 2009<br />
Bonds<br />
The Group has five unsecured bonds issued to ‘qualified institutional buyers’ in the United States of America as defined in<br />
Rule 144A of the US Securities Act 1933. These bonds include:<br />
• The 2011 US$300 million bond has a fixed rate coupon of 6.70% p.a. and matures on 1 August 2011;<br />
• The 2013 US$250 million bond has a fixed rate coupon of 5.00% p.a. and matures on 15 November 2013;<br />
• The 2014 US$400 million bond has a fixed rate coupon of 8.125% p.a. and matures on 1 March 2014;<br />
• The 2014 US$700 million bond has a fixed rate coupon of 4.50% p.a. and matures on 10 November 2014; and<br />
• The 2019 US$600 million bond has a fixed rate coupon of 8.75% p.a. and matures on 1 March 2019.<br />
Interest on the bonds is payable semi-<strong>annual</strong>ly in arrears. The bonds are subject to various covenants and a negative<br />
pledge restricting future secured borrowings, subject to a number of permitted lien exceptions. Neither the covenants<br />
nor the negative pledges have been breached at any time during the <strong>report</strong>ing period.<br />
Japan Bank for International Cooperation (JBIC) Facility<br />
On 24 June 2008, the Group entered into a committed loan facility totalling US$1,500 million (JBIC Facility). The<br />
JBIC Facility comprises a 15-year, US$1,000 million tranche with JBIC (JBIC Tranche), and a five-year, US$500 million<br />
commercial tranche with a syndicate of eight Australian and international banks arranged by The Bank of Tokyo-Mitsubishi<br />
UFJ, Ltd (Commercial Tranche). There is a prepayment option for both the Commercial Tranche and the JBIC Tranche.<br />
Interest rates are based on LIBOR. Interest is payable semi-<strong>annual</strong>ly in arrears on the JBIC Tranche and with a choice of<br />
one, two, three, six, nine or twelve months in arrears on the Commercial Tranche. Both tranches amortise on a straightline<br />
basis, with equal instalments of principal due on each interest payment date (every six months) starting on the earlier<br />
of 7 January 2012 or the first 7 January or 7 July to occur no less than 180 days after the commercial start date of the<br />
Pluto Liquefied Natural Gas (LNG) Project. Under the JBIC Facility, 90% of the receivables from designated Pluto LNG<br />
Project Sale and Purchase Agreements, are secured in favour of the lenders through a trust structure, with a required<br />
reserve amount of US$30 million. To the extent that this reserve amount remains fully funded, and no default notice<br />
or acceleration notice has been given, the revenue from the Pluto LNG Project continues to flow directly to the Group<br />
from the trust account. The JBIC Facility is subject to various covenants and a negative pledge restricting future secured<br />
borrowings, subject to a number of permitted lien exceptions. Neither the covenants nor the negative pledge has been<br />
breached at any time during the <strong>report</strong>ing period.<br />
Asian syndicated facility<br />
In May 2009, the Group entered into a syndicated loan totalling US$1,100 million equivalent with 26 banks. The syndicated<br />
loan has a term of three years and the joint coordinating arrangers were Australia and New Zealand Banking Group<br />
Limited and The Bank of Tokyo-Mitsubishi UFJ, Ltd. The facility has a US dollar component (Facility A) and a Japanese Yen<br />
component (Facility B). The interest rate for Facility A is based on LIBOR, and interest is payable semi-<strong>annual</strong>ly in arrears.<br />
The interest rate for Facility B is based on the Tokyo Interbank Offered Rate (TIBOR) and interest is payable semi-<strong>annual</strong>ly<br />
in arrears. The full US$1,100 million equivalent under this facility was drawn down on 1 June 2009. The syndicated loan<br />
is subject to various covenants, including a negative pledge restricting future secured borrowings, subject to a number<br />
of permitted lien exceptions. Neither the covenants nor the negative pledge has been breached at any time during the<br />
<strong>report</strong>ing period.<br />
Financial Report<br />
103
104<br />
Notes to and forming part<br />
of the financial <strong>report</strong><br />
For the year ended 31 December 2009<br />
25. Financial and capital risk management (continued)<br />
(f) Hedging and derivatives<br />
Interest rates<br />
The Group manages its exposure to interest rate risk by maintaining a mix of fixed rate and floating rate debt. In general,<br />
the fixed rate debt and floating rate debt ratio is managed through an appropriate choice of debt instrument. The Group<br />
may enter into interest rate swaps to manage the ratio of fixed rate debt to floating rate debt. Hedging is undertaken<br />
against specific interest rate exposures only.<br />
Instrument Notional amount Rate Expiry Hedge type 2009<br />
$m<br />
Interest<br />
rate swaps<br />
US$250<br />
million<br />
Receive 5% fixed<br />
Pay LIBOR less<br />
0.10%<br />
2013 Fair value hedge in 2006 -<br />
Designated to swap the 2013<br />
US$250 million bond from a fixed<br />
rate to floating rate exposure.<br />
De-designated as a fair value hedge<br />
on 1 January 2007.<br />
Fair value<br />
2008<br />
$m<br />
20 51<br />
Commodity prices<br />
The Group’s future revenue is exposed to commodity price fluctuations. The Group may enter into commodity price<br />
derivative instruments to manage this exposure.<br />
Instrument Notional<br />
volumes<br />
Crude oil<br />
zero cost<br />
collars<br />
Rate Expiry Hedge type 2009<br />
$m<br />
Fair value<br />
Sell Receive Cash flow hedge - Manages risk<br />
from anticipated oil production<br />
4,400,000 bbl US$55 – 75.94/bbl 2009<br />
receipts from projects in the Greater<br />
Exmouth area. Notional volumes<br />
amount to approximately 19% of total<br />
- 44<br />
anticipated production from 2009 to<br />
2010.<br />
(1)<br />
2,500,000 bbl US$55 – 73.68/bbl 2010 (32) (4)<br />
(1) $4 million was transferred from equity in 2008 due to hedge ineffectiveness.<br />
2008<br />
$m
25. Financial and capital risk management (continued)<br />
(g) Maturity profile of interest-bearing liabilities<br />
The maturity profile of the Group's interest-bearing liabilities as at 31 December 2008 were as follows:<br />
Notes to and forming part<br />
of the financial <strong>report</strong><br />
For the year ended 31 December 2009<br />
Due for payment in Total<br />
1 year or less 1-2 years 2-3 years 3-4 years 4-5 years More than<br />
5 years<br />
2008 $m $m $m $m $m $m $m<br />
Consolidated<br />
Interest-bearing liabilities (1) (79) (79) (513) (531) (883) (1,330) (3,415)<br />
(79) (79) (513) (531) (883) (1,330) (3,415)<br />
(1) Excludes deferred borrowing costs.<br />
Parent<br />
Interest-bearing liabilities - - - - - - -<br />
- - - - - - -<br />
The maturity profile of the Group's interest-bearing liabilities as at 31 December 2009 were as follows:<br />
Due for payment in Total<br />
1 year or less 1-2 years 2-3 years 3-4 years 4-5 years More than<br />
5 years<br />
2009 $m $m $m $m $m $m $m<br />
Consolidated<br />
Interest-bearing liabilities (1) (203) (689) (1,769) (793) (1,442) (1,800) (6,696)<br />
(203) (689) (1,769) (793) (1,442) (1,800) (6,696)<br />
(1) Excludes deferred borrowing costs.<br />
Parent<br />
Interest-bearing liabilities - - - - - - -<br />
- - - - - - -<br />
Financial Report<br />
105
106<br />
Notes to and forming part<br />
of the financial <strong>report</strong><br />
For the year ended 31 December 2009<br />
25. Financial and capital risk management (continued)<br />
(h) Fair values<br />
The Group uses various methods in estimating the fair value of a financial instrument. The methods comprise:<br />
• Level 1 - the fair value is calculated using quoted prices in active markets;<br />
• Level 2 - the fair value is estimated using inputs other than quoted prices included in Level 1 that are observable for<br />
the asset or liability; and<br />
• Level 3 - the fair value is estimated using inputs for the asset or liability that are not based on observable market<br />
data.<br />
The fair values of financial instruments and the methods used to estimate their fair values are as follows:<br />
Consolidated<br />
Quoted<br />
market<br />
price<br />
(Level 1)<br />
Valuation<br />
technique<br />
- market<br />
observable<br />
inputs<br />
(Level 2)<br />
2009 2008<br />
Valuation<br />
technique<br />
- non<br />
market<br />
observable<br />
inputs<br />
(Level 3)<br />
Total Quoted<br />
market<br />
price<br />
(Level 1)<br />
Valuation<br />
technique<br />
- market<br />
observable<br />
inputs<br />
(Level 2)<br />
Valuation<br />
technique<br />
- non<br />
market<br />
observable<br />
inputs<br />
(Level 3)<br />
$m $m $m $m $m $m $m $m<br />
Financial assets<br />
Derivative instruments: current - - - - - 44 - 44<br />
Derivative instruments: non current<br />
Other investments (available-for-sale):<br />
- 20 - 20 - 53 - 53<br />
listed entity investments 10 - - 10 5 - - 5<br />
Embedded derivatives - 61 - 61 - 73 - 73<br />
Financial liabilities<br />
Derivative instruments: current - (32) - (32) - - - -<br />
Derivative instruments: non current - - - - - (4) - (4)<br />
Parent<br />
Financial assets<br />
Derivative instruments: current - - - - - - - -<br />
Derivative instruments: non current<br />
Other investments (available-for-sale):<br />
- - - - - - - -<br />
listed entity investments - - - - - - - -<br />
Embedded derivatives - - - - - - - -<br />
Financial liabilities<br />
Derivative instruments: current - - - - - - - -<br />
Derivative instruments: non current - - - - - - - -<br />
Quoted market price represents the fair value determined based on quoted prices on active markets as at the <strong>report</strong>ing<br />
date. The fair value of the listed equity instruments are based on quoted market prices.<br />
For financial instruments not quoted in active markets, the Group uses valuation techniques comparable to similar<br />
instruments such as present value techniques for which market observable prices exist.<br />
Financial instruments that use valuation techniques with only observable market inputs, that are not significant to the<br />
overall valuation, include interest rate swaps, forward commodity contracts and embedded derivatives.<br />
Fair values of other financial assets and liabilities approximate their carrying values.<br />
Transfer between categories<br />
There were no transfers between Level 1 and Level 2 during the year.<br />
Total
25. Financial and capital risk management (continued)<br />
(i) Capital management<br />
Notes to and forming part<br />
of the financial <strong>report</strong><br />
For the year ended 31 December 2009<br />
The Group Treasury is responsible for the Group’s capital management including cash, debt and equity. This involves<br />
the use of corporate forecasting models, which facilitates analysis of the Group’s financial position including cash flow<br />
forecasts to determine the future capital management requirements. Capital management is undertaken to ensure that<br />
a secure, cost-effective and flexible supply of funds is available to meet the Group’s operating and capital expenditure<br />
requirements. The Group Treasury monitors gearing and treasury policy breaches and exceptions. The gearing ratio at the<br />
balance sheet date is 30% (2008: 29%).<br />
The Group Treasury maintains a stable capital base from which the Group can pursue its growth aspirations, whilst<br />
maintaining a flexible capital structure that allows access to a range of debt and equity markets to both draw upon and<br />
repay capital. An example of the Group’s capital management is the activation of the Dividend Reinvestment Plan (DRP)<br />
during a period of high capital expenditure.<br />
The DRP was approved by shareholders at the Annual General Meeting in 2003 for activation as required to fund future<br />
growth. The Group announced the activation of the DRP in December 2006 to manage capital requirements. The DRP was<br />
activated with the 2006 final dividend and deactivated for the 2007 final dividend. The DRP was reactivated in 2008 and<br />
remains activated for the 2009 final dividend.<br />
Financial Report<br />
107
108<br />
Notes to and forming part<br />
of the financial <strong>report</strong><br />
For the year ended 31 December 2009<br />
26. Expenditure commitments<br />
2009<br />
$m<br />
Consolidated Parent<br />
(a) Operating lease commitments<br />
Rentals payable on non-cancellable operating leases, due:<br />
Within one year 637 714 - -<br />
After one year but not more than five years 1,512 2,030 - -<br />
Later than five years 553 844 - -<br />
2,702 3,588 - -<br />
The Group leases assets for operations including: floating production, storage and off-take vessels, helicopters, supply<br />
vessels, cranes, land, mobile offshore drilling units, office premises and computers.<br />
There are no restrictions placed upon the lessee by entering into these leases. Renewals are at the option of the specific<br />
entity that holds the lease. Most leases contain a clause enabling upward revision of the rental charge on an <strong>annual</strong> basis<br />
based on the Consumer Price Index.<br />
The Group made payments under operating leases of $455 million during the year (2008: $539 million). A portion of this<br />
amount relates to arrangements containing non-lease elements, which are not practicable to separate.<br />
(b) Capital expenditure commitments<br />
Expenditure contracted for but not provided for in the accounts,<br />
due:<br />
Within one year 1,826 4,113 - -<br />
After one year but not more than five years 580 451 - -<br />
Later than five years 5 13 - -<br />
2,411 4,577 - -<br />
(c) Other expenditure commitments<br />
Other expenditure commitments predominantly for the future<br />
supply of services contracted for but not provided for in the<br />
accounts, due:<br />
Within one year 71 85 - -<br />
After one year but not more than five years 14 36 - -<br />
Later than five years 2 - - -<br />
87 121 - -<br />
(d) Exploration commitments<br />
Exploration expenditure obligations contracted for but not<br />
provided for in the accounts, due:<br />
Within one year 143 143 - -<br />
After one year but not more than five years 275 114 - -<br />
Later than five years 2 2 - -<br />
420 259 - -<br />
By region:<br />
Australia<br />
Browse Basin 27 17 - -<br />
Barrow Basin 102 113 - -<br />
Carnarvon Basin 249 47 - -<br />
Victoria 7 15 - -<br />
The Americas<br />
Gulf of Mexico 29 40 - -<br />
Peru 6 - - -<br />
Brazil - 6 - -<br />
Africa<br />
West Africa (Liberia) - 16 - -<br />
North Africa (Algeria, Libya) - 5 - -<br />
420 259 - -<br />
These obligations may be varied from time to time and are expected to be fulfilled in the normal course of operations of<br />
the Group.<br />
2008<br />
$m<br />
2009<br />
$m<br />
2008<br />
$m
27. Employee benefits<br />
(a) <strong>Woodside</strong> employee share plans<br />
Notes to and forming part<br />
of the financial <strong>report</strong><br />
For the year ended 31 December 2009<br />
(i) <strong>Woodside</strong> employee share plan<br />
During 2006, following a review of the Group’s total reward strategy across global operations, it was decided to<br />
close the <strong>Woodside</strong> Employee Share Plan (WESP) with the last allocation being made to employees in August 2006.<br />
On announcement of closure, unrestricted possession (full entitlement) of these shares was provided immediately<br />
to employees. Employees were required to repay or refinance WESP loans by 31 December 2009. The value of<br />
the outstanding loans as at the <strong>report</strong>ing date is $23 million. For employees who have not settled their loans,<br />
the process of selling shares and settling outstanding loans will be managed by <strong>Woodside</strong>. The timing of when<br />
<strong>Woodside</strong> will enforce its rights under the WESP and instruct the Plan Manager to sell the shares will be subject to<br />
the Securities Dealing Policy and <strong>Woodside</strong>'s legal obligations.<br />
Under the WESP, eligible employees were granted loans for the on-market purchase of shares in <strong>Woodside</strong><br />
Petroleum Ltd. The loans were interest-free, limited-recourse, were reduced by the application of dividends (after<br />
taking into account employee liability for tax on those dividends) and were repayable upon the sale of shares or<br />
termination of the employee. Before closing the WESP, the Group assessed incremental loan offer entitlements in<br />
accordance with pre-established criteria based on remuneration levels.<br />
WESP participants receive all of the rights of ordinary shareholders. Where the loan is repaid by the sale of shares,<br />
any remaining surplus on sale is paid to the employee while any shortfall is borne by the Group.<br />
Awards to employees under WESP are accounted for as share-based payments to employees for services provided.<br />
The fair value of the benefit provided was estimated on issue using the binomial option pricing model.<br />
The following table illustrates the number and weighted average prices of shares reserved, acquired and redeemed<br />
during the year under the WESP on behalf of employees.<br />
Number of<br />
shares<br />
2009 2008<br />
Weighted<br />
average<br />
price (1)<br />
Cost<br />
Number of<br />
shares<br />
Weighted<br />
average price<br />
Cost<br />
($/share) $m ($/share) $m<br />
Opening balance 4,048,816 23.31 94 5,572,498 22.21 124<br />
Redemptions during the year (2,966,278) 17.34 (51) (1,523,682) 19.28 (29)<br />
Closing balance 1,082,538 39.68 43 4,048,816 23.31 94<br />
Less cumulative dividends applied (20) - - (17)<br />
Shares reserved for employees 1,082,538 21.03 23 4,048,816 19.34 78<br />
Shares eligible for unrestricted<br />
possession<br />
(1) The weighted average share price for <strong>Woodside</strong> Petroleum Ltd during the year was $42.67.<br />
1,082,538 39.68 43 4,048,816 23.31 94<br />
Financial Report<br />
109
110<br />
Notes to and forming part<br />
of the financial <strong>report</strong><br />
For the year ended 31 December 2009<br />
27. Employee benefits (continued)<br />
(a) <strong>Woodside</strong> employee share plans (continued)<br />
(ii) <strong>Woodside</strong> share purchase plan<br />
The <strong>Woodside</strong> Share Purchase Plan (WSPP) was introduced in April 2007 and was available to all employees,<br />
including executives up to March 2009. The plan was suspended in April 2009 due to uncertainty regarding the<br />
future operation of the plan created by proposed taxation legislation changes announced in the 2009 Federal<br />
budget. The WSPP provided eligible employees with an opportunity to acquire <strong>Woodside</strong> shares and to share in the<br />
growth of the company. The WSPP year was based on a 1 July to 30 June period (WSPP Year).<br />
Participants in the WSPP elected to salary sacrifice an amount of base salary, and this amount was applied by the<br />
WSPP Trustee to purchase shares in <strong>Woodside</strong> Petroleum Ltd. Additional shares were granted (matching shares)<br />
at a fixed <strong>annual</strong> ratio of the shares awarded for the salary sacrifice amount. In the 2008/09 WSPP Year, the ratio<br />
was one for one and a half; the ratio for the 2007/08 WSPP Year was one for one. Conditions applied in order for<br />
employees to become entitled to the matching shares.<br />
Share acquisitions under the WSPP for the employee sacrificed amounts are made quarterly in arrears. The shares<br />
are purchased by the Trustee on market by dividing the sacrificed amount by the volume weighted average price<br />
paid for all the shares purchased for participating employees. The sacrificed amount is rounded down to the nearest<br />
whole share. Any amount not used is carried forward and applied to the sacrificed amount for the next quarter. Any<br />
balance at the end of the specified sacrifice period (normally 12 months) is paid to the participant or carried over to<br />
the next sacrifice period if the employee elects to participate. If employment ceases (for whatever reason) during a<br />
quarter or after the end of a quarter, but before any shares have been purchased in respect of the quarter, no shares<br />
are transferred to the participant in relation to that quarter.<br />
In order for the matching shares to beneficially vest to the participating employees in the WSPP, the employee<br />
needs to hold shares purchased through the sacrificed amount for three years and remain employed at the end of<br />
that qualification period.<br />
Matching shares are purchased on a quarterly basis at the same time as the shares are purchased using the<br />
employee’s sacrificed amount.<br />
If employment ceases because of resignation or termination before the end of the three-year qualification period,<br />
the participant forfeits their interest in any matching shares. Shares acquired using any sacrificed amount are<br />
released to the participant.<br />
The WSPP had 1,650 employees participating at 31 December 2009.<br />
Matching shares acquired under the WSPP are accounted for as share-based payments to employees for service<br />
provided and are measured at fair value, being the share price on acquisition date.<br />
Grant date Matching shares acquired Shares at acquisition date Employee benefit<br />
fair value<br />
($) ($/share)<br />
2009<br />
January 162,748 35.21 35.21<br />
March 153,666 38.60 38.60<br />
2008<br />
March 59,350 55.93 55.93<br />
June 53,078 62.86 62.86<br />
June 16,419 63.63 63.63<br />
October 119,067 52.82 52.82
27. Employee benefits (continued)<br />
(a) <strong>Woodside</strong> employee share plans (continued)<br />
(iii) <strong>Woodside</strong> employee equity plan<br />
Notes to and forming part<br />
of the financial <strong>report</strong><br />
For the year ended 31 December 2009<br />
In July 2009 <strong>Woodside</strong> introduced the <strong>Woodside</strong> Petroleum Ltd 2009 - 2012 Employee Equity Plan (EEP) which<br />
is available to all employees including executives, other than the CEO. The EEP is intended to provide a retention<br />
mechanism for participating employees as well as provide an opportunity to share in the growth of the company.<br />
The Equity Rights (ERs) are a form of remuneration that is not dependent on employee's individual performance or<br />
<strong>Woodside</strong>'s performance. The EEP has 2,764 employees participating at 31 December 2009.<br />
Eligible participants are entitled to receive an allocation of ERs. Each ER entitles the participants to receive a<br />
<strong>Woodside</strong> share on vesting. The ERs will vest on 1 August 2012 (in the absence of any accelerating event,<br />
including a change of control) if the employee is still employed by <strong>Woodside</strong> on 31 July 2012. An employee whose<br />
employment is terminated by resignation, retirement or for cause prior to 31 July 2012 will forfeit all of their ERs.<br />
Shares will either be issued by the company or acquired on market to satisfy vesting ER entitlements. The number<br />
of ERs that vest may be adjusted for any interruptions to an employee's service. Participants in the EEP cannot<br />
dispose of or otherwise deal with an ER and do not receive any dividends or have voting rights in respect of an ER.<br />
Allocations of ERs to participants will be adjusted in the event of the company making a bonus issue of shares or<br />
upon reconstruction of the company's share capital.<br />
As a consequence of the renounceable rights issue by <strong>Woodside</strong> in December 2009, the Board resolved to issue<br />
additional ERs under the EEP to maintain the value of the ERs held by participating employees. An additional<br />
allocation of ERs will be granted to each participant in early 2010. The same terms and conditions which apply to<br />
existing ERs will apply to these additional ERs.<br />
The EEP is accounted for as a share-based payment to employees for services provided. The fair value of the benefit<br />
provided is estimated using the Black-Scholes option pricing technique.<br />
Grant date Vesting date Equity rights<br />
granted<br />
Share price at grant<br />
date<br />
($)<br />
Employee benefit<br />
fair value<br />
($/ER)<br />
Valuation<br />
assumption<br />
Expected dividend<br />
return<br />
(%)<br />
31 October 2009 1 August 2012 5,936,722 47.70 44.56 2.5<br />
30 December 2009 1 August 2012 219,143 47.35 44.42 2.5<br />
7,826 ERs have been forfeited during the year. No ERs have vested. Total ERs outstanding at 31 December 2009 are<br />
6,148,039.<br />
(b) Executive share plans<br />
The Executive Incentive Plan (EIP) and Pay Rights (PR) Plans became effective 1 January 2005 and 15 March 2007<br />
respectively. For further details regarding the EIP, Pay Rights Plans and the Group’s remuneration structure for the CEO<br />
and senior executives refer to the Remuneration Report included in the 2009 Directors’ Report.<br />
The following table illustrates the number and weighted average prices of shares reserved and acquired during the year by<br />
the plan.<br />
Number of<br />
shares<br />
2009 2008 (1)<br />
Weighted<br />
average price<br />
Cost Number of<br />
shares<br />
Weighted<br />
average price<br />
Cost<br />
($/share) $m ($/share) $m<br />
Opening balance 880,749 46.88 41 624,666 40.50 25<br />
Purchases during the year - - - 363,386 57.84 21<br />
Vested during the year (230,099) 46.88 (11) (107,303) 46.88 (5)<br />
Shares reserved for executives<br />
under EIP/PR 650,650 46.86 30 880,749 46.88 41<br />
(1) 2008 figures have been restated to correctly reflect the number of shares.<br />
Financial Report<br />
111
112<br />
Notes to and forming part<br />
of the financial <strong>report</strong><br />
For the year ended 31 December 2009<br />
27. Employee benefits (continued)<br />
(b) Executive share plans (continued)<br />
The EIP is accounted for as a share-based payment to employees for services provided. The fair value of the benefit provided was estimated using the Binomial or Black-Scholes<br />
option pricing technique combined with a Monte Carlo simulation methodology, where relevant. Historical volatility has been used to estimate the volatility of the share price.<br />
EIP Time-tested variable pay rights (VPRs)<br />
Valuation<br />
assumption<br />
Expected<br />
dividend yield<br />
Employee<br />
benefit<br />
fair value<br />
Share price at<br />
grant date<br />
On issue at end<br />
of year<br />
Forfeited/<br />
lapsed during<br />
the year<br />
Vested during<br />
the year<br />
Granted during<br />
the year<br />
Grant date Vesting date On issue at<br />
beginning of<br />
year<br />
Performance<br />
year<br />
($) ($/VPR) (%)<br />
2005 1 January 2005 13 March 2009 42,544 - (42,544) - - 20.10 17.75 3.0<br />
2006 1 January 2006 15 March 2010 47,531 - (1,337) (1,253) 44,941 39.19 34.61 3.0<br />
2007 1 January 2007 14 March 2011 68,195 - (3,543) (3,087) 61,565 38.11 33.66 3.0<br />
2008 1 January 2008 27 February 2012 121,532 - (2,689) (2,542) 116,301 50.39 44.56 3.0<br />
2009 1 January 2009 5 March 2013 - 144,846 - - 144,846 36.70 33.10 2.5<br />
EIP Time-tested VPRs - additional allocation following renounceable rights issue<br />
As a consequence of the renounceable rights issue by the Group in December 2009, the Board exercised its discretion under the EIP plan rules to adjust the number of VPRs<br />
held by participants to maintain the value equivalence of the unvested VPR awards made for the 2006, 2007 and 2008 performance years.<br />
Valuation<br />
assumption<br />
Expected<br />
dividend yield<br />
Employee<br />
benefit<br />
fair value<br />
Share price at<br />
grant date<br />
On issue at end<br />
of year<br />
Forfeited/<br />
lapsed during<br />
the year<br />
Vested during<br />
the year<br />
Granted during<br />
the year<br />
Grant date Vesting date On issue at<br />
beginning of<br />
year<br />
Performance<br />
year<br />
($) ($/VPR) (%)<br />
2006 13 December 2009 15 March 2010 - 373 - - 373 47.18 46.89 2.5<br />
2007 13 December 2009 14 March 2011 - 511 - - 511 47.18 45.75 2.5<br />
2008 13 December 2009 27 February 2012 - 965 - - 965 47.18 44.68 2.5
27. Employee benefits (continued)<br />
(b) Executive share plans (continued)<br />
EIP relative total shareholder return/total shareholder return (RTSR/TSR) tested VPRs<br />
Valuation assumptions<br />
Expected<br />
dividend<br />
yield<br />
Risk free<br />
interest<br />
rate<br />
Expected<br />
volatility<br />
Employee<br />
benefit<br />
fair value<br />
Share price<br />
at<br />
grant date<br />
On issue at<br />
end of year<br />
Forfeited/<br />
lapsed during<br />
the year<br />
Vested<br />
during the<br />
year<br />
Granted<br />
during the<br />
year<br />
Grant date Vesting dates On issue at<br />
beginning of<br />
year<br />
Performance<br />
year<br />
($) ($/VPR) (%) (%) (%)<br />
2005 1 January 2005 13 March 2009 130,860 - (129,159) (1,701) - 20.10 9.07 23 5.2 3.0<br />
13 March 2011<br />
2006 1 January 2006 15 March 2010 110,238 - - (2,507) 107,731 39.19 17.71 24 5.2 3.0<br />
15 March 2012<br />
2007 1 January 2007 14 March 2011 167,694 - - (7,107) 160,587 38.11 22.64 25 6.0 3.0<br />
14 March 2012<br />
2008 1 January 2008 27 February 2012 251,730 - - (6,842) 244,888 50.39 29.78 26 6.6 3.0<br />
27 February 2013<br />
2008 19 February 2008 31 March 2011 81,606 - - - 81,606 51.26 31.30 28 4.5 3.0<br />
2009 1 January 2009 5 March 2013 - 179,593 - - 179,593 36.70 22.40 35 3.6 2.5<br />
5 March 2014<br />
EIP RTSR-tested VPR valuation - post long term incentive peer group modification on 8 December 2009<br />
As a consequence of the merger between Petro-Canada and Suncor in August 2009, Petro-Canada was deleted from the peer group for the purposes of the long term awards<br />
relating to the 2007 and 2008 performance years, leaving only ten comparator companies. For the 2009 performance year, Inpex Corporation has been added to the peer group.<br />
Notes to and forming part<br />
of the financial <strong>report</strong><br />
For the year ended 31 December 2009<br />
Valuation assumptions<br />
Expected dividend<br />
yield<br />
Expected volatility Risk free<br />
interest rate<br />
Incremental employee<br />
benefit fair value<br />
Grant date Employee benefit<br />
fair value<br />
Performance<br />
year<br />
($/VPR) ($/VPR) (%) (%) (%)<br />
2007 1 January 2007 32.67 10.03 46 4.7 2.5<br />
2008 1 January 2008 27.58 (2.20) 41 5.0 2.5<br />
2008 19 February 2008 32.67 1.37 46 5.3 2.5<br />
2009 1 January 2009 29.34 6.94 39 5.1 2.5<br />
Financial Report<br />
113
114<br />
Notes to and forming part<br />
of the financial <strong>report</strong><br />
For the year ended 31 December 2009<br />
27. Employee benefits (continued)<br />
(b) Executive share plans (continued)<br />
EIP RTSR-TSR-tested VPRs - additional allocation following renounceable rights issue<br />
As a consequence of the renounceable rights issue by the Group in December 2009, the Board exercised its discretion under the EIP plan rules to adjust the number of VPRs<br />
held by participants to maintain the value equivalence of the unvested VPR awards made for the 2006, 2007 and 2008 performance years.<br />
Valuation assumptions<br />
Expected<br />
dividend<br />
yield<br />
Risk free<br />
interest<br />
rate<br />
Expected<br />
volatility<br />
Employee<br />
benefit<br />
fair value<br />
Share<br />
price at<br />
grant date<br />
On issue at<br />
end of year<br />
Forfeited/<br />
lapsed<br />
during the<br />
year<br />
Vested<br />
during the<br />
year<br />
Granted<br />
during the<br />
year<br />
Grant date Vesting dates On issue at<br />
beginning<br />
of year<br />
Performance<br />
year<br />
($) ($/VPR) (%) (%) (%)<br />
2006 13 December 2009 15 March 2010 - 894 - - 894 47.18 37.31 46 4.7 2.5<br />
15 March 2012<br />
2007 13 December 2009 14 March 2011 - 1,333 - - 1,333 47.18 31.26 46 4.7 2.5<br />
14 March 2012<br />
2008 13 December 2009 27 February 2012 - 2,033 - - 2,033 47.18 26.37 41 5.0 2.5<br />
27 February 2013<br />
2008 13 December 2009 31 March 2011 - 678 - - 678 47.18 31.26 46 5.3 2.5<br />
Pay rights<br />
Pay rights are accounted for as a share-based payment, with fair value estimated using the Binomial or Black Scholes option pricing technique combined with a Monte Carlo<br />
simulation methodology, where relevant. Historical volatility has been used to estimate the volatility of the share price.<br />
Valuation assumptions<br />
Expected<br />
dividend<br />
yield (2)<br />
Risk free<br />
interest<br />
rate 2)<br />
Expected<br />
volatility (2)<br />
Employee<br />
benefit<br />
fair value (2)<br />
Share price at<br />
grant date<br />
On issue at<br />
end of year<br />
Forfeited/<br />
lapsed during<br />
the year<br />
Vested during<br />
the year<br />
Granted<br />
during the<br />
year<br />
Grant date Vesting dates On issue at<br />
beginning of<br />
year<br />
Performance<br />
year (1)<br />
($) ($/VPR) (%) (%) (%)<br />
2007 15 March 2007 15 March 2008, 136,161 - (65,578) (16,108) 54,475 36.30 34.22 - - 3.0<br />
15 March 2009,<br />
15 March 2010<br />
2007 1 November 2007 15 March 2009, 41,110 - (13,705) - 27,405 52.24 26.67 27 6.8 3.0<br />
15 March 2010,<br />
15 March 2011<br />
2008 5 May 2008 5 March 2010, 40,272 - - (4,378) 35,894 59.22 29.64 31 6.5 3.0<br />
5 March 2011,<br />
5 March 2012<br />
(1) Pay rights granted on 15 March 2007 are time-tested, pay rights granted on 1 November 2007 and 5 May 2008 are RTSR-tested.<br />
(2) Valuation assumptions and employee benefit fair values are based on weighted averages.
27. Employee benefits (continued)<br />
(b) Executive share plans (continued)<br />
Pay rights RTSR-tested valuation - post long term incentive peer group modification on 8 December 2009<br />
As a consequence of the merger between Petro-Canada and Suncor in August 2009, Petro-Canada was deleted from the peer group for the purposes of the long term awards<br />
relating to the 2007 and 2008 performance years, leaving only ten comparator companies.<br />
Valuation assumptions<br />
Expected<br />
dividend<br />
yield (1)<br />
Risk free<br />
interest<br />
rate (1)<br />
Expected<br />
volatility (1)<br />
Incremental<br />
employee<br />
benefit fair<br />
value (1)<br />
Grant date Vesting dates Employee<br />
benefit<br />
fair value (1)<br />
Performance<br />
year<br />
($/VPR) ($/VPR) (%) (%) (%)<br />
2007 1 November 2007 15 March 2010, 34.92 8.25 37 4.1 2.5<br />
15 March 2011<br />
2008 5 May 2008 5 March 2010 , 33.08 3.44 40 4.3 2.5<br />
5 March 2011,<br />
5 March 2012<br />
(1) Valuation assumptions and employee benefit fair values are based on weighted averages.<br />
Pay rights - additional allocation following renounceable rights issue<br />
As a consequence of the renounceable rights issue by the Group in December 2009, the Board exercised its discretion under the Pay Rights Plan rules to adjust the number of<br />
VPRs held by participants to maintain the value equivalence of the unvested VPRs for the 2006, 2007 and 2008 performance years.<br />
Valuation assumptions<br />
Expected<br />
dividend<br />
yield (1)<br />
Risk free<br />
interest<br />
rate (1)<br />
Expected<br />
volatility (1)<br />
Employee<br />
benefit<br />
fair value (1)<br />
Share price at<br />
grant date<br />
On issue at<br />
end of year<br />
Forfeited/<br />
lapsed during<br />
the year<br />
Vested during<br />
the year<br />
Granted<br />
during the<br />
year<br />
Grant date Vesting dates On issue at<br />
beginning of<br />
year<br />
Performance<br />
year<br />
Notes to and forming part<br />
of the financial <strong>report</strong><br />
For the year ended 31 December 2009<br />
($) ($/VPR) (%) (%) (%)<br />
2007 13 December 2009 15 March 2010 - 451 - - 451 47.18 46.89 - - 2.5<br />
2007 13 December 2009 15 March 2010 , - 220 - - 220 47.18 33.02 37 4.1 2.5<br />
15 March 2011<br />
2008 13 December 2009 5 March 2010 , - 294 - - 294 47.18 31.73 40 4.3 2.5<br />
5 March 2011,<br />
5 March 2012<br />
(1) Valuation assumptions and employee benefit fair values are based on weighted averages.<br />
Financial Report<br />
115
116<br />
Notes to and forming part<br />
of the financial <strong>report</strong><br />
For the year ended 31 December 2009<br />
27. Employee benefits (continued)<br />
(c) Superannuation plan<br />
Employees of the Group may be entitled to superannuation benefits on retirement, disability, death or withdrawal<br />
under the Group’s Superannuation Plan. The Group has one funded plan with a defined benefit section and a defined<br />
contribution section.<br />
The defined benefit section of the plan is closed to new members. All new members receive accumulation only benefits.<br />
The defined contribution section receives fixed contributions from Group companies and the Group’s legal or constructive<br />
obligation is limited to these contributions.<br />
(i) Defined benefit superannuation plan<br />
The Group has a legal obligation to settle defined benefit plan deficits however, these do not need to be settled with<br />
an immediate contribution or additional one-off contribution. Any defined benefit plan surplus may only be used to<br />
reduce future contributions from the Group.<br />
The present value of the defined benefit obligation has been determined using the projected unit credit method.<br />
Employer contributions<br />
Employer contributions to the defined benefit section of the plan are based on recommendations by the plan’s<br />
actuary. Actuarial assessments are made at no more than yearly intervals, and the last such assessment was made<br />
as at 31 December 2009.<br />
Funding method<br />
The objective of funding is to ensure that the benefit entitlements of members and other beneficiaries are fully<br />
funded by the time they become payable. To achieve this objective, the actuary has adopted a method of funding<br />
benefits known as the ‘attained age normal’ method. This funding method seeks to have benefits funded by means<br />
of a total contribution which is expected to be a constant percentage of members’ salaries over their working<br />
lifetimes.<br />
Using the funding method described above, in October 2008 the actuary recommended that the payment of<br />
employer contributions to the fund recommence. The Group recommenced contributions to the defined benefit<br />
section of the plan based on actuary recommended contribution rates for the respective groups of employees from<br />
1 November 2008. Total employer contributions paid by Group companies for the year ending 31 December 2009<br />
were $12 million.<br />
(ii) Defined benefit plan asset/(liability) included in the statement of financial position<br />
2009<br />
$m<br />
Consolidated<br />
Present value of the defined benefit obligation (149) (167)<br />
Fair value of defined benefit plan assets 133 120<br />
Net benefit liability - non-current (16) (47)<br />
(iii) Defined benefit plan categories of plan assets<br />
The major categories of plan assets are as follows:<br />
2009<br />
%<br />
Consolidated<br />
Cash 13 11<br />
Australian equity 33 29<br />
International equity 28 27<br />
Fixed income 10 10<br />
Property 9 13<br />
Other 7 10<br />
2008<br />
$m<br />
2008<br />
%<br />
100 100
27. Employee benefits (continued)<br />
(c) Superannuation plan (continued)<br />
(iv) Defined benefit plan reconciliations<br />
Reconciliation of the present value of the defined benefit obligation, which is fully funded:<br />
Notes to and forming part<br />
of the financial <strong>report</strong><br />
For the year ended 31 December 2009<br />
2009<br />
$m<br />
Consolidated<br />
Balance at 1 January (167) (151)<br />
Current service cost (13) (12)<br />
Interest on obligation (7) (9)<br />
Actuarial gain/(loss) 21 (15)<br />
Plan participants’ contributions (4) (5)<br />
Benefits, administrative expenses, premiums and tax paid 21 25<br />
Defined benefit obligation at 31 December (149) (167)<br />
Reconciliation of the fair value of plan assets:<br />
Balance at 1 January 120 174<br />
Expected return on plan assets 9 12<br />
Actuarial gain/(loss) 9 (51)<br />
Employer contributions 12 5<br />
Plan participants’ contributions 4 5<br />
Benefits, administrative expenses, premiums and tax paid (21) (25)<br />
Fair value of plan assets at 31 December 133 120<br />
(v) Defined benefit plan amounts recognised in income statement<br />
The amounts recognised in the income statement are as follows:<br />
Current service cost (13) (12)<br />
Interest on obligation (7) (9)<br />
Expected return on plan assets 9 12<br />
Net actuarial gain/(loss) recognised in year 12 (39)<br />
Defined benefit plan expense 1 (48)<br />
(vi) Defined benefit plan principal actuarial assumptions<br />
The principal actuarial assumptions used as at the balance sheet date for the purpose of calculating the present<br />
value of the defined benefit obligation were as follows:<br />
Financial year<br />
2009 2008<br />
Discount rate – active members 5.70% p.a. 3.50% p.a.<br />
Discount rate – pensioners 5.70% p.a. 3.90% p.a.<br />
Expected rate of return on plan assets – active members 7.00% p.a. 7.00% p.a.<br />
Expected rate of return on plan assets – pensioners 8.00% p.a. 8.00% p.a.<br />
Expected salary increase rate 5.00% p.a. 5.00% p.a.<br />
The expected rate of return on plan assets is determined by weighting the expected long-term return for each asset<br />
class by the benchmark allocation of assets to each class. The returns for each asset class are net of investment tax<br />
and investment fees.<br />
2008<br />
$m<br />
Financial Report<br />
117
118<br />
Notes to and forming part<br />
of the financial <strong>report</strong><br />
For the year ended 31 December 2009<br />
27. Employee benefits (continued)<br />
(c) Superannuation plan (continued)<br />
(vii) Defined benefit plan historical information<br />
2009<br />
$m<br />
Financial year<br />
Present value of defined benefit obligation (1) 149 167 151 127 118<br />
Fair value of plan assets 133 120 174 175 158<br />
(Deficit)/surplus in plan (16) (47) 23 49 40<br />
Experience adjustments (loss)/gain - plan assets 9 (51) (1) 12 12<br />
Experience adjustments (loss)/gain - plan liabilities 5 (1) (10) (6) 1<br />
(1) Includes any provision for contribution tax on plan surplus or deficit.<br />
(d) Employee benefits expense<br />
2009<br />
$m<br />
2008<br />
$m<br />
2007<br />
$m<br />
2006<br />
$m<br />
2005<br />
$m<br />
Consolidated Parent<br />
Employee benefits 157 147 1 1<br />
Defined contribution plan costs 16 19 - -<br />
Defined benefit plan expense (1) 48 - -<br />
28. Key management personnel compensation<br />
(a) Compensation of key management personnel<br />
2008<br />
$m<br />
Key management personnel (KMP) compensation for the financial year was as follows:<br />
2009<br />
$m<br />
2008<br />
$m<br />
172 214 1 1<br />
2009<br />
$m<br />
Consolidated Parent<br />
Short-term employee benefits 14,510,094 11,520,215 5,796,146 4,460,058<br />
Post employment benefits 549,263 360,953 - 12,292<br />
Termination/sign on benefits 126,819 1,449,844 - -<br />
Share-based payment 4,973,726 4,963,225 2,547,193 2,462,071<br />
2008<br />
$m<br />
2009<br />
$m<br />
2008<br />
$m<br />
20,159,902 18,294,237 8,343,339 6,934,421
28. Key management personnel compensation (continued)<br />
(b) Key management personnel shareholdings<br />
Notes to and forming part<br />
of the financial <strong>report</strong><br />
For the year ended 31 December 2009<br />
Details of shares held by KMP including their personally related entities (1) for the financial year are as follows:<br />
Opening<br />
holding (3)<br />
2009 2008 (2)<br />
NEDSP (4) Acquisition/<br />
(disposal) (5)<br />
Closing<br />
holding<br />
Opening<br />
holding (3)<br />
NEDSP (4) Acquisition/<br />
(disposal) (5)<br />
Closing<br />
holding<br />
Non-executive directors<br />
M A Chaney 20,000 - - 20,000 20,000 - - 20,000<br />
E Fraunschiel 75,626 - - 75,626 74,552 - 1,074 75,626<br />
A Jamieson 3,000 - - 3,000 3,000 - - 3,000<br />
P J M H Jungels 8,973 232 - 9,205 8,454 519 - 8,973<br />
D I McEvoy 2,564 - 4,369 6,933 2,526 - 38 2,564<br />
D Megat 597 445 - 1,042 - 597 - 597<br />
I Robertson (6) - - - - - - - -<br />
M Cilento (7) - - - - - - - -<br />
J R Broadbent (8) 48,620 435 (5,163) 43,892<br />
J Stausholm (8) - - - -<br />
Executives<br />
D Voelte 69,902 - 63,686 133,588 69,528 - 374 69,902<br />
M Chatterji 12,950 - 19,723 32,673 144 - 12,806 (9) 12,950<br />
R Cole 4,505 - 4,399 8,904 124 - 4,381 4,505<br />
E Howell 5,893 - 4,872 10,765 1,032 - 4,861 5,893<br />
A J Kantsler 113,138 - 31 113,169 106,361 - 6,777 113,138<br />
V Santostefano 3,946 - 8,411 12,357 124 - 3,822 3,946<br />
L Della Martina 44,959 - 8,234 53,193 40,857 - 4,102 44,959<br />
F Ahmed (10) 2,500 - - 2,500<br />
B Donaghey (10)(11) 27,528 - 5,508 33,036<br />
(1) Personally related entities include a KMP's spouse, dependants or entities over which they have direct control or significant influence.<br />
(2) 2008 figures have been restated to correctly reflect shareholdings.<br />
(3) Opening holding represents amounts carried forward in respect of KMP or amounts held by KMP who commenced during the year.<br />
(4) Relates to participation in the Non-Executive Directors’ Share Plan (NEDSP).<br />
(5) Includes awards vested during the year under the employee share plans and acquired and matching shares under the WSPP.<br />
(6) Mr Robertson was appointed on 30 June 2008.<br />
(7) Ms Cilento was appointed on 11 December 2008.<br />
(8) Ms Broadbent retired as director on 4 July 2008. Mr Stausholm resigned as director on 30 June 2008. The directors’ closing shareholding represents the amount of shares<br />
held at the date of cessation of being a director.<br />
(9) Includes 3,674 Equity Linked Cash Incentives (ELCI’s), which were granted in April 2005, in respect of Mr Chatterji’s Long Term Incentive award for the 2004 performance<br />
year, before the introduction of the Executive Incentive Plan (EIP). In April 2008, the Board approved that the ELCI’s be satisfied through an allocation of WPL shares, which<br />
can be held in the EIP Trust, rather than via a cash payment.<br />
(10) Mr Ahmed and Ms Donaghey did not meet the definition of KMP under AASB 124 for the 2008 financial year but are considered KMP for 2009. 2008 comparative figures<br />
are not shown.<br />
(11) Ms Donaghey departed <strong>Woodside</strong> on 31 October 2009.<br />
Financial Report<br />
119
120<br />
Notes to and forming part<br />
of the financial <strong>report</strong><br />
For the year ended 31 December 2009<br />
28. Key management personnel compensation (continued)<br />
(c) Executives’ interests in variable pay rights (VPR) and pay rights (PR) and equity rights (ER)<br />
VPR and PR holdings of key management personnel (consolidated)<br />
2009<br />
Name Balance at<br />
beginning<br />
of period<br />
1 January 2009<br />
Allocated in 2009 Vested in 2009 Net change -<br />
other<br />
Balance at end of<br />
period<br />
31 December 2009<br />
D Voelte 254,937 69,538 (63,291) - 261,184<br />
F Ahmed 9,136 15,987 (2,031) - 23,092<br />
M Chatterji 57,617 26,486 (19,044) - 65,059<br />
R Cole 18,737 17,775 (4,004) - 32,508<br />
L Della Martina 21,877 13,005 (7,839) - 27,043<br />
B Donaghey 20,500 7,705 (5,508) (22,697) (1) -<br />
E Howell 17,121 15,549 (4,843) - 27,827<br />
A Kantsler 37,398 19,769 (16,351) - 40,816<br />
V Santostefano 20,577 12,975 (8,016) - 25,536<br />
2008<br />
Name Balance at<br />
beginning<br />
of period<br />
1 January 2008<br />
Allocated in 2008 Vested in 2008 Net change -<br />
other<br />
Balance at end of<br />
period<br />
31 December 2008<br />
D Voelte 123,658 131,279 - - 254,937<br />
F Ahmed 6,091 3,045 - - 9,136<br />
M Chatterji 56,783 13,266 (12,432) - 57,617<br />
R Cole 16,126 6,618 (4,007) - 18,737<br />
L Della Martina 20,447 5,158 (3,728) - 21,877<br />
B Donaghey 20,283 4,875 (4,658) - 20,500<br />
E Howell 16,108 5,859 (4,846) - 17,121<br />
A Kantsler 34,344 9,577 (6,523) - 37,398<br />
V Santostefano 18,891 5,134 (3,448) - 20,577<br />
(1) Ms Donaghey's PRs and VPRs were forfeited upon her departure on 31 October 2009.
28. Key management personnel compensation (continued)<br />
(d) Summary of Executives’ interests in shares under the <strong>Woodside</strong> Share Purchase Plan (WSPP)<br />
Name Plan type Opening balance Shares purchased<br />
under WSPP<br />
D Voelte<br />
M Chatterji<br />
R Cole<br />
E Howell<br />
A Kantsler<br />
V Santostefano<br />
L Della Martina (1)<br />
F Ahmed (2)<br />
B Donaghey (2)<br />
Notes to and forming part<br />
of the financial <strong>report</strong><br />
For the year ended 31 December 2009<br />
Matching shares Closing balance<br />
2009 WSPP 498 158 237 893<br />
2008 WSPP 124 173 201 498<br />
2007 WSPP - 62 62 124<br />
2009 WSPP 498 158 237 893<br />
2008 WSPP 124 173 201 498<br />
2007 WSPP - 62 62 124<br />
2009 WSPP 498 158 237 893<br />
2008 WSPP 124 173 201 498<br />
2007 WSPP - 62 62 124<br />
2009 WSPP - - - -<br />
2008 WSPP - - - -<br />
2007 WSPP - - - -<br />
2009 WSPP 358 - - 358<br />
2008 WSPP 124 117 117 358<br />
2007 WSPP - 62 62 124<br />
2009 WSPP 498 158 237 893<br />
2008 WSPP 124 173 201 498<br />
2007 WSPP - 62 62 124<br />
2009 WSPP 498 158 237 893<br />
2008 WSPP 124 173 201 498<br />
2007 WSPP - - - -<br />
2009 WSPP - - - -<br />
2008 WSPP - - - -<br />
2007 WSPP - - - -<br />
2009 WSPP - - - -<br />
2008 WSPP - - - -<br />
2007 WSPP - - - -<br />
(1) Mr Della Martina did not meet the definition of KMP under AASB 124 for previous years but did fall within the definition for 2008 and 2009. Previous year's comparative<br />
figures are not shown.<br />
(2) Mr Ahmed and Ms Donaghey did not meet the definition of KMP under AASB 124 for the 2008 financial year but did fall within the definition for 2009. Previous year's<br />
comparative figures are not shown.<br />
Financial Report<br />
121
122<br />
Notes to and forming part<br />
of the financial <strong>report</strong><br />
For the year ended 31 December 2009<br />
29. Events after the balance sheet date<br />
(a) Dividends<br />
Since the <strong>report</strong>ing date, the directors have declared a fully franked dividend of 55 cents (2008: 55 cents), payable on<br />
31 March 2010. The amount of this dividend will be $427 million (2008: $384 million). No provision has been made for this<br />
dividend in the financial <strong>report</strong> as the dividend was not declared or determined by the directors on or before the end of the<br />
financial year.<br />
(b) Retail Entitlement Offer<br />
The retail component of the fully underwritten accelerated renounceable <strong>Woodside</strong> Entitlement Offer, announced on<br />
14 December 2009, closed on 29 January 2010. This resulted in the issue of 28,646,808 shares (total shares on issue of<br />
777,245,797) at a value of $42.10 (total share capital $5,369 million). Proceeds of $1,206 million were received by<br />
10 February 2010 and will be included in the 2010 accounts.<br />
30. Related party disclosure<br />
(a) Entities with significant influence over the entity<br />
Shell Energy Holdings Australia Ltd is deemed a related party through its 34.3% (2008: 34.3%) interest of 256,483,034<br />
ordinary shares (2008: 239,383,224 ordinary shares) in the shareholding of the Group. In 2009, Shell Energy Holdings<br />
Australia Ltd participated in the <strong>Woodside</strong> Dividend Reinvestment Plan resulting in an increase in its shareholding in the<br />
Group. Shell Energy Holdings Australia Ltd is a member of the Royal Dutch Shell Group.<br />
During the year petroleum products with a total value of $77 million (2008: $55 million) were purchased from Shell<br />
Company of Australia Ltd by the Group in its own right or as operator of various joint ventures. These transactions were<br />
on normal commercial terms and conditions. At the balance sheet date the liability outstanding to Shell Company of<br />
Australia Ltd in relation to these purchases was $7 million (2008: $2 million).<br />
Companies within the Royal Dutch Shell Group provide the Group with various technical services, technology, research<br />
and information networks and secondment of management and technical staff on normal commercial terms and<br />
conditions. The cost of these various services to the Group was $19 million (2008: $25 million). At the balance sheet date<br />
the liability outstanding to the Royal Dutch Shell Group in relation to these services was $1 million (2008: $nil).<br />
The Group sold $304 million (2008: $592 million) of oil and gas products to members of the Royal Dutch Shell Group on<br />
normal commercial terms and conditions. At the balance sheet date the trade receivable outstanding in relation to these<br />
sales was $52 million (2008: $24 million).<br />
Solen Versicherungen AG (a wholly owned captive insurance company of the Royal Dutch Shell Group) participates in<br />
the Group’s various operational and construction insurance programs. In 2009, the total paid by the Group to Solen<br />
Versicherungen AG for its participation was $2 million (2008: $3 million). Applicable insurance premiums are negotiated at<br />
arms-length with lead insurers via <strong>Woodside</strong>’s insurance brokers, with Solen Versicherungen AG following the terms set by<br />
the lead insurers.<br />
The Group and Shell have common interests in joint ventures (refer to Note 33(a)).<br />
(b) Transactions with related parties in the wholly owned group<br />
Dividends, interest receivable and diminution in value of investments in subsidiaries are shown in Note 3. Current<br />
amounts payable to controlled entities shown in Note 15(a) are interest-free inter-company current balances. Non-current<br />
amounts owing by controlled entities shown in Note 8(b) are long term inter-company advances that attract interest at<br />
commercial rates. Non-current amounts payable to controlled entities shown in Note 15(b) are long-term interest-free<br />
inter-company advances. Refer to Note 35(a) for a description of the relationship between the parent company and<br />
its controlled entities. All amounts advanced or payable to controlled entities are not repayable to the extent that the<br />
relationship between the parent company and the controlled entities exists.<br />
(c) Transactions with directors<br />
No transactions with directors occurred outside of their normal Board and committee duties in 2009 (2008: $56,000).
31. Contingent liabilities<br />
2009<br />
$m<br />
Notes to and forming part<br />
of the financial <strong>report</strong><br />
For the year ended 31 December 2009<br />
Consolidated Parent<br />
Contingent liabilities at the balance sheet date<br />
Not otherwise provided for in the financial <strong>report</strong><br />
Contingent liabilities arising from subsidiaries (1) 44 16 - -<br />
Guarantees (2) 3 3 - -<br />
47 19 - -<br />
(1) Contingent liabilities relate predominately to actual or potential litigation of the Group for which amounts are reasonably estimable but the liability is not probable and therefore the<br />
Group has not provided for such amounts in this financial <strong>report</strong>. Additionally, there are a number of other claims and possible claims that have arisen in the course of business<br />
against entities in the Group, the outcome of which cannot be foreseen at present, and for which no amounts have been included in the table above.<br />
(2) Guarantees:<br />
• <strong>Woodside</strong> Petroleum Ltd and <strong>Woodside</strong> Energy Ltd are parties to a deed of cross guarantee (refer to Note 35(b)).<br />
• <strong>Woodside</strong> Petroleum Ltd has guaranteed the discharge by <strong>Woodside</strong> Finance Ltd of its financial obligations under debt facilities referred to in Note 25(e).<br />
• The Group has also issued guarantees relating to workers compensation liabilities.<br />
32. Auditor remuneration<br />
Amounts received or due and receivable by the auditors<br />
of the company for:<br />
2009<br />
$000<br />
2008<br />
$m<br />
2009<br />
$m<br />
Consolidated Parent<br />
Audit and review of financial <strong>report</strong>s<br />
Ernst & Young (Australia) 965 1,160 - -<br />
Overseas Ernst & Young firms 477 373 - -<br />
1,442 1,533 - -<br />
Non audit services<br />
Ernst & Young (Australia)<br />
Other assurance/advisory services 676 690 - -<br />
Other services 29 30 - -<br />
705 720 - -<br />
2008<br />
$000<br />
2009<br />
$000<br />
2008<br />
$m<br />
2008<br />
$000<br />
Financial Report<br />
123
124<br />
Notes to and forming part<br />
of the financial <strong>report</strong><br />
For the year ended 31<br />
December 2009<br />
33. Joint ventures<br />
(a) Joint venture interests<br />
The Group's interests in joint venture assets as at 31 December 2009 is detailed below. Exploration, development and<br />
production of hydrocarbons are the principal activities performed across these assets. Related party interests are indicated<br />
where applicable (refer to Note 30).<br />
Joint venture assets Group interest % Related party interest %<br />
Australasia<br />
Producing and Developing Assets<br />
North West Shelf Joint Ventures 12.5 - 50.0 8.3 - 16.7<br />
Enfield and Vincent 60.0 -<br />
Laminaria–Corallina 59.9 - 66.7 -<br />
Mutineer–Exeter 8.2 -<br />
Stybarrow 50.0 -<br />
Otway 51.6 -<br />
Pluto 90.0 -<br />
Exploration and Evaluation Assets<br />
Browse Basin 25.5 - 50.0 8.3 - 15.0<br />
Carnarvon Basin 15.8 - 90.0 0.0 - 15.8<br />
Bonaparte Basin 26.7 - 35.0 25.0 - 33.3<br />
Victoria 51.6 -<br />
Middle East and Africa<br />
Producing Assets<br />
Ohanet 15.0 -<br />
Exploration and Evaluation Assets<br />
Canary Islands 30.0 -<br />
Liberia 17.5 -<br />
Libya 45.0 - 55.0 -<br />
Sierra Leone 25.0 -<br />
The Americas<br />
Producing and Developing Assets<br />
Gulf of Mexico 17.0 - 67.0 -<br />
Exploration and Evaluation Assets<br />
Gulf of Mexico 3.0 - 65.0 -<br />
Brazil 12.5 -<br />
Asia<br />
Exploration and Evaluation Assets<br />
Korea 50.0 -
33. Joint ventures (continued)<br />
(b) Jointly controlled assets<br />
The aggregate of the Group’s interest in all jointly controlled assets is analysed as follows:<br />
Current assets<br />
2009<br />
$m<br />
Notes to and forming part<br />
of the financial <strong>report</strong><br />
For the year ended 31 December 2009<br />
Consolidated Parent<br />
Receivables 38 47 - -<br />
Inventories 56 52 - -<br />
Other assets 15 9 - -<br />
109 108 - -<br />
Non-current assets<br />
Inventories 11 17 - -<br />
Other assets - 6 - -<br />
Exploration and evaluation assets 1,057 842 - -<br />
Oil and gas properties 11,356 9,697 - -<br />
12,424 10,562 - -<br />
12,533 10,670 - -<br />
(c) Commitments through jointly controlled assets<br />
2008<br />
$m<br />
The aggregate of the Group’s commitments through jointly controlled assets is as follows:<br />
2009<br />
$m<br />
2009<br />
$m<br />
Consolidated Parent<br />
Capital 2,242 4,288 - -<br />
Exploration and other commitments 306 268 - -<br />
2,548 4,556 - -<br />
(d) Jointly controlled entities<br />
Interests in jointly controlled entities are as follows:<br />
North West Shelf Gas Pty Ltd<br />
Entity Principal activity<br />
North West Shelf Liaison Company<br />
Pty Ltd<br />
North West Shelf Australia LNG Pty Ltd<br />
North West Shelf Shipping Service<br />
Company Pty Ltd<br />
Marketing services for venturers in the<br />
sale of gas to the domestic market.<br />
Liaison for venturers in the sale of LNG<br />
to the Japanese market.<br />
Marketing services for venturers in the<br />
sale of LNG to international markets.<br />
2008<br />
$m<br />
Country of<br />
incorporation<br />
2009<br />
$m<br />
2008<br />
$m<br />
2008<br />
$m<br />
Group interest %<br />
2009 2008<br />
Australia 16.67 16.67<br />
Australia 16.67 16.67<br />
Australia 16.67 16.67<br />
LNG vessel fleet advisor. Australia 16.67 16.67<br />
These entities exist as integrated components of the overall North West Shelf Joint Ventures structure and are held<br />
proportionately with the other venturers. There have been no changes to the investment in these entities during the year.<br />
All relevant commitments arising through these entities are included in Note 26.<br />
34. Associated entities<br />
Name of entity Principal activity<br />
Group interest %<br />
2009 2008<br />
Australian Technical College Pilbara Ltd (1) Provision of academic and technical training in local<br />
communities.<br />
25.00 25.00<br />
International Gas Transportation Company Ltd (2) LNG vessel fleet management. 16.67 16.67<br />
(1) Australian Technical College Pilbara Limited was incorporated on 6 December 2006 and is limited by guarantee to a maximum amount of $1. <strong>Woodside</strong> is one of four members of the<br />
company, of which significant influence is present. The associate is incorporated in Australia.<br />
(2) Where material, investments in joint venture entities are accounted for using the equity method of accounting. The associate is incorporated in Bermuda.<br />
Financial Report<br />
125
126<br />
Notes to and forming part<br />
of the financial <strong>report</strong><br />
For the year ended 31<br />
December 2009<br />
35. Subsidiaries<br />
(a) Subsidiaries<br />
Name of entity Notes Country of<br />
incorporation<br />
Parent entity<br />
Functional currency<br />
<strong>Woodside</strong> Petroleum Ltd (1,2,3) Australia Australian Dollars<br />
Subsidiaries<br />
<strong>Woodside</strong> Energy Ltd (2,3,4) Australia Australian Dollars<br />
<strong>Woodside</strong> Energy Holdings Pty Ltd (2,4) Australia Australian Dollars<br />
<strong>Woodside</strong> Energy Holdings (USA), Inc (4) USA US Dollars<br />
<strong>Woodside</strong> Insurance, Inc (4) USA US Dollars<br />
<strong>Woodside</strong> Energy (USA), Inc (4) USA US Dollars<br />
Gryphon Exploration Company (4) USA US Dollars<br />
<strong>Woodside</strong> Energy (Sahara), Inc (4,7) USA US Dollars<br />
Gander, Inc (formerly ATS, Inc) (4) USA US Dollars<br />
<strong>Woodside</strong> Offshore LLC (4) USA US Dollars<br />
<strong>Woodside</strong> Natural Gas, Inc (4) USA US Dollars<br />
Avila 8 LLC (4) USA US Dollars<br />
<strong>Woodside</strong> Energy (Peru) Pty Ltd (2,4) Australia US Dollars<br />
<strong>Woodside</strong> Eastern Energy Pty Ltd (2,4) Australia Australian Dollars<br />
<strong>Woodside</strong> Energy (Algeria) Pty Ltd (2,4) Australia US Dollars<br />
<strong>Woodside</strong> Petroleum (NEDSP) Pty Ltd (2,4) Australia Australian Dollars<br />
<strong>Woodside</strong> Technical Services Pty Ltd (2,4) Australia Australian Dollars<br />
Metasource Pty Ltd (2,4) Australia Australian Dollars<br />
<strong>Woodside</strong> West Kimberley Energy Pty Ltd (2,4) Australia Australian Dollars<br />
<strong>Woodside</strong> Guangdong Shipping (One) Pty Ltd (2,4) Australia Australian Dollars<br />
<strong>Woodside</strong> Guangdong Shipping (Two) Pty Ltd (2,4) Australia Australian Dollars<br />
<strong>Woodside</strong> Mauritania Investments Pty Ltd (2,4) Australia Australian Dollars<br />
<strong>Woodside</strong> Energy Holdings (UK) Pty Ltd (2,4) Australia Australian Dollars<br />
<strong>Woodside</strong> Energy (UK) Ltd (4) UK Great British Pounds<br />
<strong>Woodside</strong> Energy Iberia S.A. (4) Spain EURO<br />
<strong>Woodside</strong> Energy (N.A.) Ltd (4) UK US Dollars<br />
<strong>Woodside</strong> Energy (Kenya) Pty Ltd (2,4) Australia US Dollars<br />
<strong>Woodside</strong> Quest Energy Pty Ltd (2,4,6) Australia Australian Dollars<br />
<strong>Woodside</strong> Energy (Carbon Capture) Pty Ltd (2,4) Australia Australian Dollars<br />
<strong>Woodside</strong> Energy (SL) Pty Ltd (2,4) Australia US Dollars<br />
<strong>Woodside</strong> West Africa Pty Ltd (2,4) Australia US Dollars<br />
<strong>Woodside</strong> Energy Technologies Pty Ltd (2,4) Australia Australian Dollars<br />
<strong>Woodside</strong> Energy (Norway) Pty Ltd (2,4) Australia Norwegian Kroner<br />
<strong>Woodside</strong> Energy (M.E.) Pty Ltd (2,4) Australia US Dollars<br />
<strong>Woodside</strong> Energy Middle East and Africa Pty Ltd (2,4) Australia US Dollars<br />
<strong>Woodside</strong> Browse Pty Ltd (2,4) Australia Australian Dollars<br />
<strong>Woodside</strong> Burrup Pty Ltd (2,4) Australia Australian Dollars<br />
Pluto LNG Pty Ltd (5) Australia Australian Dollars<br />
Burrup Facilities Company Pty Ltd (5) Australia Australian Dollars<br />
Burrup Train 1 Pty Ltd (5) Australia Australian Dollars<br />
<strong>Woodside</strong> Energy Australia Asia Holdings Pte Ltd (4) Singapore US Dollars<br />
WelCap Insurance Pte Ltd (4) Singapore US Dollars<br />
<strong>Woodside</strong> Energy (Korea) Pte Ltd (4) Singapore US Dollars<br />
<strong>Woodside</strong> Energy Holdings (South America) Pty Ltd (2,4) Australia US Dollars<br />
<strong>Woodside</strong> Energia (Brasil) Investimento em Exploração de Petróleo Ltda. (4) Brazil US Dollars<br />
<strong>Woodside</strong> Finance Ltd (2,4) Australia Australian Dollars<br />
<strong>Woodside</strong> Petroleum Holdings Pty Ltd (2,4) Australia Australian Dollars<br />
<strong>Woodside</strong> Petroleum (Timor Sea 19) Pty Ltd (2,4) Australia US Dollars<br />
<strong>Woodside</strong> Petroleum (Timor Sea 20) Pty Ltd (2,4) Australia US Dollars<br />
Mermaid Sound Port and Marine Services Pty Ltd (2,4) Australia Australian Dollars<br />
<strong>Woodside</strong> Group Staff Superannuation Pty Ltd (2,4) Australia Australian Dollars<br />
<strong>Woodside</strong> Petroleum (Northern Operations) Pty Ltd (2,4) Australia Australian Dollars<br />
<strong>Woodside</strong> Petroleum (W.A. Oil) Pty Ltd (2,4) Australia Australian Dollars<br />
(1) <strong>Woodside</strong> Petroleum Ltd is the ultimate holding company and the head entity within the tax consolidated group.<br />
(2) These companies were members of the tax consolidated group at 31 December 2009.<br />
(3) Pursuant to ASIC Class Order 98/1418, relief has been granted to the controlled entity, <strong>Woodside</strong> Energy Ltd from the Corporations Act 2001 requirements for preparation,<br />
audit and publication of accounts. As a condition of the Class Order, <strong>Woodside</strong> Petroleum Ltd and <strong>Woodside</strong> Energy Ltd are parties to a deed of cross guarantee.<br />
(4) All subsidiaries are wholly owned except for those listed in Note 5 below.<br />
(5) Kansai Electric and Tokyo Gas each have 5% of the shares in these companies.<br />
(6) This company was placed into voluntary liquidation on 18 December 2008 and was deregistered on 1 August 2009.<br />
(7) This company was voluntarily dissolved on 26 January 2009.
35. Subsidiaries (continued)<br />
(b) Deed of cross guarantee and closed group<br />
Notes to and forming part<br />
of the financial <strong>report</strong><br />
For the year ended 31 December 2009<br />
<strong>Woodside</strong> Petroleum Ltd and <strong>Woodside</strong> Energy Ltd are parties to a deed of cross guarantee under which each company<br />
guarantees the debts of the other. By entering into the deed, the entities have been granted relief from the Corporations<br />
Act requirements for the preparation, audit and publication of accounts, pursuant to Australian Securities and Investment<br />
Commission (ASIC) Class Order 98/1418. The two entities represent a Closed Group for the purposes of the Class Order.<br />
The consolidated income statement and statement of financial position of the members of the Closed Group are set out<br />
below.<br />
Closed Group consolidated income statement<br />
Profit before tax 3,503 2,557<br />
Taxes (1,162) (1,532)<br />
Profit after tax 2,341 1,025<br />
Retained earnings at the beginning of the financial year 3,400 3,304<br />
Dividends (774) (929)<br />
Retained earnings at the end of the financial year 4,967 3,400<br />
(1) 2008 figures were restated to include diminution in value of investments in controlled entities.<br />
2009<br />
$m<br />
2008 (1)<br />
$m<br />
Financial Report<br />
127
128<br />
Notes to and forming part<br />
of the financial <strong>report</strong><br />
For the year ended 31 December 2009<br />
35. Subsidiaries (continued)<br />
(b) Deed of cross guarantee and closed group (continued)<br />
Closed Group consolidated statement of financial position<br />
Current assets<br />
Cash and cash equivalents (36) (1) 195<br />
Receivables 492 307<br />
Inventories 121 95<br />
Other financial assets - 44<br />
Other assets (6) (16)<br />
Assets of disposal group classified as held for sale 587 -<br />
Total current assets 1,158 625<br />
Non-current assets<br />
Receivables 64 57<br />
Inventories 45 53<br />
Other financial assets 10,328 5,499 (2)<br />
Other assets - -<br />
Exploration and evaluation assets 246 145<br />
Oil and gas properties 5,463 6,696<br />
Other plant and equipment 88 103<br />
Total non-current assets 16,234 12,553<br />
Total assets 17,392 13,178<br />
Current liabilities<br />
Payables 1,195 1,222<br />
Tax payable 221 529<br />
Other financial liabilities 55 26<br />
Other liabilities 18 21<br />
Liabilities directly associated with assets of disposal group classified as held for sale 41 -<br />
Provisions 108 107<br />
Total current liabilities 1,638 1,905<br />
Non-current liabilities<br />
Payables 5,043 3,747<br />
Deferred tax liabilities 979 589<br />
Other financial liabilities - 4<br />
Other liabilities 208 292<br />
Provisions 420 1,121<br />
Total non-current liabilities 6,650 5,753<br />
Total liabilities 8,288 7,658<br />
Net assets 9,104 5,520<br />
Equity<br />
Issued and fully paid shares 4,163 2,104<br />
Shares reserved for employee share plans (99) (142)<br />
Other reserves 73 158<br />
Retained earnings 4,967 3,400 (2)<br />
Total equity<br />
(1) Excess joint venture funds were put on deposit in interest-bearing accounts in <strong>Woodside</strong> Finance Ltd.<br />
(2) 2008 figures were restated to include diminution in value of investments in controlled entities.<br />
9,104 5,520<br />
36. Corporate information<br />
<strong>Woodside</strong> Petroleum Ltd is a company limited by shares incorporated in Australia. Its shares are publicly traded on the Australian<br />
Stock Exchange.<br />
2009<br />
$m<br />
2008<br />
$m
In accordance with a resolution of directors of <strong>Woodside</strong> Petroleum Ltd, we state that:<br />
Directors' declaration<br />
1. In the opinion of the directors:<br />
(a) the financial statements and notes thereto, and the disclosures included in the audited 2009 Remuneration Report, comply<br />
with Australian Accounting Standards and the Corporations Act 2001;<br />
(b) the financial statements and notes thereto give a true and fair view of the financial position of the company and the Group as<br />
at 31 December 2009 and of the performance of the company and the Group for the financial year ended 31 December 2009;<br />
(c) there are reasonable grounds to believe that the company will be able to pay its debts as and when they become due and<br />
payable; and<br />
(d) there are reasonable grounds to believe that the members of the Closed Group identified in Note 35 will be able to meet any<br />
obligations or liabilities to which they are or may become subject to, by virtue of the deed of cross guarantee.<br />
2. This declaration has been made after receiving the declarations required to be made to the directors in accordance with section<br />
295A of the Corporations Act 2001 for the year ended 31 December 2009.<br />
For and on behalf of the Board<br />
Michael Chaney, AO<br />
Chairman<br />
Perth<br />
24 February 2010<br />
Don Voelte<br />
Chief Executive Officer<br />
Financial Report<br />
129
130<br />
Independent audit <strong>report</strong><br />
Independent Auditor's Report to the Members of <strong>Woodside</strong> Petroleum Ltd<br />
Report on the Financial Report<br />
We have audited the accompanying financial <strong>report</strong> of <strong>Woodside</strong> Petroleum Ltd (the company), which comprises the statement of<br />
financial position as at 31 December 2009, and the income statement, statement of comprehensive income, statement of changes in<br />
equity and statement of cash flows for the year ended on that date, a summary of significant accounting policies, other explanatory<br />
notes and the Directors’ Declaration of the consolidated entity comprising the company and the entities it controlled at the year’s end<br />
or from time to time during the financial year.<br />
Directors’ Responsibility for the Financial Report<br />
The directors of the company are responsible for the preparation and fair presentation of the financial <strong>report</strong> in accordance with the<br />
Australian Accounting Standards (including the Australian Accounting Interpretations) and the Corporations Act 2001. This responsibility<br />
includes establishing and maintaining internal controls relevant to the preparation and fair presentation of the financial <strong>report</strong> that is<br />
free from material misstatement, whether due to fraud or error; selecting and applying appropriate accounting policies; and making<br />
accounting estimates that are reasonable in the circumstances. In Note 1, the directors also state that the financial <strong>report</strong>, comprising<br />
the financial statements and notes, complies with International Financial Reporting Standards as issued by the International<br />
Accounting Standards Board.<br />
Auditor’s Responsibility<br />
Our responsibility is to express an opinion on the financial <strong>report</strong> based on our audit. We conducted our audit in accordance with<br />
Australian Auditing Standards. These Auditing Standards require that we comply with relevant ethical requirements relating to audit<br />
engagements and plan and perform the audit to obtain reasonable assurance whether the financial <strong>report</strong> is free from material<br />
misstatement.<br />
An audit involves performing procedures to obtain audit evidence about the amounts and disclosures in the financial <strong>report</strong>. The<br />
procedures selected depend on our judgment, including the assessment of the risks of material misstatement of the financial <strong>report</strong>,<br />
whether due to fraud or error. In making those risk assessments, we consider internal controls relevant to the entity’s preparation<br />
and fair presentation of the financial <strong>report</strong> in order to design audit procedures that are appropriate in the circumstances, but not<br />
for the purpose of expressing an opinion on the effectiveness of the entity’s internal controls. An audit also includes evaluating the<br />
appropriateness of accounting policies used and the reasonableness of accounting estimates made by the directors, as well as<br />
evaluating the overall presentation of the financial <strong>report</strong>.<br />
We believe that the audit evidence we have obtained is sufficient and appropriate to provide a basis for our audit opinion.<br />
Independence<br />
In conducting our audit we have met the independence requirements of the Corporations Act 2001. We have given to the directors of<br />
the company a written Auditor’s Independence Declaration, a copy of which is included in the Directors’ Report. In addition to our audit<br />
of the financial <strong>report</strong>, we were engaged to undertake the services disclosed in the notes to the financial statements. The provision of<br />
these services has not impaired our independence.<br />
Auditor’s Opinion<br />
In our opinion:<br />
1. the financial <strong>report</strong> of <strong>Woodside</strong> Petroleum Ltd is in accordance with the Corporations Act 2001, including:<br />
(i) giving a true and fair view of the financial position of <strong>Woodside</strong> Petroleum Ltd and the consolidated entity at 31 December<br />
2009 and of their performance for the year ended on that date; and<br />
(ii) complying with Australian Accounting Standards (including the Australian Accounting Interpretations) and the Corporations Act<br />
2001.<br />
2. the financial <strong>report</strong> also complies with International Financial Reporting Standards as issued by the International Accounting<br />
Standards Board.<br />
Report on the Remuneration Report<br />
We have audited the Remuneration Report included in pages 45 to 59 of the Directors’ Report for the year ended 31 December 2009.<br />
The directors of the company are responsible for the preparation and presentation of the Remuneration Report in accordance with<br />
section 300A of the Corporations Act 2001. Our responsibility is to express an opinion on the Remuneration Report, based on our audit<br />
conducted in accordance with Australian Auditing Standards.<br />
Auditor’s Opinion<br />
In our opinion the Remuneration Report of <strong>Woodside</strong> Petroleum Ltd for the year ended 31 December 2009, complies with section<br />
300A of the Corporations Act 2001.<br />
Ernst & Young G H Meyerowitz, Partner<br />
Perth, 24 February 2010
Number of shareholdings<br />
There were 184,137 shareholders. All issued shares carry voting rights on a one for one basis.<br />
Distribution of shareholdings<br />
Shareholder information<br />
As at 15 February 2010<br />
Size of shareholding Number of holders Number of shares % of issued capital<br />
1 - 1,000 133,191 48,596,436 6.25<br />
1,001 - 5,000 45,120 86,654,486 11.15<br />
5,001 - 10,000 3,810 25,665,326 3.30<br />
10,001 - 100,000 1,903 39,141,532 5.04<br />
100,001 and over 113 577,188,017 74.26<br />
Total 184,137 777,245,797 100.00<br />
Unmarketable Parcels<br />
There were 1,929 members holding less than a marketable parcel of shares in the company.<br />
Twenty Largest Shareholders<br />
Shareholder Shares held % of issued capital<br />
Shell Energy Holdings Australia Limited 266,323,921 34.27<br />
HSBC Custody Nominees (Australia) Limited 91,418,061 11.76<br />
J P Morgan Nominees Australia Limited 75,443,675 9.71<br />
National Nominees Limited 49,622,602 6.38<br />
ANZ Nominees Limited 17,933,384 2.31<br />
Citicorp Nominees Pty Limited 14,661,919 1.89<br />
Cogent Nominees Pty Limited 5,933,638 0.76<br />
UBS Wealth Management Australia Nominees Pty Ltd 4,909,286 0.63<br />
Queensland Investment Corporation 4,239,335 0.55<br />
AMP Life Limited 3,336,520 0.43<br />
Australian Foundation Investment Company Limited 2,609,540 0.34<br />
Perpetual Trustee Company Limited 2,067,522 0.27<br />
UBS Nominees Pty Ltd 2,001,245 0.26<br />
RBC Dexia Investor Services Australia Nominees Pty Limited 1,711,147 0.22<br />
Argo Investments Limited 1,525,396 0.20<br />
HSBC Custody Nominees (Australia) LIMITED-GSCO ECA 1,476,695 0.19<br />
Australian Reward Investment Alliance 1,384,101 0.18<br />
Citicorp Nominees Pty Limited 1,276,595 0.16<br />
Citicorp Nominees Pty Limited 1,175,991 0.15<br />
Pacific Custodians Pty Ltd 1,077,377 0.14<br />
Total 550,127,950 70.80<br />
Substantial shareholders as disclosed in substantial shareholder notices given to the company are as follows:<br />
Shell Energy Holdings Australia Ltd (notice dated 3 May 2001). 228,456,275 34.27<br />
Shareholder information<br />
131
132<br />
Annual General Meeting<br />
The 2010 AGM of <strong>Woodside</strong> Petroleum Ltd<br />
will be held at 10 am (AWST) on Friday, 30<br />
April 2010 in the Riverside Theatre, Level<br />
2, Perth Convention Exhibition Centre,<br />
21 Mounts Bay Road, Perth, Western<br />
Australia. Details of the business of the<br />
meeting will be provided in the AGM<br />
notice.<br />
The AGM will be webcast live on the<br />
internet. An archive version of the webcast<br />
will be placed on the website to enable<br />
the proceedings to be viewed at a later<br />
time. Copies of the Chairman’s and<br />
CEO’s speeches will be available on the<br />
company’s website.<br />
Share registry: enquiries<br />
Investors seeking information about<br />
their shareholdings should contact the<br />
company’s share registry:<br />
Computershare Investor Services Pty<br />
Limited<br />
Level 2, 45 St Georges Terrace<br />
Perth, Western Australia 6000<br />
Postal address: GPO Box D182<br />
Perth, Western Australia 6840<br />
Telephone: 1300 558 507<br />
(within Australia)<br />
+61 3 9415 4632<br />
(outside Australia)<br />
Facsimile: +61 8 9323 2033<br />
Email: web.queries@computershare.com.au<br />
Website: www.computershare.com<br />
The share registry can assist with queries<br />
on share transfers, dividend payments, the<br />
dividend reinvestment plan, notification<br />
of tax file numbers and changes of name,<br />
address or bank account details.<br />
Details of shareholdings can be checked<br />
conveniently and simply by visiting<br />
the share registry website at www.<br />
computershare.com and clicking on<br />
the Investor Centre button. For security<br />
reasons you will need your Security<br />
Reference Number (SRN) or Holder<br />
Identification Number (HIN) when<br />
communicating with the share registry.<br />
The share registry website allows<br />
shareholders to make changes to address<br />
and banking details online.<br />
Dividend payments<br />
Shareholders may have their dividends<br />
paid directly into any bank or building<br />
society account within Australia. Payments<br />
are electronically credited on the dividend<br />
payment date and confirmed by payment<br />
advice. To request direct crediting of<br />
dividend payments please contact the<br />
share registry or visit the share registry<br />
website (www.computershare.com).<br />
The history of dividends paid by the<br />
company can be found on the company’s<br />
website (www.woodside.com.au).<br />
Dividend reinvestment plan<br />
Shareholders with registered addresses<br />
in Australia and New Zealand can elect<br />
to participate in <strong>Woodside</strong>’s dividend<br />
reinvestment plan and have the dividends<br />
on some or all of their shares automatically<br />
reinvested in additional shares.Information<br />
on the dividend reinvestment plan is<br />
available on the company’s website<br />
(www.woodside.com.au). Election forms<br />
are available from the company's website<br />
or from the share registry.<br />
Change of address or banking<br />
details<br />
Shareholders should immediately notify<br />
the share registry of any change to their<br />
address or banking arrangements for<br />
dividends electronically credited to a bank<br />
account. Changes can be made online at<br />
the share registry website<br />
(www.computershare.com).<br />
Australian Securities Exchange<br />
listing<br />
<strong>Woodside</strong> Petroleum Ltd securities<br />
are listed on the Australian Securities<br />
Exchange (ASX) under the code WPL.<br />
Share price information can be accessed<br />
on the company’s website<br />
(www.woodside.com.au).<br />
Business directory<br />
Registered Office Perth<br />
<strong>Woodside</strong> Petroleum Ltd<br />
<strong>Woodside</strong> Plaza<br />
240 St Georges Terrace<br />
Perth, WA 6000<br />
Telephone: +61 8 9348 4000<br />
Postal address: GPO Box D188<br />
Perth, WA 6840<br />
Karratha<br />
Burrup Peninsula, Karratha, WA 6714<br />
Telephone: +61 8 9348 4000<br />
American Depositary Receipts<br />
The Bank of New York sponsors a level<br />
one American Depositary Receipts (ADR)<br />
program in the United States of America.<br />
One <strong>Woodside</strong> share equals one ADR and<br />
trades over the counter under the symbol<br />
‘WOPEY’.<br />
ADR holders should deal directly with the<br />
Bank of New York on all matters related to<br />
their ADRs. Enquiries should be directed<br />
to:<br />
The Bank of New York<br />
Depositary Receipts Division<br />
101 Barclay Street, 22nd Floor,<br />
New York NY 10286<br />
Telephone: +1 888 269 2377 (within United<br />
States); +1 212 815 3700 (outside United<br />
States)<br />
Email: shareowners@bankofny.com<br />
Website: www.adrbny.com<br />
Investor Relations: enquiries<br />
Requests for specific information on the<br />
company can be directed to Investor<br />
Relations at:<br />
Investor Relations<br />
<strong>Woodside</strong> Petroleum Ltd<br />
<strong>Woodside</strong> Plaza<br />
240 St Georges Terrace,<br />
Perth Western Australia 6000<br />
Postal address: GPO Box D188<br />
Perth, Western Australia 6840<br />
Telephone: +61 8 9348 4000<br />
Facsimile: +61 8 9348 2777<br />
Email: investor@woodside.com.au<br />
Website: www.woodside.com.au<br />
Houston (USA)<br />
<strong>Woodside</strong> Energy (USA) Inc.<br />
Sage Plaza<br />
5151 San Felipe, Suite 1200<br />
Houston, TX 77056, USA<br />
Telephone: +1 713 401 0000<br />
<strong>Woodside</strong> Petroleum Ltd | Annual Report 2009
Key announcements 2009<br />
JANUARY <strong>Woodside</strong> suspends Oceanway development<br />
FEBRUARY<br />
APRIL<br />
Media Release: New look for <strong>Woodside</strong> – launch of new logo<br />
Record Full-Year 2008 net profit of $1786 million<br />
Martell gas discovery in Greater Pluto Area<br />
<strong>Woodside</strong> to issue USD$1 billion in corporate bonds<br />
Investigation underway into Vincent fire<br />
Heads of Agreement executed for Kimberley LNG Precinct<br />
Vincent production update<br />
MAY New debt facility completed<br />
JUNE Vincent production resumed<br />
JULY Media Release: North West Shelf Venture celebrates 25 years of operations<br />
AUGUST <strong>Woodside</strong> <strong>report</strong>s 2009 First-Half profit of $898 million<br />
SEPTEMBER Sierra Leone exploration well<br />
OCTOBER Update on Pluto supply talks<br />
NOVEMBER<br />
DECEMBER<br />
Events calendar 2010<br />
Sale of Otway Gas Project<br />
<strong>Woodside</strong> to issue USD$700 million in corporate bonds<br />
Dual FEED contracts for Pluto expansion<br />
Update on the Pluto LNG Project<br />
Renewals offered for Browse Basin retention leases<br />
<strong>Woodside</strong> announces $2.5 billion equity raising<br />
Successful completion of Institutional entitlement offer<br />
Renewals accepted for Browse Basin retention leases<br />
Key calendar dates for <strong>Woodside</strong> shareholders in 2010.<br />
Please note dates are subject to review.<br />
JANUARY 22 Fourth quarter 2009 <strong>report</strong><br />
FEBRUARY 24 2009 Full-Year result and final dividend announcement<br />
MARCH 1 Ex-Dividend date for final dividend<br />
5 Record date for final dividend<br />
31 Payment date for final dividend<br />
APRIL 23 First quarter 2010 <strong>report</strong><br />
28 AGM proxy returns close at 10.00 am (AWST)<br />
30 Annual General Meeting<br />
JUNE 30 <strong>Woodside</strong> Half-Year end<br />
JULY 23 Second quarter 2010 <strong>report</strong><br />
AUGUST 18 2010 Half-Year result and interim dividend announcement<br />
TBA Ex-Dividend date for interim dividend<br />
TBA Record date for interim dividend<br />
SEPTEMBER TBA Payment date for interim dividend<br />
OCTOBER 22 Third quarter 2010 <strong>report</strong><br />
DECEMBER 31 <strong>Woodside</strong> Year end<br />
Shareholder information<br />
Shareholder information<br />
133
134<br />
Conversion factors<br />
and glossary<br />
Conversion factors<br />
bbl barrel<br />
Bcf billion cubic feet<br />
boe barrel of oil equivalent<br />
kPa thousands of Pascals<br />
Mcf thousand cubic feet<br />
MMbbl million barrels<br />
MMboe million barrels of oil equivalent<br />
MMBtu million British Thermal Units<br />
MMcf million cubic feet<br />
mtpa million tonnes per annum<br />
psi pounds per square inch<br />
psia pounds per square inch absolute<br />
t tonne<br />
TJ terajoules<br />
Product Factor Conversion<br />
Factors*<br />
DOMESTIC GAS 1TJ 163.6 boe<br />
LIqUEFIED NATURAL<br />
GAS (LNG)<br />
1 tonne 8.9055<br />
boe<br />
CONDENSATE 1 bbl 1.000 boe<br />
OIL 1 bbl 1.000 boe<br />
LIquEFIED PETROLEuM<br />
GAS (LPG)<br />
1 tonne 8.1876<br />
boe<br />
GULF OF MEXICO GAS 1 MMBtu 0.1724<br />
boe<br />
* Minor changes to some conversion factors can occur over time due<br />
to gradual changes in the process stream<br />
Glossary<br />
$, $M Australian dollars unless otherwise stated, millions of dollars<br />
1H, 2H halves of the calendar year (i.e. 1H is 1 January to 30 June, 2H is<br />
1 July to 31 December)<br />
APPRAISAL WELL drilled to follow up a discovery and evaluate its commercial<br />
potential<br />
BOD basis of design<br />
BROWNFIELD An exploration or development project located within an existing<br />
province which can share infrastructure and management with an<br />
existing operation<br />
CONDENSATE hydrocarbons, which are gaseous in a reservoir, but which<br />
condense to form liquids as they rise to the surface<br />
CRuDE OIL Oil that is produced from a reservoir after any associated gas has<br />
been removed<br />
CWLH Cossack Wanaea Lambert Hermes<br />
DEVELOPMENT WELL drilled for the purpose of recovering hydrocarbons<br />
DLNG Darwin LNG<br />
DRP dividend reinvestment plan<br />
EEP employee equity plan<br />
EIP executive incentive plan<br />
ER equity rights<br />
FAR fixed <strong>annual</strong> reward<br />
FDP field development plan<br />
FEED front-end engineering and design<br />
FID final investment decision<br />
FLNG Floating LNG<br />
FPSO floating production storage and offloading vessel<br />
GREENFIELD The development or exploration located outside the area of<br />
influence of existing operations/infrastructure<br />
GWA Goodwyn A platform<br />
GWF Greater Western Flank<br />
JV joint venture<br />
KGP Karratha Gas Plant<br />
KPI key performance indicators<br />
LIBOR London Inter-Bank Offer Rate<br />
LNG liquefied natural gas<br />
LPG liquefied petroleum gas<br />
TSR total shareholder return<br />
LTI long-term incentive<br />
NRA North Rankin A platform<br />
NRB North Rankin B platform<br />
NWS North West Shelf<br />
NWSV North West Shelf Venture<br />
PRRT petroleum resources rent tax<br />
q1, q2, q3, q4 quarters of the calendar year (i.e. Q1 is 1 January to 31 March, Q2<br />
is 1 April to 30 June,Q3 is 1 July to 30 September, Q4 is 1 October<br />
to 31 December)<br />
RAP Reconciliation Action Plan<br />
REI Reportable Environmental Incidents<br />
RTSR relative total shareholder return<br />
STI short-term incentive<br />
TLP tension leg platform<br />
TRCF total recordable case frequency (per million hours worked)<br />
uLLAGE The quantity a container requires to completely fill it ie: the space<br />
in the container remaining above the liquid level<br />
VAR variable <strong>annual</strong> reward<br />
VPR variable pay rights<br />
VWAP volume weighted average price<br />
WSSP <strong>Woodside</strong> share purchase plan<br />
WTI West Texas intermediate cushing spot (oil price)<br />
<strong>Woodside</strong> Petroleum Ltd | Annual Report 2009
quick reference guide<br />
Africa 11<br />
Air emissions 29<br />
Alinta arbitration 17<br />
Angel 7, 11, 14, 15, 16, 17, 18<br />
Angel platform 15 16, 17<br />
Biodiversity conservation 29<br />
Brazil 12, 25, 91<br />
Browse LNG 5, 23, 29, 30<br />
Browse LNG Precinct 23<br />
Canary Islands 25, 124<br />
CEO remuneration 49<br />
Contingent resources 1, 10, 11, 12, 13, 20, 22<br />
Cossack Pioneer 16, 15, 17<br />
Darwin LNG 5, 22<br />
Diversity 28<br />
Dividend payments 132<br />
Dividend per share 1<br />
Dividend reinvestment plan 132<br />
Enfield oil field 7, 11, 18, 136<br />
Environmental excellence 29<br />
Environmental incidents 1, 29<br />
Events calendar 2010 133<br />
Floating LNG 5, 22<br />
Funding 6<br />
Gearing 1, 6, 137<br />
Geoff Donaldson 14<br />
Global LNG demand and supply 8<br />
Golden Gecko award 29<br />
Goodwyn A platform 7, 15, 16, 17<br />
Graduates 28<br />
Greater Exmouth 2, 6, 7, 10, 11, 136<br />
Greater Western Flank development 4, 16, 17<br />
Greenhouse gas emissions and intensity 29<br />
Health and safety 4, 26, 27<br />
Hermes development well 17<br />
Income tax costs 7<br />
Indigenous 21, 23, 28, 30, 39<br />
James Price Point 5, 23<br />
Karratha Gas Plant 7, 14, 16<br />
Kimberley Land Council 23<br />
Korea 8, 17, 25<br />
Laminaria–Corallina 7, 10, 19, 136<br />
Liberia 25<br />
Libya EPSA III 25<br />
Libya EPSA IV 25<br />
Lifting cost 7<br />
Long term incentive award 48<br />
Maersk Developer 24<br />
Maersk Ngujima-Yin FPSO 18, 27, 29<br />
Mission 2<br />
quick reference guide<br />
Modec Venture 11 FPSO 19<br />
Mutineer–Exeter 7, 10, 18, 19, 136<br />
Neptune 10, 24<br />
Net profit after tax 1, 7, 51<br />
Nganhurra FPSO 18<br />
North Rankin A 16, 17<br />
North Rankin B 16, 17<br />
North Rankin redevelopment project 15, 16<br />
North West Shelf oil redevelopment project 17<br />
Northern Endeavour 19<br />
Ohanet 10, 25<br />
Ohanet Gas Processing Plant 25<br />
Okha 17<br />
Otway 4, 6, 7, 10, 18, 19, 136<br />
Otway Gas Plant 19<br />
People capability 28<br />
Peru 8, 25<br />
Pluto 10, 20, 26-27, 30, 136<br />
Power Play 24<br />
Production 26<br />
Proved plus Probable reserves 1, 10-12, 136<br />
Proved reserves 1, 10-12<br />
Reconciliation Action Plan 30, 39<br />
Remuneration Policy 46<br />
Retention plans 45, 48, 52<br />
Safety: contractor 27<br />
Sales revenue 1, 7, 16, 24-25<br />
Securities Dealing Policy 50<br />
Share plans 45, 46, 49, 64<br />
Share registry: enquiries 132<br />
Shareholders: twenty largest 131<br />
Shareholdings: distribution 131<br />
Shelf gas fields 24<br />
Short term incentive award 47<br />
Sierra Leone 25<br />
Stabiliser 6 16<br />
Stand together for safety 20, 27<br />
Strategy 2<br />
Stybarrow 7, 11, 18<br />
Stybarrow Venture FPSO 18<br />
Sunrise 2, 3, 5, 9, 12, 22<br />
Thylacine Wellhead platform 19<br />
Timor–Leste 5, 22<br />
Total shareholder return 1, 5<br />
Train 5 7, 15, 16, 136<br />
TRCF (total recordable case frequency) 26, 27<br />
Values 2<br />
Vincent 7, 10, 18, 136<br />
Vision 2<br />
<strong>Woodside</strong> Donaldson 3, 9<br />
Shareholder information<br />
135
136<br />
2009 summary charts<br />
Product view Regional view<br />
Investment<br />
2009 2008<br />
Gas and condensate* 82% 74%<br />
Oil* 11% 19%<br />
Exploration and Other 7% 7%<br />
* Indicative only as some assets produce oil and gas<br />
The majority of <strong>Woodside</strong>'s 2009 capital expenditure was<br />
directed towards growing LNG production at our Pluto LNG<br />
project.<br />
Production<br />
2009 2008<br />
Natural gas* 54% 50%<br />
Oil 32% 38%<br />
Condensate 14% 12%<br />
* Includes LNG, LPG and pipeline gas<br />
<strong>Woodside</strong> produced 80.9 MMboe during 2009 of which over<br />
50% was natural gas. Oil production decreased to 32% as our<br />
oil fields experienced natural field decline.<br />
Revenue<br />
2009 2008<br />
Natural gas* 38% 32%<br />
Oil 45% 54%<br />
Condensate 17% 14%<br />
* Includes LNG, LPG and pipeline gas<br />
The increase in natural gas revenue reflects the change in<br />
product mix with increased LNG production from NWSV Train 5<br />
and reduced oil production across our assets.<br />
Reserves (Proved plus Probable)<br />
2009 2008<br />
Natural gas* 83% 81%<br />
Oil 8% 10%<br />
Condensate 9% 9%<br />
* Includes LNG, LPG and pipeline gas<br />
At the end of December 2009, <strong>Woodside</strong>'s Proved plus Probable<br />
reserves stood at just over 1.65 billion barrels of oil equivalent.<br />
Investment<br />
2009 2008<br />
Australia 96% 94%<br />
United States 3% 4%<br />
Rest of World 1%
10 year comparative data summary<br />
Year Ended 31 December 2009 2008 2007 (12) 2006 (12) 2005 2004 (7) 2003 2002 2001 2000<br />
Profit and Loss ($ million)<br />
Sales revenues<br />
Australia<br />
Pipeline gas 460 378 271 242<br />
LNG and LPG 1,104 1,389 847 915<br />
NWS gas (pipeline, LNG and LPG) - - - - 1,052 789 763 725 765 692<br />
NWS oil and condensate 1,040 1,428 1,119 1,106 1,005 772 696 694 644 683<br />
Australia - other 1,522 2,493 1,381 981 591 487 552 773 936 979<br />
Gulf of Mexico 156 237 158 157 28 - - - - -<br />
Algeria 70 65 65 74 71 77 8 - - -<br />
Continuing operations 4,352 5,990 3,841 3,475 2,747 2,125 2,019 2,192 2,345 2,354<br />
Mauritania (discontinued operations) (12) - - 163 335 - - - - - -<br />
Total 4,352 5,990 4,004 3,810 2,747 2,125 2,019 2,192 2,345 2,354<br />
EBITDAX before significant items (1)(2) 4,231 4,581 3,167 3,179 2,141 1,606 1,386 1,382 1,779 1,937<br />
EBITDA (2) 3,836 4,182 2,592 2,781 1,904 1,923 1,090 404 1,683 1,908<br />
EBIT after significant items (2) 2,870 3,298 1,859 2,235 1,624 1,645 854 114 1,331 1,510<br />
Exploration and evaluation 320 348 524 422 306 253 296 978 96 29<br />
Depreciation and amortisation 966 884 733 546 280 277 236 290 352 398<br />
Finance costs 16 23 10 26 9 1 26 46 70 102<br />
Tax expense 1,030 1,489 819 782 508 498 301 160 351 441<br />
NPAT before significant items (3) 1,906 1,832 1,182 1,396 1,038 672 527 658 818 877<br />
NPAT 1,824 1,786 1,030 1,427 1,107 1,146 527 (92) 910 967<br />
EPS (cents) before significant items (3)(8) 271 267 176 212 158 103 79 99 123 132<br />
EPS (cents) (8) 259 260 153 217 169 175 79 (14) 137 145<br />
DPS (cents) (4) 110 135 104 126 93 59 46 62 70 82<br />
Payout ratio (%) before significant items (3) 44.9 51.5 59.9 60.2 59.7 58.5 58.2 62.8 57.1 62.3<br />
EBITDA/Op Cash Flow (%)<br />
Balance Sheet ($ million)<br />
206.3 110.5 104.4 143.9 137.9 160.5 90.6 33.5 151.8 127.8<br />
Total assets 19,874 14,929 9,730 8,969 6,969 5,446 4,782 5,011 6,115 5,969<br />
Debt 5,529 2,957 1,032 1,820 1,128 1,013 1,068 1,429 1,662 1,415<br />
Net debt 4,178 2,816 894 1,507 895 216 891 1,274 1,502 1,140<br />
Shareholder equity<br />
Cash Flow and Capital Expenditure ($ million)<br />
Cash flow from<br />
9,865 6,705 5,094 4,202 3,501 2,771 2,434 2,320 2,554 2,111<br />
Operations 1,859 3,784 2,482 1,933 1,381 1,198 1,203 1,207 1,108 1,493<br />
Investing (6,006) (4,568) (2,026) (1,900) (1,511) (94) (741) (730) (811) (428)<br />
Financing<br />
Capital expenditure<br />
5,354 803 (622) 55 (462) (352) (419) (484) (418) (948)<br />
Exploration and evaluation 351 491 533 499 276 105 113 87 278 233<br />
Oil and gas properties (9)(13) Ratios (%)<br />
5,086 4,731 2,342 1,448 1,303 652 382 343 491 236<br />
ROACE before significant items (3) 15.1 22.4 19.4 26.8 26.5 19.7 15.0 16.5 22.4 26.8<br />
ROACE 14.5 22.7 17.1 27.1 26.5 31.5 15.0 (1.5) 24.8 30.7<br />
Return on shareholders funds before significant items (3) 19.2 26.3 22.5 33.5 30.2 29.3 21.6 28.4 32.0 41.5<br />
Return on shareholders funds after significant items 18.5 25.8 20.2 34.0 31.6 41.4 21.6 (4.0) 35.6 45.8<br />
Gearing (14) Volumes<br />
Sales (million boe)<br />
Australia<br />
29.8 29.6 14.9 26.4 20.4 7.2 26.8 35.5 37.0 35.1<br />
Pipeline gas 18.4 18.9 16.4 15.5<br />
LNG and LPG 22.8 18.2 18.2 18.5<br />
NWS gas (Pipeline, LNG and LPG) - - - - 34.8 30.8 31.0 27.9 28.2 24.8<br />
NWS oil and condensate 13.9 13.2 12.6 12.8 14.0 14.4 16.2 15.7 15.0 15.1<br />
Australia - other 20.1 24.5 15.6 11.7 8.0 9.1 13.3 19.1 23.2 24.8<br />
Gulf of Mexico 3.2 3.1 2.6 2.6 0.4 - - - - -<br />
Mauritania - - 2.0 4.3 - - - - - -<br />
Algeria 2.3 2.3 2.3 2.3 2.3 2.3 0.1 - - -<br />
Total (million boe) (6) Production (million boe)<br />
Australia<br />
80.7 80.2 69.7 67.7 59.5 56.6 60.6 62.7 66.4 64.7<br />
Pipeline gas 18.4 18.9 16.4 15.6<br />
LNG and LPG 23.0 18.6 18.6 18.6<br />
NWS gas (pipeline, LNG and LPG) - - - - 35.0 31.5 31.1 28.3 28.5 25.2<br />
NWS oil and condensate 14.0 13.5 12.7 12.8 13.8 14.3 16.4 16.0 14.8 14.9<br />
Australia - other 20.0 24.9 15.8 11.6 8.2 9.3 13.1 19.9 23.0 24.9<br />
Gulf of Mexico 3.2 3.1 2.6 2.6 0.4 - - - - -<br />
Mauritania - - 2.2 4.4 - - - - - -<br />
Algeria 2.3 2.3 2.3 2.3 2.3 2.3 0.1 - - -<br />
Total (million boe) (6) Reserves (Proved plus Probable)<br />
80.9 81.3 70.6 67.9 59.7 57.4 60.7 64.2 66.3 65.0<br />
Gas (Tcf) 7.8 7.9 7.8 6.9 4.7 5.1 4.7 4.8 4.5 4.6<br />
Condensate (MMbbl) 147.8 151.4 152.1 144.6 129.7 138.0 145.7 154.9 154.6 149.4<br />
Oil (MMbbl)<br />
Other<br />
136.1 168.8 170.2 221.1 294.5 258.8 341.5 300.1 263.3 236.4<br />
Employees (10) Shares<br />
3,219 3,124 2,981 2,888 2,508 2,528 2,219 2,418 2,420 2,198<br />
High ($) 53.87 70.51 56.66 49.80 39.39 21.48 15.10 15.05 16.42 15.25<br />
Low ($) 31.19 26.81 34.81 34.81 19.87 14.11 10.00 11.50 12.29 9.30<br />
Close ($) 47.20 36.70 50.39 38.11 39.19 20.10 14.80 12.38 13.39 14.75<br />
Number (000’s) 748,599 698,553 688,331 666,667 666,667 666,667 666,667 666,667 666,667 666,667<br />
Number of shareholders 175,257 141,035 131,460 119,003 83,829 72,267 69,491 67,523 55,347 42,135<br />
Market capitalisation ($ million) 35,334 25,637 34,685 25,407 26,127 13,400 9,867 8,253 8,927 9,833<br />
Finding costs ($/boe) (3 year average) (5)(11) 6.90 4.11 4.59 3.29 5.50 2.22 2.06 1.37 1.23 0.61<br />
Effective income tax rate (%) 34.0 32.7 35.8 35.4 31.4 30.3 36.4 235.8 27.9 31.3<br />
Net debt/total market cap (%) 11.8 11.0 2.6 5.9 3.4 1.6 9.0 15.4 16.8 11.6<br />
(1) Includes significant items other than 2002 successful<br />
efforts and 2001 Gulf of Mexico write-off.<br />
(2) EBIT is calculated as a profit before income tax, PRRT<br />
and net finance costs.<br />
(3) Excludes significant items (2002 results restated to<br />
reflect effect of successful efforts policy from January<br />
2002).<br />
(4) DPS for 2002 includes a 41.0 cents dividend that was<br />
declared after 31 December 2002.<br />
(5) Finding cost for 2003 includes acquisitions of additional<br />
scope for recovery volumes.<br />
(6) From 2003, <strong>Woodside</strong> <strong>report</strong>s oil and condensate on a<br />
volumetric basis.<br />
(7) From 1 January 2005, <strong>Woodside</strong> has prepared its<br />
financial statements in accordance with Australian<br />
equivalents to IFRS (AIFRS). To highlight the impact on<br />
previously <strong>report</strong>ed data the information provided for<br />
2004 has been restated. Information pre 1 January has<br />
not been adjusted for the effects of AIFRS.<br />
(8) Earnings per share has been calculated using the<br />
following weighted average number of shares<br />
(2009: 703,310,697 / 2008: 685,179,496 / 2007:<br />
671,447,950 / 2006: 657,178,947 /2005: 655,150,640 /<br />
2004:653,790,795 / Pre 2004: 666,666,667).<br />
(9) 2005 oil and gas properties capital expenditure includes<br />
acquisitions through business combinations of $415<br />
million, relating to the acquisition of Gryphon Exploration<br />
Company.<br />
(10) From 2005 employee numbers do not include third party<br />
contractors. Previous years have included third party<br />
contractors.<br />
(11) Finding cost methadology has changed from 2004 to be<br />
in accordance with the FAS69/SEC industry standard.<br />
(12) 2006 and 2007 data is presented inclusive of Mauritania<br />
operating results. This differs from the Income<br />
statement which presents the Mauritanian result in<br />
discontinued operations.<br />
(13) 2008 oil and gas properties capital expenditure has been<br />
restated to exclude minority interests.<br />
(14) 2008 gearing has been restated to exclude minority<br />
interests.
Visit us at<br />
www.woodside.com.au<br />
2009 Annual Report<br />
Head Office:<br />
<strong>Woodside</strong> Petroleum Ltd<br />
240 St Georges Terrace<br />
Perth WA 6000 Australia<br />
Postal Address:<br />
GPO Box D188<br />
Perth WA 6840 Australia<br />
t: +61 8 9348 4000<br />
f: +61 8 9214 2777<br />
e: companyinfo@woodside.com.au