Download PDF version - Bisnode
Download PDF version - Bisnode
Download PDF version - Bisnode

You also want an ePaper? Increase the reach of your titles
YUMPU automatically turns print PDFs into web optimized ePapers that Google loves.
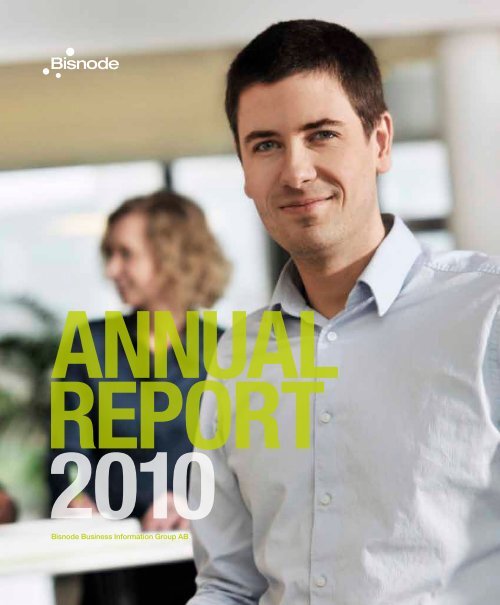
annual<br />
report<br />
2010<br />
<strong>Bisnode</strong> Business Information Group AB
03 WhaT We Do<br />
04 Johan WaLL eVaLuaTes 2010<br />
06 Where We are ToDaY<br />
07 Where We are heaDeD TomorroW<br />
08 TrenDs in our inDusTrY<br />
09 WhaT We oFFer To our cusTomers<br />
10 creDiT soLuTions<br />
12 marKeTinG soLuTions<br />
14 Business inFormaTion soLuTions<br />
16 iT’s aLL aBouT PeoPLe<br />
20 reGions anD Business areas<br />
24 corPoraTe GoVernance<br />
25 FinanciaL inFormaTion<br />
26 DirecTors’ rePorT<br />
36 accounTinG PoLicies anD noTes<br />
61 auDiT rePorT<br />
62 BoarD oF DirecTors anD auDiTors<br />
63 execuTiVe manaGemenT Team<br />
64 suBsiDiaries<br />
66 FiVe-Year summarY anD DeFiniTions serVais YimKWan<br />
database manager
WHAT WE DO<br />
<strong>Bisnode</strong> is a leading provider of digital business information in Europe, with a complete offering<br />
of solutions for marketing, credit and business information. <strong>Bisnode</strong>’s services help companies<br />
maximise sales, minimise business risks and make better business decisions.<br />
3.<br />
<strong>Bisnode</strong> database<br />
2.<br />
1.<br />
PAR<br />
4.<br />
Soliditet<br />
Hoppenstedt<br />
3<br />
1. collect<br />
<strong>Bisnode</strong> collects data about<br />
companies and consumers from<br />
multiple sources in each country.<br />
2. enhance<br />
<strong>Bisnode</strong> enhances data through<br />
harmonisation, validation and<br />
verification. Data in a wider<br />
context becomes value-added<br />
information.<br />
3. package<br />
<strong>Bisnode</strong>’s local subsidiaries<br />
package and customise relevant<br />
information into products and<br />
services by adding the value of<br />
usability, accessibility and innovative<br />
solutions. The same information<br />
is re-used many times,<br />
enabling <strong>Bisnode</strong> to achieve<br />
synergies across markets.<br />
4. oFFeR<br />
Products and services are<br />
offered to different market<br />
segments under strong local<br />
brands to fulfil the various needs<br />
of a diverse customer base.
JOHAN WALL<br />
EVALUATES 2010<br />
2010 was a year of recovery in the European market for business information and for <strong>Bisnode</strong>.<br />
The market strengthened and has now returned to near normal levels of business activity<br />
and demand.<br />
<strong>Bisnode</strong> ended the year on a positive note with organic<br />
growth of over 1 per cent in the second half of the year, partly<br />
as a result of gradually improving market development in<br />
Europe. For the year as a whole, revenue however decreased<br />
organically by 1 per cent. Our operating margin adjusted for<br />
capital gains rose slightly.<br />
Growth<br />
Growth is key for our future, as are leveraging the power of<br />
the <strong>Bisnode</strong> Group and the synergies from our 17 country<br />
operations. In 2010 we took several steps to strengthen<br />
innovation and product development and to extend our<br />
customer offering. Among them launching new Credit<br />
Solutions offerings in Germany, leveraging our existing,<br />
market-leading German data assets.<br />
Our Swedish subsidiary Business Check and German<br />
Hoppenstedt Creditcheck are two good examples of how we<br />
can drive growth. Business Check offers smart, easy-to-use<br />
web-based credit solutions targeting small- and mid-sized<br />
companies in Sweden. By moving the entire concept, business<br />
model, product templates and technology to Germany and<br />
launching it under the strong local brand Hoppenstedt<br />
Creditcheck, we have been able to reduce both time to market<br />
and costs while staying focused on gaining market share. We<br />
are now in the process of launching the same product concept<br />
in other countries, starting with Switzerland and Austria.<br />
By leveraging the power of the <strong>Bisnode</strong> Group and taking<br />
advantage of synergies, we will continue to improve our<br />
growth in the future.<br />
In addition to organic growth, <strong>Bisnode</strong> strives to grow by<br />
making selected acquisitions providing access to new customers<br />
and products while leveraging existing data assets. In the past year<br />
we made strategic acquisitions in our core offering of Marketing,<br />
Credit and Business Information Solutions across Europe.<br />
It’s all about people<br />
<strong>Bisnode</strong>’s success relies on innovation, our ability to<br />
understand and serve our customers’ needs. This is only<br />
possible through the valuable contributions of all our<br />
team members. In 2011 we are further strengthening our<br />
commitment to <strong>Bisnode</strong>’s talent by launching several<br />
initiatives to ensure that we attract, develop and retain the<br />
very best people in our industry.<br />
Future outlook<br />
The business information market is in transformation.<br />
Wider access to data, rapid growth in data usage, new<br />
technologies and evolving customer needs coupled with a<br />
changing regulatory framework are providing both business<br />
opportunities and challenges for <strong>Bisnode</strong>. The key activities<br />
for us in 2011 include launching new products and offerings in<br />
all served markets, dealing with the changed operating model<br />
for spar data and further developing our partnership with d&b.<br />
At <strong>Bisnode</strong> we have strengthened our market position<br />
and see tremendous opportunities to expand. In an era<br />
of information excess, we offer our customers effectively<br />
packaged information that is accessible, structured, verified<br />
and relevant.<br />
Our aim at <strong>Bisnode</strong> is to be the leading provider of digital<br />
business information in Europe. <strong>Bisnode</strong>’s long-term goal is<br />
to achieve an ebita margin of 15 per cent and to grow by 10<br />
per cent per year through a combination of above-average<br />
organic growth and acquisitions.<br />
Thanks to our great offering and committed <strong>Bisnode</strong><br />
talent, we are on the right path to achieving our goals.<br />
Johan Wall<br />
President and CeO<br />
5
6<br />
WHERE WE<br />
ARE TODAY<br />
<strong>Bisnode</strong> operates in 17 European countries<br />
with nearly 3,000 employees. The revenue for<br />
2010 amounted to SEK 4.451 million with<br />
an operating profit of SEK 536 million. The<br />
Group is divided into four geographical<br />
regions. In these regions <strong>Bisnode</strong> provides a<br />
core offering of Credit, Marketing and Business<br />
Information Solutions. In addition, there<br />
are two separate business areas: Product<br />
Information and Software and Applications.<br />
<strong>Bisnode</strong> has operations<br />
in 17 european countries,<br />
With its head office in<br />
stockholm, sWeden<br />
REVENUE PER REGION AND BUSINESS AREA<br />
4%<br />
17%<br />
REVENUE PER PRODUCT OFFERING<br />
18%<br />
keY figures 2010 2009<br />
Revenue (Sek M) 4,451 4,741<br />
operating profit, ebitda (Sek M) 671 728<br />
operating profit, ebita (Sek M) 536 593<br />
operating margin, ebita (%) 12.0 12.5<br />
average number of employees 3,080 3,167<br />
number of customers 200,000 197,000<br />
SEK M<br />
5 000<br />
4 000<br />
3 000<br />
2 000<br />
1 000<br />
0<br />
10%<br />
10%<br />
7%<br />
7%<br />
19%<br />
2006 2007 2008<br />
43%<br />
33%<br />
32%<br />
2009 2010<br />
NORDIC 43%<br />
DACH 19%<br />
BENEFRA 17%<br />
CENTRAL EUROPE 4%<br />
PRODUCT INFORMATION 10%<br />
SOFTWARE AND APPLICATIONS 7%<br />
NORDIC: Denmark, Estonia, Finland,<br />
Norway, Sweden<br />
DACH: Austria, Germany, Switzerland<br />
BENEFRA: Belgium, France, Netherlands<br />
CENTRAL EUROPE: Croatia, Czech Republic,<br />
Hungary, Poland, Slovakia, Slovenia<br />
MARKETING SOLUTIONS 33%<br />
CREDIT SOLUTIONS 32%<br />
BUSINESS INFORMATION<br />
SOLUTIONS 18%<br />
PRODUCT INFORMATION 10%<br />
SOFTWARE AND APPLICATIONS 7%<br />
750<br />
600<br />
450<br />
300<br />
150<br />
0<br />
operating profit,<br />
eBita<br />
reVenue
WHERE WE ARE<br />
HEADED TOMORROW<br />
When it comes to providing the information needed to make the right business<br />
decisions, relevance, access and accuracy are key factors. <strong>Bisnode</strong> combines these factors,<br />
presents them in user-friendly solutions and provides them as part of our customer’s<br />
daily workflow.<br />
Vision<br />
<strong>Bisnode</strong>’s vision is to be the leading provider<br />
of digital business information in Europe.<br />
Mission<br />
<strong>Bisnode</strong>’s mission is to help customers maximise<br />
their sales, minimise their business risks<br />
and make better business decisions. <strong>Bisnode</strong><br />
aims to be a partner for companies of all<br />
sizes in Europe, offering digital business<br />
information and decision support for the<br />
general business-to-business market. By<br />
providing state-of-the-art information solutions,<br />
<strong>Bisnode</strong> helps its customers achieve their<br />
business goals.<br />
Strategy<br />
The main components of <strong>Bisnode</strong>’s strategy<br />
are to work in close relationships with our<br />
customers through strong local presence,<br />
exploit the economies of scale in collecting<br />
and enhancing our own data and build<br />
superior segmented solutions by utilising<br />
the power of the Group. By doing so and<br />
by embracing the opportunities of new<br />
innovative methods and technologies,<br />
<strong>Bisnode</strong> will meet the objective of becoming<br />
an indispensible part of our customers’ daily<br />
business activities – and continue to grow as<br />
a leader in the markets we serve.<br />
Customer value<br />
The key to serving customers well is to provide<br />
clearly segmented offerings under strong<br />
local brands. By working closely with our<br />
customers and utilising the local expertise<br />
when validating, aggregating, selecting and<br />
packaging data in the most accessible format,<br />
we believe <strong>Bisnode</strong> is better able to add more<br />
value to each service.<br />
Scalable, digital business model<br />
<strong>Bisnode</strong>’s digital business model enables<br />
scalability and effective use of our core asset,<br />
the data set in each country. By collecting<br />
and enhancing data that can be sold multiple<br />
times, <strong>Bisnode</strong> is thus able to realise cost<br />
synergies. By sharing best practices and<br />
solutions, we can capitalise on revenue<br />
synergies throughout the Group.<br />
Leveraging the power of the <strong>Bisnode</strong> Group<br />
With the resources of a market-leading<br />
European organisation, combined with<br />
local insight and knowledge in 17 countries,<br />
<strong>Bisnode</strong> offers customers value-added solutions<br />
tailored to their local needs. At <strong>Bisnode</strong><br />
we strive to maximise revenue synergies by<br />
reusing successful concepts, business models<br />
and technologies combined with our local<br />
datasets. By leveraging the power of <strong>Bisnode</strong>,<br />
we are able to reduce time to market, increase<br />
effectiveness and serve our customers well.<br />
Driving future growth for <strong>Bisnode</strong><br />
Expanding the breadth and depth of the<br />
solutions we offer will be vital for <strong>Bisnode</strong>’s<br />
continued growth – both with customers we<br />
currently serve and in new markets where we<br />
establish our presence in the future.<br />
By continuing to develop innovative<br />
technologies that can be more easily adapted<br />
7<br />
to changing consumer behaviours, we will be<br />
able to attract new customers. In addition,<br />
by identifying talented individuals within the<br />
<strong>Bisnode</strong> Group and rewarding their creativity<br />
and entrepreneurial spirit, we will continue<br />
to enhance our position as leaders in the<br />
markets where we operate.<br />
Financial targets<br />
<strong>Bisnode</strong>’s financial target is to achieve an<br />
operating margin, ebita, of at least 15 per cent<br />
and annual revenue growth of 10 per cent<br />
over an economic cycle.<br />
key to SeRving cuStoMeRS<br />
well iS to pRovide cleaRly<br />
SegMented oFFeRingS undeR<br />
StRong local bRandS
8<br />
TRENDS iN<br />
OUR iNDUSTRY<br />
An increasing flow of information, regulatory changes and new technologies are<br />
re-shaping the market for digital business information. Customers are demanding<br />
access to the right information, whenever, wherever – and in a user-friendly format.<br />
The transfer of business information is merging with customers’ work and private lives.<br />
Business information consists of a range of<br />
different types of data, including corporate<br />
and consumer information. Long-term<br />
growth in Europe is estimated to progress at a<br />
three to five per cent annual rate. The market<br />
for digital business information is currently<br />
in a trend of cautious recovery. However,<br />
<strong>Bisnode</strong> mostly operates in segments of the<br />
information industry that are outperforming<br />
the industry average.<br />
The European market for digital<br />
business information is fragmented with<br />
many competing players, especially at the<br />
local and regional levels. At the present<br />
time, the market is experiencing a trend of<br />
consolidation among small operators.<br />
Mobility trend remains strong<br />
New opportunities and user patterns<br />
continue to emerge as the regulatory<br />
framework changes and new technologies<br />
are launched – including mobile, social,<br />
personal, semantic web and portable devices.<br />
The way information is presented,<br />
experienced and used is changing<br />
dramatically. Significant market drivers<br />
include ever-increasing amounts of<br />
information and closer system integration<br />
with end-users. The mobility trend is growing<br />
stronger, and in 2010 the use of personal<br />
tablet computers proliferated. The launching<br />
of solutions for smart phones and tablets<br />
offers a new level of mobility and allows users<br />
to access and process content at their point<br />
of need.<br />
The impact of next-generation content<br />
software technology had dramatic effects<br />
in 2010, and its evolution is expected to<br />
have an even greater impact on the industry<br />
in the year to come. <strong>Bisnode</strong>’s offerings<br />
continuously evolve to meet customer<br />
demands for next-generation services for<br />
business intelligence, social networks,<br />
embedded solutions and information<br />
searches.<br />
Customers are requesting increasingly<br />
sophisticated solutions based on new<br />
technologies with a more precise information<br />
transfer process. There is also a strong<br />
infographic trend, elevating the importance<br />
of design features that facilitate the process of<br />
digesting information.<br />
Sophisticated services and big data<br />
As fixed costs for collecting and managing<br />
data are relatively high, and the additional<br />
cost for packaging and distributing the data<br />
is low, it is imperative that we strive to add<br />
more value to the services <strong>Bisnode</strong> provides.<br />
This ensures the necessary scope for achieving<br />
large economies of scale as user numbers<br />
increase.<br />
Price pressure has risen as the volume<br />
of information has grown, thus increasing<br />
the importance of quality assurance, data<br />
enhancement and value-added services. Onesize-fits-all<br />
solutions are being replaced by<br />
solutions that allow mass customisation. As<br />
the amounts of data grow, new opportunities<br />
arise for analytical tools that can extract<br />
trends, patterns and consumer behaviours.<br />
Vast quantities of data, if refined, enrich<br />
business information services.<br />
<strong>Bisnode</strong> gathers increasing amounts of<br />
data via web crawling and crowd sourcing<br />
to harness the power of user and customer<br />
interactions. Content creation will scale faster<br />
as models take advantage of the network<br />
effect. In order to maintain and strengthen<br />
the Group’s market position, <strong>Bisnode</strong><br />
continues to expand its offer of increasingly<br />
customised products and services, which<br />
includes more focus on user-friendly<br />
innovative solutions.<br />
eveR-incReaSing aMount oF<br />
inFoRMation, cloSeR SySteM<br />
integRation with end-uSeRS<br />
and the Mobility tRend aRe<br />
iMpoRtant MaRket dRiveRS
WHAT WE OFFER TO<br />
OUR CUSTOMERS<br />
<strong>Bisnode</strong> offers high-quality business information,<br />
including company and consumer information.<br />
<strong>Bisnode</strong>’s core offering consists of credit, marketing<br />
and business information solutions that help customers<br />
to maximise sales, minimise risks and make better<br />
business decisions.<br />
core offering credit solutions marketing solutions Business information<br />
solutions<br />
offering<br />
Brands<br />
market<br />
position<br />
main market<br />
segments<br />
competitors<br />
business and consumer credit information<br />
solutions and reports, portfolio monitoring,<br />
credit status updates, credit scoring and risk<br />
analysis for the management of credit risk on a<br />
transactional and/or portfolio basis.<br />
aaa Soliditet, business check, bonitete, cekia,<br />
connectus, credita, d&b, hoppenstedt<br />
creditcheck, hoppenstedt360, wisur<br />
and partnercontrol.<br />
global credit – strong position via d&b brand<br />
for austria, czech Republic, denmark, Finland,<br />
hungary, germany, norway, poland, Sweden<br />
and Switzerland. domestic and regional credit<br />
– strong position in nordic countries, building<br />
local brands in austria, Switzerland, germany<br />
and central europe.<br />
large enterprises with global needs. large<br />
enterprises with domestic/regional needs.<br />
Small to Medium enterprises (SMe).<br />
coface, creditreform, creditsafe, delta vista,<br />
experian and uc Sweden.<br />
business and consumer contact data for mail,<br />
email or telephone, business and consumer<br />
data quality services, data intelligence, database<br />
management services including executing<br />
online communication campaigns.<br />
baby dM Scandinavia, bisnode interact, direkt-<br />
Media, direktMedia 121, paR, wdM and<br />
wdM directinet.<br />
Market leader in belgium, Finland, France,<br />
Sweden and norway and strong position in the<br />
netherlands.<br />
automotive, Fast-Moving consumer goods,<br />
Finance, Fundraising, government, insurance,<br />
leisure, Mailorder, Media, Retail, telecommunications<br />
and utilities.<br />
customised general business information solutions<br />
including financial and legal information,<br />
media monitoring, legal documents, in-depth<br />
industry analysis and extensive personal<br />
information listing.<br />
9<br />
eurodata, gv in, greens, hbi, hoppenstedt<br />
Firmeninformationen, ibon, infotorg, Javnirazpisi,<br />
newsline, poslovna hrwatska, Svensk handelstidning<br />
Justitia, Svenska nyhetsbrev and yritystele.<br />
Market leader in denmark, Sweden and Slovenia<br />
and strong positions in croatia, Finland, germany<br />
and central european countries.<br />
corporations, Financial institutions, public<br />
administrations and Small to Medium enterprises<br />
(SMe).<br />
1000 Mercis, acxiom, global direct and Schober. bundensanzeiger verlag, bureau van dijk,<br />
ergo- group, Factiva, gbi-genios and lexis nexis.
10<br />
CREDiT<br />
SOLUTiONS<br />
<strong>Bisnode</strong> offers a wide range of solutions for credit and risk management, including financial<br />
and economic information, as well as credit assessments. In 2010, <strong>Bisnode</strong> strengthened its<br />
portfolio of both local and global services by developing and enhancing solutions that are<br />
increasingly sophisticated and user-friendly.<br />
<strong>Bisnode</strong> offers business and consumer credit<br />
information services, credit status updates<br />
and business records, including original legal<br />
documents. Most services are offered at both<br />
the local and global levels. Local services are<br />
available through strong regional companies<br />
in the Group with standardised as well as<br />
customised information and specialised<br />
services, often integrated or combined with<br />
the customer’s systems.<br />
Global services are offered through the<br />
market-leading supplier of global credit<br />
information, d&b (Dun & Bradstreet).<br />
<strong>Bisnode</strong> is the largest partner of d&b,<br />
owning and operating d&b companies in<br />
ten European countries. With a portfolio<br />
of both local and global services, <strong>Bisnode</strong><br />
has a leading position in the majority of its<br />
markets.<br />
A resilient market<br />
Following the financial turbulence and frozen<br />
credit markets in 2009, many companies<br />
struggled through hard times. During such<br />
times, the share of business transactions<br />
that are preceded by a credit report is high.<br />
However, it tends to decrease in a strong<br />
economy. During 2010, the market took a<br />
positive turn, and the demand for credit<br />
solution services shifted. As the economy<br />
recovers, the number of business transactions<br />
increases, which in part makes up for the<br />
decrease in credit risk.<br />
– Our continued growth in 2010 is due to an<br />
expansion of the Small to Medium Enterprise<br />
(SME) market, in combination with the<br />
proliferation of more sophisticated solutions<br />
in the Large Enterprise segment, says Mattias<br />
Aronsson, CIO and Competence Centre<br />
Director Credit Solutions.<br />
Market growth in SME segment<br />
A strong trend during 2010 was the expansion<br />
of the market for credit solutions in the sme<br />
segment. <strong>Bisnode</strong>’s solutions offer easy access<br />
to user-friendly credit services meeting the needs<br />
of small businesses and contribute to driving<br />
demand for credit solutions in the sme segment.<br />
– Traditionally, our solutions have primarily<br />
been directed toward advanced users. Now,<br />
as the share of smaller companies that are<br />
performing credit checks is on the rise, we<br />
have focused on developing more user-friendly<br />
solutions, says Mattias Aronsson.<br />
Sophisticated services add value<br />
In the recent past, the need for sophisticated<br />
risk management solutions has increased. This<br />
trend has fuelled the development of value-<br />
added services in addition to the data <strong>Bisnode</strong><br />
delivers in the Large Enterprise segment.<br />
– In our line of business, adding value means<br />
moving from delivering reports and data<br />
to refining and processing the data for our<br />
customers with analytical tools and integrated<br />
services. Delivering more sophisticated services<br />
allows us to retain premium pricing and enables<br />
our customers to focus on their core business,<br />
says Mattias Aronsson.<br />
<strong>Bisnode</strong> strengthened its Credit Solutions<br />
offering and market position in Germany<br />
in 2010. Recent start-up Hoppenstedt<br />
CreditCheck is now an established player<br />
with significant brand recognition in the<br />
market. <strong>Bisnode</strong> also launched Hoppenstedt<br />
360, focusing on the needs for domestic credit<br />
solutions in the Large Enterprise segment. In<br />
Central Europe, <strong>Bisnode</strong> developed a small<br />
business offering, PartnerControl, which is<br />
now offered in Hungary, the Czech Republic<br />
and Slovakia.<br />
Although the demand for credit solutions<br />
is traditionally counter-cyclical in nature, the<br />
development of <strong>Bisnode</strong>’s Credit Solutions<br />
remained strong throughout the business<br />
cycle. Credit Solutions showed a positive<br />
development in 2010 and increased its share<br />
of <strong>Bisnode</strong>’s total revenue to 32 percent.<br />
adding value MeanS Moving FRoM<br />
deliveRing RepoRtS to ReFining<br />
the data with analytical toolS<br />
and integRated SolutionS
1.<br />
3.<br />
4. 5.<br />
2.<br />
11<br />
product example: every company can benefit from minimising the risks connected to their<br />
business. one major part of bisnode’s offering is to provide credit Solutions as sophisticated<br />
integrated solutions that enable companies to maximise their sales, without taking unnecessary<br />
risks.<br />
1. Many major retailers, for example electronics firms, offer payment plans to reach more<br />
customers and sell more products, such as tvs. to ensure that a particular customer has the<br />
necessary means to pay for items they would like to purchase, bisnode’s integrated credit<br />
Solution can be utilised to instantly perform a comprehensive credit check on the customer.<br />
2. every potential customer has his or her creditworthiness data gathered in a stored and integrated<br />
scorecard. during checkout, a cashier can easily enter the customer’s personal data and<br />
immediately get a green or red light to approve or deny a purchase<br />
3. the information that is the basis for a consumer scorecard is gathered from local sources<br />
such as tax authorities, courts, official registers and the land registration authority. on this<br />
scorecard, factors such as age, date of employment, home ownership, involvement in company<br />
bankruptcies, etc. are merged together with the customers’ own regulations of providing credit<br />
to the client. a score from 1 to 10 that indicates the client’s creditworthiness is compiled from<br />
this information.<br />
4. when a customer is approved, the necessary information is entered into the system and a<br />
payment plan is established.<br />
5. the customer goes home with a new tv, and the electronics firm gets a new customer.
12<br />
MARKETiNG<br />
SOLUTiONS<br />
<strong>Bisnode</strong> is one of Europe’s leading providers of marketing services including Customer<br />
Relationship Management, addressed and interactive direct marketing. In 2010, <strong>Bisnode</strong><br />
also strengthened its cross-channel integration and solutions for harnessing the information<br />
in social networks.<br />
<strong>Bisnode</strong>’s services are offered in two main<br />
segments: business-to-business and businessto-consumer.<br />
With the help of <strong>Bisnode</strong>’s<br />
solutions, customers can identify their<br />
own prospects and customer segments.<br />
<strong>Bisnode</strong> also offers up-to-date solutions for<br />
retaining and developing existing customer<br />
relationships by actively interacting with<br />
businesses and consumers. It is necessary to<br />
interact with customers via the most relevant<br />
channel and to take into consideration that<br />
the nature of the message will affect which<br />
channel produces the best results.<br />
– The speed of the dialogues is quicker, and<br />
customers have set higher standards on receiving<br />
sharper messages via the right channel. This<br />
increases the importance of high-quality crosschannel<br />
contact points. Linking the customer<br />
value from our databases with the estimation of<br />
their social value is an important focal point for<br />
the future, says Norbert Verkimpe, Competence<br />
Centre Director Marketing Solutions.<br />
Evolution of Business Intelligence<br />
As consumers become more of a moving<br />
target, marketers will need to capture more<br />
information about them, mine all of the<br />
available data and find smarter ways to<br />
extrapolate it. More data than ever is being<br />
collected. However, a larger quantity of<br />
information is not in itself the answer. The<br />
demand for higher quality data drives the<br />
evolution of Business Intelligence. The<br />
marketing solutions become more effective<br />
by taking a wider look at the people <strong>Bisnode</strong>’s<br />
customers want to reach, and by applying all<br />
of the available information.<br />
– A highly noticeable trend is that customers<br />
are asking for more relevant data, rather than<br />
just more data. They also want it presented in a<br />
user-friendly format. <strong>Bisnode</strong>’s processing power<br />
saves the customers time and allows for more<br />
effective cross-channel communication, says<br />
Norbert Verkimpe.<br />
It’s time to interact with the customers<br />
2010 was the year in which companies and<br />
brands seriously started reflecting on how<br />
to harness the power of social networks.<br />
Now the time has come for companies to<br />
start having more serious dialogues with<br />
their consumers. In 2010, we witnessed an<br />
explosion of social media. As a result, brands<br />
have become increasingly intrigued by how<br />
they should position themselves. In 2011, it’s<br />
time for companies to become more active.<br />
– The explosion of social media has also caught<br />
the attention of governments, who are looking<br />
at how to protect people’s integrity online. Our<br />
job is to offer privacy proof solutions for the<br />
individual that are set in accordance with local<br />
laws, says Norbert Verkimpe.<br />
About <strong>Bisnode</strong> Marketing Solutions<br />
<strong>Bisnode</strong> can assist customers in projectbased<br />
campaigns or services, as well as in the<br />
implementation and streamlining of ongoing<br />
marketing activities. Other marketing services<br />
include business and consumer list broking,<br />
data mining and project management.<br />
Specialised value-added offerings such as<br />
data cleansing, hosting loyalty schemes and<br />
advanced statistical segmentation are also<br />
available.<br />
Marketing Solutions account for 33% of<br />
<strong>Bisnode</strong>’s total revenue. Customers are sales-<br />
and marketing-driven companies in both the<br />
commercial and financial industries, as well<br />
as crm and direct marketing users.<br />
biSnode’S pRoceSSing poweR in<br />
pRoviding Relevant inFoRMation<br />
SaveS tiMe FoR the cuStoMeR and<br />
allowS FoR MoRe eFFective cRoSSchannel<br />
coMMunication
3.<br />
4.<br />
1.<br />
2.<br />
13<br />
product example: bisnode allows its clients, such as insurance companies, to keep track of<br />
their customers and give them relevant offers at the right time. one way of accomplishing this<br />
is by establishing key indicators that describe a customer’s lifestyle and purchasing power.<br />
1. Jean is a young man who lives with his parents. he is represented in bisnode’s system by<br />
three different keys. his individual key – representing Jean himsef. the household key – representing<br />
Jean and his parents. and finally the geographical key – representing the house they live in.<br />
2. when Jean moves out to his own flat, all three of those keys change. the insurance company<br />
can send an offer to Jean to get insurance for his new flat, and since he is on his own now, perhaps<br />
accident insurance as well. at the same time, they also offer his parents the chance to<br />
update their insurance.<br />
3. Jean meets a girl, and she moves in. the insurance company receives an indication from<br />
bisnode in their system suggesting that new relevant offers can be provided. when they buy a<br />
car or have children, the insurance company knows and can adjust its marketing accordingly.<br />
4. this way, handling the data is easier and more secure for bisnode. it also allows the customers<br />
to create marketing activities targeted at individuals, families or addresses.
14<br />
BUSiNESS iNFORMATiON<br />
SOLUTiONS<br />
<strong>Bisnode</strong>’s Business Information offering ranges from general financial and legal information to<br />
media monitoring services and people information solutions. During 2010, <strong>Bisnode</strong> advanced<br />
in the area of embedded information in customer workflows, and continued to utilise new<br />
technologies to facilitate the usage of business information.<br />
<strong>Bisnode</strong>’s offering includes a wide range of<br />
information, media monitoring and legal<br />
documents of p&l statements, land registry<br />
information and car registry information<br />
for in-depth industry analysis. The offering<br />
also includes extensive personal information<br />
such as decision-makers, managers and board<br />
members. Detailed business information<br />
can also be obtained about individual<br />
entrepreneurs and small- to medium-sized<br />
enterprises that otherwise can be hard to find.<br />
<strong>Bisnode</strong>’s information provides a solid base<br />
for well-founded decisions, from determining<br />
who to contact at a company to extensive<br />
processes needed for acquisitions and other<br />
corporate actions that require substantial<br />
decision support.<br />
Easy access to accessible data<br />
Demand for standardised and segmented<br />
products is expected to continue to<br />
expand alongside the need for one-stop<br />
shop solutions. New technologies create<br />
opportunities to offer enhanced solutions<br />
for data access. The infographic trend<br />
continues to grow stronger, and customers<br />
are demanding that detailed and complex<br />
information be presented in a user-friendly,<br />
visual format. Customers are demanding the<br />
right information at the right time and place,<br />
and in an accessible format. <strong>Bisnode</strong> has<br />
re-shaped and re-launched several solutions<br />
in 2010. InfoTorg, Poslovna Hravatska and<br />
Hoppenstedt Firmeninformationen presented<br />
services with new visual qualities and adapted<br />
them for use in mobile devices.<br />
– Customers are asking for solutions that make<br />
data more accessible from mobile devices such<br />
as smartphones and tablet computers. We<br />
also speed up the transfer of information by<br />
enhancing visual elements including graphs<br />
that convey data faster than a table of numbers<br />
would, says Maria Anselmi, Competence Centre<br />
Director of Business Information Solutions.<br />
Data collection and embedded usage<br />
The broad range of services attracts a wide<br />
variety of customers, from managers and<br />
key decision-makers to consultants and<br />
business analysts. A significant share of the<br />
information comes from the government<br />
and other public sources, as well as private<br />
sources. Some information is collected<br />
through media and Internet monitoring. An<br />
increasing share of the data is collected using<br />
web crawling and crowd sourcing.<br />
– Web crawling is gathering data from<br />
the Internet via a computer program that<br />
automatically and methodically browses the<br />
web. Crowd sourcing outsources data collection<br />
that is traditionally performed by employees, to<br />
an undefined large group of people in society,<br />
says Maria Anselmi.<br />
Customers need updated information<br />
about news, events, competitors and credit<br />
risk in each market. Embedded usage is<br />
growing, which means that external business<br />
information is integrated with internal<br />
systems and workflows. By offering qualified<br />
business information services and solutions<br />
that integrate well with the customer<br />
platform, the level of customer benefit is<br />
increased.<br />
– Integrating internal and external data gives<br />
our customer a wider spectrum of information.<br />
A more complete data set offers our customers a<br />
better base for accurate decision-making, states<br />
Maria Anselmi.<br />
The market for business information is in a<br />
recovering trend, although the market tends<br />
to be fairly robust in relation to the business<br />
cycle. Business Information Solutions account<br />
for 18 per cent of <strong>Bisnode</strong>’s total revenue.<br />
pRoviding SolutionS that Make<br />
data MoRe acceSSible FRoM Mobile<br />
deviceS and enhance it with MoRe<br />
gRaphical viSualS iS an incReaSing<br />
deMand FRoM ouR cuStoMeRS
3.<br />
4.<br />
1.<br />
2.<br />
15<br />
product example: every company can benefit from keeping tabs on the world around it.<br />
bisnode provides online monitoring services for small- and medium-sized companies to help<br />
them with day-to-day fact finding on their market, their competitors and partners.<br />
1. companies can keep tabs on what is written by business publications. bisnode searches the<br />
daily business press and indexes articles into a database that numbers more than one million<br />
articles in various countries. driven by a powerful search engine, customers get the latest news<br />
and market trends at all times.<br />
2. bisnode gathers information about companies and decision-makers from sources such as<br />
local courts, banks, official government agencies and business partners.<br />
3. bisnode uncovers information about insolvency cases, legal issues, payment indices and<br />
other information that enables our customers to perform benchmark analyses, study balance<br />
sheets, annual reports and more.<br />
4. bisnode business information Solutions gives each client sufficient data to continuously<br />
monitor the market in order to make better and safer decisions in their day-to-day business.
16<br />
iT’S ALL ABOUT<br />
PEOPLE<br />
Talent is the key to business success. <strong>Bisnode</strong> works strategically to attract, develop and retain the<br />
right talent for today and tomorrow. Employees at <strong>Bisnode</strong> have the advantages of working for<br />
small and mid-sized entrepreneurial companies at the same time that the Group provides the<br />
opportunities available in a large organisation.<br />
Knowing our markets<br />
The <strong>Bisnode</strong> Group is present in 17 countries<br />
in Europe and had 2,974 employees at the<br />
end of 2010. The Group is divided into<br />
four geographical regions in which <strong>Bisnode</strong><br />
provides a core offering of credit, marketing<br />
and business information solutions. The<br />
local focus enables <strong>Bisnode</strong> to work close<br />
to the customers and take advantage of the<br />
competitive edge locally. In addition, there<br />
are two separate business areas – Product<br />
Information, offering product information<br />
and online-based advertising services across<br />
Europe, and Software and Applications.<br />
Power of the Group<br />
<strong>Bisnode</strong> is committed to sharing ideas and<br />
enhancing its longstanding entrepreneurial<br />
tradition. Three Competence Centres – for<br />
Credit Solutions, Marketing Solutions and<br />
Business Information Solutions – allow<br />
the sharing of knowledge and ideas while<br />
encouraging an innovative approach to new<br />
business opportunities. These Competence<br />
Centres strive to transfer successful concepts<br />
throughout regions and to create revenue by<br />
searching for business opportunities across<br />
borders.<br />
The local focus combined with increased<br />
transparency enables maximised business<br />
potential and synergies throughout the<br />
Group.<br />
Maximizing performance and potential<br />
One of <strong>Bisnode</strong>’s strategic objectives is to<br />
offer an environment where individuals<br />
can grow in their professional roles, and<br />
the Group shares a comprehensive strategy<br />
for Talent Management. With a large<br />
number of <strong>Bisnode</strong> companies in many<br />
geographical markets and a wide range of<br />
business information solutions, <strong>Bisnode</strong><br />
offers a multitude of opportunities for career<br />
advancement within the Group for not only<br />
current but also future talent.<br />
– Our strategic focus on talent development<br />
and knowledge sharing allows us to maximize<br />
the potential of the talent we have in-house to<br />
increase profitability and growth at the same<br />
time that we attract new talent, says Karin<br />
Svensson, Talent Director.<br />
<strong>Bisnode</strong> is focused on developing the<br />
right leadership for today and tomorrow,<br />
identifying talent in all areas of the business<br />
and developing it to its full potential, as<br />
well as dynamically sharing talent within<br />
the Group by allowing the organisation to<br />
become more transparent. Our goal is to<br />
successfully develop employee talent and offer<br />
our employees interesting career paths and<br />
mobility within the company in order to gain<br />
new skills and experiences. A good Talent<br />
Management strategy is a way to retain top<br />
talent within the Group.<br />
Building engagement<br />
A motivated team is a more proactive team.<br />
<strong>Bisnode</strong> recognises that the ability to attract<br />
and engage talented people within the<br />
Group is a key differentiator in remaining<br />
ahead of the competition and growing the<br />
entire organisation. By taking a strategic<br />
view of talent development in the same<br />
way as we do with product development<br />
and demonstrating a culture of continuous<br />
learning and cooperation, we engage the inhouse<br />
talent to create a positive spiral where<br />
talented people attract other talented people.<br />
– By injecting passion, energy and fun into our<br />
work and continuously connecting with our<br />
people, we can better understand the drivers for<br />
their engagement, meaning and each employee’s<br />
experience of being part of the <strong>Bisnode</strong> Group,<br />
says Karin Svensson.<br />
Values<br />
entRepReneuRial SpiRit<br />
<strong>Bisnode</strong> was built by entrepreneurs, and<br />
it is vital to maintain the entrepreneurial<br />
spirit in order to continue growing.<br />
local FocuS<br />
By working closely with customers,<br />
knowing <strong>Bisnode</strong>’s markets and taking<br />
advantage of the competitive edge locally.<br />
a winning attitude<br />
By striving for the number one position,<br />
exploring new possibilities and being<br />
ambitious while having fun.<br />
integRity<br />
By caring for the individual, securing<br />
the credibility of the Group’s business<br />
information and using it responsibly.<br />
openneSS<br />
By pursuing open communication and<br />
transparency.
peter trap<br />
direCtOr internatiOnaL<br />
business deveLOPment<br />
organisation<br />
REGION<br />
NORDIC<br />
REGION<br />
DACH<br />
FINANCE<br />
COMMUNICATIONS<br />
STRATEGIC IT<br />
TALENT<br />
REGION<br />
BENEFRA<br />
CEO<br />
REGION<br />
CENTRAL<br />
EUROPE<br />
COMPETENCE CENTRES<br />
CREDIT<br />
SOLUTIONS<br />
MARKETING<br />
SOLUTIONS<br />
BUSINESS<br />
INFORMATION<br />
SOLUTIONS<br />
BUSINESS<br />
AREA<br />
PRODUCT<br />
INFORMATION<br />
17<br />
BUSINESS<br />
AREA<br />
SOFTWARE<br />
AND<br />
APPLICATIONS<br />
personnel keY figures 2010 2009<br />
average number of emloyees 3,080 3,167<br />
number of emloyees at 31 december 2,974 3,095<br />
total revenue per employee (Sek th) 1,445 1,497<br />
operating profit (ebita) per employee (Sek th) 174 187<br />
number of men in the group 1,731 1,749<br />
number of women in the group 1,348 1,418<br />
EMPLOYEES BY REGION/BUSINESS AREA 2010<br />
11%<br />
8%<br />
16%<br />
7%<br />
1%<br />
21%<br />
35%<br />
NORDIC 35%<br />
DACH 21%<br />
BENEFRA 16%<br />
CENTRAL EUROPE 11%<br />
PRODUCT INFORMATION 8%<br />
SOFTWARE AND APPLICATIONS 7%<br />
CENTRAL 1%<br />
emploYees BY function 2010 %<br />
SaleS & MaRketing 46%<br />
pRoduction 41%<br />
adMiniStRation 13%
18<br />
claudine knop<br />
managing direCtOr<br />
Through dedicated and passionate leadership, Claudine Knop,<br />
Managing Director of wdm Belgium, has shaped a company in which<br />
innovation is at the heart of day-to-day business. Claudine recognises<br />
the talent in every employee and motivates her colleagues to achieve<br />
the best possible results.<br />
Knop was awarded Leadership of the Year 2010, whereby she was<br />
recognised for her innovative thinking, good communication skills<br />
and for creating a good team spirit. “It feels inspiring to be in a<br />
company with 3,000 passionate digital information specialists who all<br />
strive to develop unique solutions in different business areas.”<br />
Leadership of the Year<br />
“I feel really honoured to have won the Leadership of the Year award.<br />
I didn’t quite expect it since I have only been ceo for two years. Of<br />
course, I share the recognition with the members of my team, all of<br />
whom are very innovative and make a positive difference in our every-<br />
day business. My main contribution to our success is that I have empowered<br />
my team by welcoming and recognising new ideas”, Knop says.<br />
Communication is the key<br />
Knop firmly believes that effective communication skills are essential<br />
for successful leadership. It’s how you create solidarity and common values.<br />
“I have worked hard to create an atmosphere where everyone feels<br />
comfortable bringing new ideas to me. However, people assimilate<br />
information differently. Therefore, it’s as important to offer face-toface<br />
communication as it is to write a weekly blog or share your vision<br />
in a report. One of the initiatives for promoting innovation is a web<br />
forum where all employees can post their ideas.”<br />
Talent Management Program<br />
Knop points out that the <strong>Bisnode</strong>’s Talent Management Program will<br />
have a positive effect on the future of the Group.<br />
“A company’s employees are just as important as its products and<br />
services. If we allow people to grow, continue to promote innovative<br />
thinking and develop new digital solutions, it won’t be long before<br />
we’re number one in all markets.”<br />
name: Claudine Knop<br />
position: managing director at Wdm belgium<br />
since 2009, with 170 employees. Knop has worked<br />
with the bisnode group since 1994.<br />
Business target for 2011: to increase<br />
revenue, to integrate new technology with our<br />
digital solutions and to continue to develop the<br />
team.<br />
personal character traits: Perceptive,<br />
genuine and demonstrating excellent<br />
communication skills.
name: Pasi Leino<br />
position: account director at soliditet<br />
Finland. Leino has been with the bisnode group<br />
since 2005.<br />
Business target for 2011: to expand the<br />
market in the consumer credit business segment<br />
and be the first person to win the Performance of<br />
the Year award two years in a row.<br />
personal character traits: Listens well to<br />
customers, keeps his promises and will do what it<br />
takes to close the deal.<br />
name: Christian brandlhuber<br />
position: account manager at sales &<br />
marketing solutions in d&b germany. He has<br />
worked within the bisnode group since 2008.<br />
Business target for 2011: Compared to 2010,<br />
brandlhuber’s budget has been raised by more<br />
than 150 per cent for 2011. the reason for this is to<br />
encourage even greater contributions that will<br />
further strengthen the position of the group in the<br />
marketplace.<br />
personal character traits: Creative,<br />
diligent, flexible, friendly, persistent and persistent<br />
and persistent.<br />
pasi leino<br />
aCCOunt direCtOr<br />
Pasi Leino, Account Director at Soliditet<br />
Finland, received the Performance of the<br />
Year award. He had a very successful year<br />
in 2010 and managed to sign contracts with<br />
large customers in a new business area. “I am<br />
truly honoured to have been selected, and to<br />
be a part of a very successful organisation.<br />
Winning the award has spurred me to deliver<br />
even better results this year.”<br />
Performance of the Year<br />
Pasi Leino is known for his ambitious drive<br />
and winning attitude. In 2007, he played a<br />
key role in breaking up the monopoly in the<br />
personal credit business segment in Finland.<br />
This greatly helped strengthen <strong>Bisnode</strong>’s<br />
market position.<br />
Last year he exceeded all sales goals and<br />
received the Performance of the Year award<br />
for his achievements.<br />
christian BrandlhuBer<br />
aCCOunt manager<br />
Christian Brandlhuber, Account Manager at<br />
d&b Germany, was awarded 2010 Salesperson<br />
of the Year. He won the award for exceeding<br />
his individual annual sales budget by 288 per cent.<br />
This was the highest figure in the Group.<br />
“Excellent support from my managers and my<br />
team helped me achieve such an excellent result.”<br />
Salesperson of the Year<br />
Despite the challenges of the financial crisis,<br />
Christian Brandlhuber had a successful year<br />
in 2010 by closing a large number of deals<br />
and attracting new customers. As a result,<br />
he reached remarkable sales figures and was<br />
selected as Salesperson of the Year.<br />
Brandlhuber is recognised for his customer<br />
relationship skills and for creatively modifying<br />
market solutions to fit customer demands.<br />
“As an Account Manager, it is necessary to really<br />
listen, recognise what the customer needs and<br />
act upon it. I never sell just a product. I offer<br />
a solution to a real problem,” Brandlhuber says.<br />
19<br />
Working together leads to success<br />
“The success I enjoyed in 2010 could not have<br />
been possible without the support of my<br />
colleagues. In order to meet the challenges<br />
successfully, it was necessary to apply<br />
knowledge shared by my colleagues, and<br />
also to work creatively with them to create<br />
customised solutions,” says Leino.<br />
Innovation and entrepreneurship<br />
Leino points out that the Group has given<br />
him complete confidence to pursue leads for<br />
new customers. He feels that innovation and<br />
entrepreneurship are encouraged, which helps<br />
him maximise his results.<br />
“The balance between freedom and<br />
responsibility has been essential to my<br />
achievements. I am convinced that if <strong>Bisnode</strong><br />
continues to support this kind of development,<br />
we have a great future ahead of us.”<br />
The key to success<br />
Brandlhuber’s accomplishment is based on<br />
several factors. “To succeed in sales you have<br />
to be at the right place, at the right time and<br />
offer the right solution,” Brandlhuber explains.<br />
He suggests that another key to success is<br />
to identify the gatekeeper. By getting through<br />
to the decision-maker you close the deal<br />
faster. Brandlhuber continues by saying, “in<br />
my Account Manager role, I never let the lost<br />
deals bring me down. It is a natural part of<br />
the job. Be persistent, always knock on new<br />
doors and focus on your goals. My motto is<br />
abc – Always Be Closing.”<br />
A creative environment<br />
<strong>Bisnode</strong> Group strives to offer a stimulating<br />
environment that allows the individuals to<br />
grow and develop. Brandlhuber truly believes<br />
that <strong>Bisnode</strong> lives up to that ambition.
20<br />
REGiONS AND<br />
BUSiNESS AREAS<br />
<strong>Bisnode</strong>’s core offering of credit, market and business information<br />
solutions is organised into four geographical regions with similar<br />
market conditions, business opportunities and local synergies.<br />
In addition, there are two separate business areas<br />
– Product Information and Software and Applications.<br />
serVais YimkWan<br />
database manager<br />
natalie guidotti<br />
aCCOunt manager<br />
alexandre rossez<br />
database manager
egion nordic<br />
mats<br />
erWald<br />
regiOnaL direCtOr<br />
The Nordic region is the Group’s largest, with a very strong<br />
offering in all product areas. In 2010, revenue amounted to sek<br />
1.988 million with an operating profit of sek 371 million.<br />
Demand for <strong>Bisnode</strong>’s solutions was stable, and operations<br />
showed high profitability. Overall, the challenge in the region is<br />
growth. Developments differed between countries. In Denmark<br />
growth slowed following previous year’s sharp increase, and in<br />
Norway the business development remained weak. Finland<br />
continued to perform well and operations were strengthened<br />
through the acquisition of Yritystele.<br />
In Sweden, the business continued to deliver high operating<br />
profit margin, despite that the Swedish market for personal information<br />
is in transition since the Swedish Tax Agency assumed re-<br />
sponsibility for spar. This will affect the Swedish operations,<br />
however, our assesment is that other operations in <strong>Bisnode</strong> will<br />
compensate for the estimated decline in revenue.<br />
region Benefra<br />
norBert<br />
Verkimpe<br />
regiOnaL direCtOr<br />
<strong>Bisnode</strong> has a strong offering of marketing solutions and is<br />
the leading provider of services for consumer marketing in the<br />
region. In 2010, revenue amounted to sek 741 million with an<br />
operating profit of sek 30 million.<br />
Region BeNeFra reported negative organic growth of<br />
6 per cent, adjusted for foreign exchange effects. Overall, the<br />
region struggled to keep pace with market recovery, regulatory<br />
changes and re-organisations. In the Netherlands, a significant<br />
regulatory change has affected market conditions for all players<br />
and led to negative growth. To adapt these operations an<br />
action programme with substantial cost-cutting measures was<br />
implemented. In Belgium, an integration project has been<br />
carried out to unite the customer offerings in business-tobusiness<br />
and business-to-consumer information. Profits in France<br />
were affected by one-time costs, connected to the integration of<br />
Directinet, which was acquired at the beginning of the year.<br />
denmark<br />
estonia<br />
finland<br />
norWaY<br />
sWeden<br />
SEK m<br />
2,500<br />
2,000<br />
1,500<br />
1,000<br />
500<br />
0<br />
Belgium<br />
france<br />
netherlands<br />
SEK m<br />
900<br />
800<br />
700<br />
600<br />
500<br />
400<br />
300<br />
200<br />
100<br />
0<br />
2008 2009 2010<br />
2008 2009 2010<br />
750<br />
600<br />
450<br />
300<br />
150<br />
0<br />
120<br />
100<br />
80<br />
60<br />
40<br />
20<br />
0<br />
Continued<br />
high<br />
profitability<br />
21<br />
REVENUE<br />
OPERATING PROFIT,<br />
EBITA<br />
Challenging<br />
market<br />
REVENUE<br />
OPERATING PROFIT,<br />
EBITA
22<br />
region dach<br />
eckhard<br />
geulen<br />
regiOnaL direCtOr<br />
<strong>Bisnode</strong> has a strong offering of credit solutions in the dach<br />
region and offers business information solutions in Germany.<br />
In 2010, revenue amounted to sek 860 million with an<br />
operating profit of sek 104 million.<br />
Region dach reported positive development with organic<br />
growth of 3 per cent, adjusted for foreign exchange effects.<br />
Investments in data quality is starting to pay off in expanded<br />
offering with the launch of Hoppenstedt CreditCheck and<br />
Hoppenstedt360. Despite ongoing initiatives to increase the<br />
Group’s share of the German credit information market, the region<br />
showed higher profitability. Austria and Switzerland continued<br />
to deliver positive performances with slight growth along with<br />
improved operating margins.<br />
Eckhard Geulen has been appointed Regional Director<br />
dach following the resignation of Peter Villa in April 2011.<br />
region central europe<br />
martin<br />
coufal<br />
regiOnaL direCtOr<br />
<strong>Bisnode</strong> has a strong offering of credit solutions and business<br />
information solutions in the region. In 2010, revenue amounted<br />
to sek 182 million with an operating profit of sek 23 million.<br />
Region Central Europe posted organic growth of 6 per cent,<br />
adjusted for currency effects.<br />
Development was strongest in Poland and Slovenia.<br />
Growth-enhancing investments were made in product<br />
development, database expansion and hiring of new staff<br />
throughout the region in 2010. New products launched<br />
in all countries are starting to pay off. At the end of the<br />
year, operations in Croatia were strengthened through the<br />
acquisition of Poslovna Domena – the country’s market-leading<br />
supplier of digital business information.<br />
germanY<br />
austria<br />
sWitzerland<br />
SEK m<br />
1,000<br />
800<br />
600<br />
400<br />
200<br />
0<br />
croatia<br />
czech repuBlic<br />
hungarY<br />
poland<br />
sloVakia<br />
sloVenia<br />
SEK m<br />
210<br />
180<br />
150<br />
120<br />
90<br />
60<br />
30<br />
0<br />
2008 2009 2010<br />
2008 2009 2010<br />
120<br />
100<br />
35<br />
30<br />
25<br />
20<br />
15<br />
10<br />
80<br />
60<br />
40<br />
20<br />
5<br />
0<br />
0<br />
healthy<br />
growth<br />
REVENUE<br />
OPERATING PROFIT,<br />
EBITA<br />
invested<br />
for future<br />
growth<br />
REVENUE<br />
OPERATING PROFIT,<br />
EBITA
Business area<br />
product information<br />
fredrik<br />
Åkerman<br />
business area direCtOr<br />
The Product Information business area offers advertising-based<br />
online services and business journals with a focus on industrial<br />
suppliers. In 2010, revenue amounted to sek 437 million with an<br />
operating profit of sek 71 million.<br />
Revenue in the Product Information business area declined<br />
organically by 6 per cent for the year. The business area improved<br />
its operating margin compared to the previous year<br />
as a result of cost adaptations that matched the lower level of<br />
demand. Wer Liefert Was? retained its strong market position<br />
in Germany and continued to perform well. The divestiture<br />
of abc companies in Belgium, France, Luxembourg and the<br />
Netherlands during the period resulted in a capital loss.<br />
Fredrik Åkerman has been appointed Business Area<br />
Director Product Information following the resignation of<br />
Peter Villa in April 2011.<br />
Business area<br />
softWare and applications<br />
fredrik<br />
Åkerman<br />
business area direCtOr<br />
<strong>Bisnode</strong> offers software and applications with integrated<br />
business information that help customers analyse and improve<br />
their business performance while providing access to better<br />
decision support. In 2010, revenue amounted to sek 360<br />
million with an operating profit of sek 46 million.<br />
In 2010, <strong>Bisnode</strong> sold Office Team in Norway and its<br />
shareholding of slightly more than 50 per cent in Emric in<br />
Sweden, contributing to the decline in revenue and lower<br />
operating profit. The remaining companies have recovered after<br />
the previous year’s decrease due to market decline, and reported<br />
organic growth of more than 4 per cent for 2010. The offering<br />
of crm systems in the Swedish market remains successful, and<br />
expansion to Norway and Finland is proceeding as planned.<br />
austria<br />
denmark<br />
finland<br />
germanY<br />
hungarY<br />
norWaY<br />
sWeden<br />
sWitzerland<br />
SEK m<br />
600<br />
500<br />
400<br />
300<br />
200<br />
100<br />
0<br />
finland<br />
norWaY<br />
sWeden<br />
SEK m<br />
500<br />
450<br />
400<br />
350<br />
300<br />
250<br />
200<br />
150<br />
100<br />
50<br />
0<br />
2008 2009 2010<br />
2008 2009 2010<br />
80<br />
70<br />
60<br />
50<br />
40<br />
30<br />
20<br />
10<br />
0<br />
100<br />
90<br />
80<br />
70<br />
60<br />
50<br />
40<br />
30<br />
20<br />
10<br />
0<br />
improved<br />
profit<br />
margin<br />
23<br />
REVENUE<br />
OPERATING PROFIT,<br />
EBITA<br />
divestments<br />
and market<br />
reCovery<br />
REVENUE<br />
OPERATING PROFIT,<br />
EBITA
24<br />
CORPORATE<br />
GOVERNANCE<br />
<strong>Bisnode</strong>’s organisation, with operations in 17 countries, makes<br />
clear and well implemented corporate governance an important<br />
platform for the Group.<br />
In the <strong>Bisnode</strong> Group, governance, management<br />
and control are divided between<br />
the shareholders, Board of Directors, ceo,<br />
executive management team and managing<br />
directors of the operating companies.<br />
Corporate governance is regulated by<br />
Swedish law, primarily by the Swedish<br />
Companies Act, and by the rules and recommendations<br />
issued by relevant organisations.<br />
The Board of <strong>Bisnode</strong> Business Information<br />
Group has established requirements for all<br />
companies in the Group for corporate governance,<br />
including both a mandatory section<br />
and a section that is strongly recommended.<br />
<strong>Bisnode</strong>’s organisation, consisting of many<br />
independent companies in 17 countries,<br />
makes the Group heavily reliant on the<br />
use of sound internal control systems and<br />
procedures, as well as on compliance with<br />
these procedures.<br />
Work of the Board of Directors<br />
In 2010 <strong>Bisnode</strong>’s Board of Directors held<br />
eight scheduled meetings. The primary tasks<br />
of the Board of Directors are to:<br />
• Formulate and adopt <strong>Bisnode</strong>’s strategy for<br />
attaining its overall operating goals.<br />
• Review and adopt <strong>Bisnode</strong>’s annual<br />
budget.<br />
• Review and submit <strong>Bisnode</strong>’s annual<br />
report.<br />
• Report and propose the allocation of<br />
profit/loss to the Annual General Meeting.<br />
• Review and monitor <strong>Bisnode</strong>’s financial<br />
development and business situation.<br />
Aside from follow-up of business<br />
operations, the Board devoted much of<br />
its time in 2010 to discussing <strong>Bisnode</strong>’s<br />
upcoming acquisitions and divestitures.<br />
<strong>Bisnode</strong> played an active role in the<br />
consolidation of the market for business<br />
information during the year.<br />
Board committees<br />
<strong>Bisnode</strong> has two board committees: a Compensation<br />
Committee and an Audit Committee.<br />
Compensation Committee<br />
The Compensation Committee consists of<br />
Håkan Ramsin (Committee Chairman),<br />
Henrik Joelsson and C. W. Ros.<br />
The main tasks and responsibilities of the<br />
Committee are to:<br />
• Discuss the Board’s proposal for<br />
resolution by the Annual General Meeting<br />
regarding principles for compensation<br />
to senior executives according to the<br />
Swedish Companies Act. The principles<br />
approved by the agm shall constitute the<br />
framework for the compensatory forms<br />
and levels discussed and decided on by the<br />
Compensation Committee.<br />
• Discuss matters related to general option<br />
and bonus programs in terms of scope,<br />
conditions and allocation, according to<br />
proposals from the ceo or the Board of<br />
Directors.<br />
• Discuss matters related to the ceo’s<br />
employment contract, salary and other<br />
benefits prior to decision by the Board of<br />
Directors, and recommendations to the<br />
Board of Directors in these areas.<br />
• Discuss, and in consultation with the ceo,<br />
decide on matters related to the employment<br />
contracts, salaries and other benefits of other<br />
senior executives. The Committee shall<br />
continuously inform the Board of Directors<br />
when such decisions have been made.<br />
• Propose principles for compensation to<br />
members of the Board of Directors for any<br />
assignments on behalf of <strong>Bisnode</strong> beyond<br />
those which are consistent with normal<br />
Board responsibilities.<br />
Audit Committee<br />
The Audit Committee consists of Henrik<br />
Joelsson (Committee Chairman), Håkan<br />
Ramsin and Jonas Nyrén. The task of the<br />
Audit Committee is to ensure credibility,<br />
control and high quality in the company’s<br />
financial reporting. The committee’s main<br />
areas of responsibility are to:<br />
• Supervise the Board of Directors’ efforts to<br />
assure the quality of <strong>Bisnode</strong>’s financial re-<br />
porting. This quality assurance shall normally<br />
take place through examination of all<br />
critical accounting processes and financial<br />
reports published by <strong>Bisnode</strong>. Among other<br />
tasks, it is assumed that the Committee<br />
shall deal with matters related to internal<br />
control, regulatory compliance, events after<br />
the balance sheet date, changes in estimates<br />
and judgments and other issues that could<br />
affect the quality of the financial reports.<br />
• Maintain continuous contact with<br />
<strong>Bisnode</strong>’s auditor to stay informed about<br />
the focus and scope of the audit and<br />
to discuss coordination between the<br />
independent and internal audits and<br />
assessment of <strong>Bisnode</strong>’s risks.<br />
• Establish guidelines for the non-audit<br />
services that <strong>Bisnode</strong> may procure from the<br />
company’s auditor.<br />
• Evaluate the auditor’s performance.
Lobke DeSTRooPeR<br />
Account mAnAger<br />
25<br />
financial<br />
inforMaTion<br />
Directors’ report 26<br />
Consolidated income statement 28<br />
Consolidated statement of comprehensive income 28<br />
Consolidated statement of financial position 29<br />
Consolidated statement of changes in equity 30<br />
Consolidated statement of cash flow 31<br />
Parent Company income statement 32<br />
Parent Company statement of comprehensive income 32<br />
Parent Company statement of financial position 33<br />
Parent Company statement of changes in equity 34<br />
Parent Company statement of cash flow 35<br />
Accounting policies and notes 36<br />
Note 1. General information 36<br />
Note 2. Summary of significant accounting policies 36<br />
Note 3. Financial risk management 40<br />
Note 4. Critical accounting estimates and judgements 41<br />
Note 5. Operating segments 42<br />
Note 6. Other operating income 43<br />
Note 7. Board members and senior executives 43<br />
Note 8. Average number of employees. Average number of<br />
Board members, CEO and senior executives 43<br />
Note 9. Wages, salaries and other remuneration – Group 44<br />
Note 10. Compensation to Board members and senior executives 45<br />
Note 11. Wages, salaries and other remuneration – Parent Company 45<br />
Note 12. Fees to auditors 45<br />
Note 13. Results from participations in group companies 45<br />
Note 14. Financial income 45<br />
Note 15. Financial expenses 46<br />
Note 16. Income tax expense 46<br />
Note 17. Intangible assets 46<br />
Note 18. Property, plant and equipment 48<br />
Note 19. Available-for-sale financial assets 49<br />
Note 20. Deferred tax assets and liabilities 49<br />
Note 21. Participations in group companies 50<br />
Note 22. Trade and other receivables 52<br />
Note 23. Inventories 52<br />
Note 24. Cash and cash equivalents 52<br />
Note 25. Borrowings 52<br />
Note 26. Provisions for pensions 53<br />
Note 27. Other provisions 54<br />
Note 28. Trade and other payables 54<br />
Note 29. Derivative financial instruments 54<br />
Note 30. Accrued expenses and deferred income 55<br />
Note 31. Reserves 55<br />
Note 32. Finance leases 55<br />
Note 33. Operating leases 55<br />
Note 34. Related party transactions 56<br />
Note 35. Contingent liabilities and pledged assets 56<br />
Note 36. Share capital 56<br />
Note 37. Earnings per share 56<br />
Note 38. Business combinations 57<br />
Note 39. Sale of subsidiaries 59<br />
Note 40. Discontinued operations 59<br />
Note 41. Events after the balance sheet date 60<br />
Audit report 61
26<br />
DirecTors’<br />
reporT<br />
The Board of Directors and the Chief Executive Officer<br />
of <strong>Bisnode</strong> Business Information Group AB,<br />
556681-5725, hereby submit their report for 2010.<br />
The Group’s operations<br />
<strong>Bisnode</strong> is a leading provider of digital business information<br />
in Europe, with a complete offering of online<br />
solutions for market, credit and business information.<br />
<strong>Bisnode</strong>’s business information services help companies<br />
to maximise sales, minimise business risks and make<br />
better business decisions.<br />
<strong>Bisnode</strong> conducts operations in 17 European<br />
countries and has approximately 3,000 employees .<br />
Consolidated revenue in 2010 amounted to around<br />
SEK 4,5 billlion.<br />
<strong>Bisnode</strong> is organised in four geographical regions<br />
– Nordic, DACH, BeNeFra and Central Europe – all<br />
covering the product offerings Marketing Solutions,<br />
Credit Solutions and Business Information Solutions.<br />
In addition, there are two separate business areas,<br />
Product Information and Software and Applications,<br />
and central support functions.<br />
Significant events during the financial year<br />
Acquisitions and divestitures<br />
Three companies were acquired and four operations<br />
were divested during the year.<br />
At the beginning of January 2010 <strong>Bisnode</strong> completed<br />
the acquisition of Directinet, a leading supplier<br />
of online direct marketing solutions in France. The<br />
company reported annual revenue of EUR 14 million<br />
in 2009 and has more than 90 employees.<br />
In April <strong>Bisnode</strong> acquired Bilfakta i Sverige AB. The<br />
company has annual revenue of around SEK 4 million<br />
and was integrated with <strong>Bisnode</strong>’s existing service<br />
InfoBil during the year.<br />
In October <strong>Bisnode</strong> acquired Yritystele Oy in Finland<br />
with an online B2B search service for business information.<br />
The company has 35 employees and annual<br />
revenue of around EUR 3 million.<br />
At the beginning of April <strong>Bisnode</strong> divested the<br />
Norwegian IT supplier Office Team AS. The company<br />
has 12 employees and reported annual revenue of<br />
SEK 26 million in 2009.<br />
In the middle of May <strong>Bisnode</strong> divested the ABC<br />
group with operations in Belgium, France, Luxembourg<br />
and the Netherlands. The ABC companies have a<br />
total of 22 employees and posted annual revenue of<br />
just under SEK 28 million in 2009.<br />
In June <strong>Bisnode</strong> divested its shareholding of just<br />
over 50 per cent in Emric. Emric has more than 100<br />
employees and reported annual revenue of close to<br />
SEK 80 million in 2009.<br />
Aside from the three divested companies, in May<br />
<strong>Bisnode</strong> sold the subsidiary PAR’s operations in information<br />
logistics with 9 employees and annual revenue<br />
of around SEK 30 million.<br />
Earnings and financial position<br />
Revenue and profit<br />
Revenue for the period January-December fell by<br />
6 per cent to SEK 4,451 million, compared to SEK<br />
4,741 million in the same period of last year. Organic<br />
growth was –6.6 per cent. Adjusted for foreign<br />
exchange effects, organic growth was –1.4 per cent.<br />
Operating profit, EBITA was SEK 536 million (593),<br />
equal to an operating margin of 12.0 per cent (12.5).<br />
Adjusted for capital gains on the sale of subsidiaries,<br />
operating profit, EBITA was SEK 545 million (563)<br />
and operating margin was 12.2 per cent (11.9).<br />
Operating profit, EBIT was SEK 434 million (428).<br />
Amortisation and impairment of intangible assets<br />
attributable to acquisitions amounted to SEK 102<br />
million, compared to SEK 164 million in last year. The<br />
comparison period included a total goodwill impairment<br />
loss of SEK 41 million. 2010 is charged with an impairment<br />
loss of just under SEK 6 million on an excess value<br />
attributable to the Product Information business area.<br />
Net financial items for the year are reported at<br />
SEK –149 million, compared to SEK –189 million last<br />
year. The improvement in net financial items is<br />
explained by a stronger Swedish krona rate coupled<br />
with a decrease in net debt and lower market interest<br />
rates compared to the same period of last year. Unrealised<br />
foreign exchange gains attributable to the Group’s<br />
long-term borrowing totalled SEK 93 million (75).<br />
Income tax for the period was SEK 91 million (69),<br />
equal to an average tax rate of 32 per cent (29).<br />
Profit from continuing operations was SEK 194 million,<br />
compared to SEK 170 million last year. Earnings<br />
per share (basic and diluted) amounted to SEK 1.5 (1.3).<br />
Profit from discontinued operations in the compar-<br />
ison year includes all profit and loss items from<br />
Region UK and Ireland, which was wound up during<br />
2009.<br />
Profit for the period was SEK 194 million (62) and<br />
earnings per share (basic and diluted) amounted to<br />
SEK 1.5 (0.4).<br />
Cash flow and capital expenditure<br />
Cash flow from operating activities remains stable<br />
and amounted to SEK 464 million (471) during the<br />
year. The year’s improvement in profit before tax was<br />
offset by a somewhat higher level of working capital.<br />
The year’s expenditure on non-current assets<br />
amounted to SEK 95 million (119), and included<br />
investments of SEK 52 million (57) in intangible assets<br />
and SEK 43 million (62) in tangible assets. As a percentage<br />
of revenue, investments in tangible and<br />
intangible assets reached 2.1 per cent (2.5).<br />
Capital expenditure in the subsidiaries amounted<br />
to SEK 194 million (123) and the divestiture of subsidiaries<br />
had a positive cash flow effect of SEK 15<br />
million (105). Capital expenditure in the subsidiaries<br />
includes total contingent purchase consideration of<br />
SEK 108 million. The payments refer to two acquisitions<br />
that were carried out in 2007 and the amount<br />
has been previously reported as an interest-bearing<br />
provision in the consolidated balance sheet.<br />
The sale of two small office buildings during the<br />
period contributed a positive cash flow effect of more<br />
than SEK 20 million.<br />
Financial position<br />
Consolidated net debt fell to SEK 2,289 million, compared<br />
to SEK 2,685 million at 31 December 2009,<br />
mainly as a result of a strong cash flow during the<br />
year. Furthermore, the higher Swedish krona rate has<br />
reduced the Group’s long-term borrowing, which is<br />
denominated partly in EUR, by around SEK 90 million.<br />
Cash and cash equivalents amounted to SEK 259<br />
million, compared to SEK 368 million at 31 December<br />
2009. In addition, the Group has total granted bank<br />
overdraft facilities of SEK 400 million. At the end of<br />
the year, SEK 25 million of the overdraft facilities had<br />
been utilised.
Employees<br />
The number of employees at 31 December 2010 was<br />
2,974 (3,095 at 31 December 2009). The net effect of<br />
acquired and divested companies was a decrease of<br />
36 employees.<br />
The average number of employees during the year<br />
was 3,080, compared to 3,167 in 2009.<br />
Significant events after the balance sheet date<br />
After the balance sheet date, <strong>Bisnode</strong> completed the<br />
acquisition of Poslovna Domena in Croatia and<br />
acquired 51 per cent of Vendemore AB in Sweden.<br />
Poslovna Domena offers digital business information<br />
from Croatia’s most complete dataset of company<br />
and people information. The company has 15<br />
employees and annual revenue of around SEK 9 million.<br />
Vendemore helps companies to optimise their<br />
online marketing. The company has 10 employees<br />
and reported annual revenue of around SEK 9 million<br />
in 2010.<br />
At the end of February <strong>Bisnode</strong> acquired the credit<br />
solutions company Lindorff Decision and 90.1 per<br />
cent of marketing solutions company Lindorff Match,<br />
located in Norway. Combined, the companies have<br />
37 employees and showed annual revenue of SEK<br />
115 million in 2010. Operating profit amounted to<br />
around SEK 26 million. The acquisitions are subject<br />
to approval from the relevant competition authorities.<br />
No other significant events have taken place after<br />
the balance sheet date.<br />
Future outlook<br />
<strong>Bisnode</strong>’s vision is to be the leading provider of digital<br />
business information in Europe. The Group’s longterm<br />
financial targets are annual revenue growth,<br />
including acquisitions and divestitures, of 10 per cent<br />
over a business cycle and an operating margin, EBITA,<br />
of at least 15 per cent over a business cycle.<br />
Risks and uncertainties<br />
All business operations involve risks. <strong>Bisnode</strong> works<br />
continuosly to identify, measure and manage risk. In<br />
cases where events are beyond <strong>Bisnode</strong>’s control,<br />
the aim is to minimise the consequences. The risks to<br />
which the <strong>Bisnode</strong> Group are exposed are classified<br />
into three main categories: external-related risks,<br />
operating risks and financial risks.<br />
External-related risks<br />
– Macroeconomics<br />
Demand for <strong>Bisnode</strong>’s services and products is<br />
largely steered by economic development in the<br />
respective country. However, the Group’s externalrelated<br />
risks are reduced by maintaining a good geographical<br />
spread with sales in 17 countries, a large<br />
number of customers and a wide range of services<br />
and products.<br />
– Legislation<br />
To a large extent, the information used by the Group<br />
comes from publicly accessible sources. As a result,<br />
the Group’s operations are influenced by the laws<br />
and regulations governing public sector information<br />
in each country.<br />
– Coordinated Population and Address Register<br />
The Swedish market for people information is in transition.<br />
In 2009 the Swedish Tax Agency took over<br />
responsibility for SPAR (Coordinated Population and<br />
Address Register), which was previously handled by<br />
<strong>Bisnode</strong> through its subsidiary Infodata, and the<br />
Swedish Tax Agency introduced its first own SPAR<br />
services on the market in January 2011. The services<br />
handled by Infodata will remain on the market during<br />
2011 but will cease entirely thereafter. Infodata will<br />
thus lose its exclusive right to distribution of SPAR<br />
information. For more than 20 years, Infodata has<br />
distributed this information on a wholesale basis to<br />
both Group companies and external parties. Due to<br />
this exclusivity, the profitability of SPAR sales has<br />
been historically very high. The <strong>Bisnode</strong> Group’s<br />
directly related SPAR revenue in 2010 amounted to<br />
around SEK 300 million. The management’s assessment,<br />
however, is that the Group’s other operations<br />
will compensate for the decline in SPAR-related revenue.<br />
– Competition<br />
As technological advances reduce the costs of procuring<br />
and delivering digital information, start-up<br />
costs and certain barriers to entry in <strong>Bisnode</strong>’s markets<br />
may be reduced, allowing for more market<br />
entrants and greater competition.<br />
To fend off competition from low cost players,<br />
<strong>Bisnode</strong> is working actively to develop a more<br />
sophisticated product range and to increase customer<br />
loyalty through integrated solutions where the<br />
information is made available directly in the customer’s<br />
business system when possible.<br />
Operating risks<br />
– Product and technology development<br />
The <strong>Bisnode</strong> Group’s long-term profitability depends<br />
on the Group’s ability to successfully develop and sell<br />
new products and services. The long-term development<br />
is also dependent on the ability to efficiently<br />
deliver products to the customers. If <strong>Bisnode</strong> fails to<br />
enhance the current delivery methods or develop<br />
new methods in response to changes in technology<br />
or customer preferences, or does not act quickly<br />
enough to enhance or develop new delivery methods,<br />
the customers may choose to receive digital business<br />
information from other providers.<br />
– Employees<br />
To a large extent, <strong>Bisnode</strong>’s future sucess is dependent<br />
on the knowledge, experience and performance of its<br />
employees. In order to retain the existing staff and<br />
recruit new talents, <strong>Bisnode</strong> is working actively to<br />
offer competence development and competitive<br />
compensation terms for its employees.<br />
Financial risks<br />
The Group is exposed to different types of financial<br />
risks through its handling of financial instruments. The<br />
primary risks are currency risk, interest-rate risk,<br />
credit risk and liquidity risk. For detailed information<br />
about financial risks and financial risk management,<br />
see Note 3.<br />
27<br />
Parent Company<br />
The Parent Company reported an operating profit of<br />
SEK -27 million (-1). Profit after financial items was<br />
SEK 99 million (100). The figure includes dividends of<br />
SEK 100 million (100) from the subsidiaries. The Parent<br />
Company made no investments during the period.<br />
Group conditions<br />
<strong>Bisnode</strong> Business Information Group AB is a subsidiary<br />
of Ratos AB, corporate identity number 556008-3585.<br />
Ratos’ holding in the company amounts to 70 per<br />
cent of the votes and capital. The remaining shares<br />
are held by Bonnier Holding AB.<br />
Accounting policies<br />
The <strong>Bisnode</strong> Group applies reporting in accordance<br />
with International Financial Reporting Standards<br />
(IFRS). For additional information see Note 2.<br />
Proposed appropriation of earnings<br />
Profits available for appropriation by the Annual<br />
General Meeting (SEK):<br />
Retained earnings 638,700,044<br />
Profit for the year 103,802,933<br />
Total 742,502,977<br />
The Board of Directors and the CEO propose that the<br />
profits be appropriated as follows:<br />
To be carried forward 742,502,977<br />
Total 742,502,977
28<br />
consolidated income statement<br />
SEK thousands Note 2010 2009<br />
Continuing operations<br />
Revenue 4,451,486 4,740,747<br />
Other operating income 6 61,579 88,647<br />
Total operating income 4,513,065 4,829,394<br />
Goods and services -973,313 -1,102,809<br />
Personnel costs 9, 10 -2,060,398 -2,198,929<br />
Depreciation, amortisation and impairment losses 17, 18 -237,060 -299,454<br />
Other expenses 12 -808,418 -799,904<br />
Total operating expenses -4,079,189 -4,401,096<br />
Operating profit 433,876 428,298<br />
Financial income 14 9,431 11,879<br />
Financial expenses 15 -158,254 -200,771<br />
Net financial items -148,823 -188,892<br />
Profit before tax 285,053 239,406<br />
Income tax expense 16 -90,949 -69,352<br />
Profit for the year from continuing operations 194,104 170,054<br />
Discontinued operations<br />
Profit for the year from discontinued operations 40 -108,237<br />
Profit for the year 194,104 61,817<br />
Attributable to:<br />
Owners of the parent<br />
Non-controlling interests 180,567 50,551<br />
13,537 11,266<br />
Share information:<br />
Earnings per share before and after dilution, SEK 37 1.50 0.42<br />
Earnings per share from continuing operations, SEK 37 1.50 1.32<br />
Earnings per share from discontinued operations, SEK 37 -0.90<br />
consolidated statement of comprehensive income<br />
SEK thousands Note 2010 2009<br />
Profit for the year 194,104 61,817<br />
Other comprehensive income<br />
Fair value gains on available-for-sale financial assets -5,092<br />
Cash flow hedges 61,100 8,482<br />
Cash flow hedges, transferred to the income statement -4,770 -4,770<br />
Translation differences -315,815 -130,423<br />
Deffered tax recognised directly in equity 12,934<br />
Tax attributable to other comprehensive income -14,814 -976<br />
Other comprehensive income for the year -261,365 -132,779<br />
Total comprehensive income for the year -67,261 -70,962
consolidated statement of financial position<br />
SEK thousands Note 31/12/2010 31/12/2009<br />
ASSETS<br />
Non-current assets<br />
Intangible assets 17 5,182,273 5,612,689<br />
Property, plant and equipment 18 284,698 367,165<br />
Available-for-sale financial assets 19 4,841 6,993<br />
Deferred tax assets 20 134,386 114,406<br />
Trade and other receivables 22 14,787 20,910<br />
Total non-current assets 5,620,985 6,122,163<br />
Current assets<br />
Inventories 23 5,856 11,496<br />
Tax receivables 34,432 26,524<br />
Trade and other receivables 22 861,050 911,366<br />
Cash and cash equivalents 24 259,167 367,844<br />
Total current assets 1,160,505 1,317,230<br />
TOTAL ASSETS 6,781,490 7,439,393<br />
EQUITY<br />
Equity attributable to owners of the parent<br />
Share capital 36 482,356 482,356<br />
Other capital contributions 1,763,097 1,763,097<br />
Reserves 31 -205,249 54,003<br />
Retained earnings including profit for the year -1,036,820 -1,214,374<br />
Total 1,003,384 1,085,082<br />
Non-controlling interests 47,041 64,781<br />
Total equity 1,050,425 1,149,863<br />
LIABILITIES<br />
Non-current liabilities<br />
Borrowings 25 3,203,615 3,528,963<br />
Provisions for pensions 26 209,568 217,711<br />
Other provisions 27 54,164 188,544<br />
Deferred tax liabilities 20 245,621 259,366<br />
Trade and other payables 28 2,234<br />
Total non-current liabilities 3,712,968 4,196,818<br />
Current liabilities<br />
Borrowings 25 347,275 332,351<br />
Tax liabilities 104,955 57,712<br />
Derivative financial instruments 29 74,481 135,581<br />
Other provisions 27 39,893 1,238<br />
Trade and other payables 28 1,451,493 1,565,830<br />
Total current liabilities 2,018,097 2,092,712<br />
Total liabilities 5,731,065 6,289,530<br />
TOTAL EQUITY AND LIABILITIES 6,781,490 7,439,393<br />
29
30<br />
consolidated statement of changes in equity<br />
SEK thousands<br />
Share<br />
capital<br />
Equity attributable to owners of the parent<br />
Other<br />
capital<br />
contributions Reserves<br />
Retained<br />
earnings incl.<br />
profit for<br />
the year<br />
Total<br />
Non-<br />
controlling<br />
interests<br />
Balance at 1 January 2009 482,356 1,763,097 185,969 -1,265,596 1,165,826 57,305 1,223,131<br />
Total comprehensive income for the year -131,966 50,551 -81,415 10,453 -70,962<br />
Dividend 0 -2,740 -2,740<br />
Acquisition of non-controlling interests 0 -237 -237<br />
Other changes 671 671 671<br />
Subtotal 0 0 0 671 671 -2,977 -2,306<br />
Balance at 31 December 2009 482,356 1,763,097 54,003 -1,214,374 1,085,082 64,781 1,149,863<br />
Balance at 1 January 2010 482,356 1,763,097 54,003 -1,214,374 1,085,082 64,781 1,149,863<br />
Total comprehensive income for the year -259,252 180,567 -78,685 11,424 -67,261<br />
Dividend 0 -546 -546<br />
Acquisition of non-controlling interests -3,013 -3,013 -502 -3,515<br />
Sale of non-controlling interests 0 -28,116 -28,116<br />
Subtotal 0 0 0 -3,013 -3,013 -29,164 -32,177<br />
Balance at 31 December 2010 482,356 1,763,097 -205,249 -1,036,820 1,003,384 47,041 1,050,425<br />
Total<br />
equity
consolidated statement of cash flow<br />
SEK thousands Note 2010 2009<br />
Cash flow from operating activities<br />
Profit before tax 285,053 239,406<br />
Adjustment for items not included in cash flow, etc.<br />
Depreciation, amortisation and impairment losses 241,688 299,510<br />
Capital gains and losses 2,890 -30,395<br />
Unrealised foreign exchange gains/losses -92,675 -74,561<br />
Capitalised interest 108,764 91,686<br />
Other 3,398 -18,978<br />
Income tax paid -66,041 -71,987<br />
Cash flow from operating activities before changes in working capital 483,077 434,681<br />
Cash flow from changes in working capital<br />
Increase (-)/Decrease (+) in inventories 4,517 -1,383<br />
Increase (-)/Decrease (+) in receivables -4,525 45,136<br />
Increase (+)/Decrease (-) in trade payables -10,496 -14,429<br />
Increase (+)/Decrease (-) in other current liabilities -8,636 7,436<br />
Cash flow from operating activities 463,937 471,441<br />
Cash flow from investing activities<br />
Acquisition of subsidiaries 38 -193,759 -123,435<br />
Investments in intangible assets 17 -36,481 -38,070<br />
Investments in property, plant and equipment 18 -43,043 -61,581<br />
Internally generated assets 17 -15,958 -19,050<br />
Sale of subsidiaries 39 14,812 105,019<br />
Sale of other financial assets 223 3,331<br />
Sale of intangible assets and property, plant and equipment 22,667 4,108<br />
Cash flow from investing activities -251,539 -129,678<br />
Cash flow from financing activities<br />
New borrowings 226,555<br />
Repayment of borrowings -531,635 -395,411<br />
Repayment of non-current receivables 10,932 14,373<br />
Acquisition of non-controlling interests -3,515<br />
Dividend paid to non-controlling interests -547 -2,740<br />
Cash flow from financing activities -298,210 -383,778<br />
Cash flow from discontinued operations 40<br />
Cash flow from operating activities -1,715<br />
Cash flow from investing activities 98,777<br />
Cash flow from financing activities -441<br />
Cash flow from discontinued operations 0 96,621<br />
Cash flow for the year -85,812 54,606<br />
Cash and cash equivalents at the beginning of the year 367,844 323,572<br />
Exchange rate differences on cash and cash equivalents -22,865 -10,334<br />
Cash and cash equivalents at the end of the year 259,167 367,844<br />
Supplementary information<br />
Cash flow from operating activities includes paid and received interest in the following amounts:<br />
Interest paid -130,361 -167,578<br />
Interest received 3,785 6,138<br />
31
32<br />
parent company income statement<br />
SEK thousands Note 2010 2009<br />
Revenue 841<br />
Total operating income 841 0<br />
Personnel costs 11 -8,924<br />
Other external expenses 12 -18,695 -1,429<br />
Total operating expenses -27,619 -1,429<br />
Operating profit -26,778 -1,429<br />
Result from financial items<br />
Results from participations in group companies 13 192,904 177,312<br />
Other interest income and similar items 14 47 1<br />
Interest expenses and similar items 15 -66,963 -75,918<br />
Total profit from financial items 125,988 101,395<br />
Profit after financial items 99,210 99,966<br />
Tax on profit for the year 16 4,593<br />
Profit for the year 103,803 99,966<br />
parent company statement of comprehensive income<br />
SEK thousands Note 2010 2009<br />
Profit for the year 103,803 99,966<br />
Other comprehensive income<br />
Total comprehensive income for the year 103,803 99,966
parent company statement of financial position<br />
SEK thousands Note 31/12/2010 31/12/2009<br />
ASSETS<br />
Non-current assets<br />
Financial assets<br />
Participations in group companies 21 1,373,967 1,373,967<br />
Receivables from group companies 533,513 535,715<br />
Deferred tax asset 3,508<br />
Total financial assets 1,910,988 1,909,682<br />
Total non-current assets 1,910,988 1,909,682<br />
Current assets<br />
Current receivables<br />
Receivables from group companies 575,946 432,651<br />
Tax assets 163<br />
Other receivables 5,024 119<br />
Prepaid expenses and accrued income 221<br />
Total current receivables 581,354 432,770<br />
Cash and cash equivalents 58,111 1<br />
Total current assets 639,465 432,771<br />
TOTAL ASSETS 2,550,453 2,342,453<br />
EQUITY AND LIABILITIES<br />
Equity<br />
Restricted equity<br />
Share capital 36 482,356 482,356<br />
Statutory reserve 39,980 39,980<br />
Non-restricted equity<br />
Retained earnings 638,700 538,734<br />
Profit for the year 103,803 99,966<br />
Total equity 1,264,839 1,161,036<br />
Provisions<br />
Other provisions 16,006<br />
Total provisions 16,006 0<br />
Non-current liabilities 25<br />
Liabilities to group companies 860,026 796,320<br />
Other liabilities 368,582 341,280<br />
Total non-current liabilities 1,228,608 1,137,600<br />
Current liabilities<br />
Trade payables 417 584<br />
Liabilities to group companies 32,948 42,790<br />
Tax liabilities 148<br />
Other liabilities 163<br />
Accrued expenses and deferred income 30 7,472 295<br />
Total current liabilities 41,000 43,817<br />
TOTAL EQUITY AND LIABILITIES 2,550,453 2,342,453<br />
Assets pledged 35 1,107,539 1,298,012<br />
Contingent liabilities 35 2,237,126 2,625,416<br />
33
34<br />
parent company statement of changes in equity<br />
SEK thousands<br />
Share<br />
capital<br />
Statutory<br />
reserve<br />
Nonrestricted<br />
equity<br />
Opening balance at 1 January 2009 482,356 39,980 538,734 1,061,070<br />
Profit for the year 99,966 99,966<br />
Closing balance at 31 December 2009 482,356 39,980 638,700 1,161,036<br />
Opening balance at 1 January 2010 482,356 39,980 638,700 1,161,036<br />
Profit for the year 103,803 103,803<br />
Closing balance at 31 December 2010 482,356 39,980 742,503 1,264,839<br />
Total<br />
equity
parent company statement of cash flow<br />
SEK thousands Note 2010 2009<br />
Cash flow from operating activities<br />
Profit after financial items 99,210 99,966<br />
Adjustment for items not included in cash flow, etc.<br />
Provisions 16,006<br />
Capitalised interest 91,008 86,592<br />
Unrealised foreign exchange gains/losses -25,614 -10,960<br />
Income tax paid 774 -937<br />
Cash flow from operating activities before changes in working capital 181,384 174,661<br />
Cash flow from changes in working capital<br />
Increase (-)/decrease (+) in receivables -5,126 220<br />
Increase (+)/decrease (-) in other current liabilities 7,173 -1,790<br />
Cash flow from operating activities 183,431 173,091<br />
Cash flow from investing activities<br />
Acquisition of subsidiaries -8,120<br />
Cash flow from investing activities 0 -8,120<br />
Cash flow from financing activities<br />
Change in group balances -328,247 -339,930<br />
Group contributions received/given 77,312 74,785<br />
Dividends received 100,000 100,000<br />
Cash flow from financing activities -150,935 -165,145<br />
Cash flow for the year 32,496 -174<br />
Cash and cash equivalents at the beginning of the year 1 175<br />
Exchange rate differences on cash and cash equivalents 25,614<br />
Cash and cash equivalents at the end of the year 58,111 1<br />
Supplementary information<br />
Cash flow from operating activities includes paid and received interest in the following amounts:<br />
Interest paid -1,561 -277<br />
Interest received 47 1<br />
35
36<br />
accounTinG policies<br />
anD noTes<br />
note 1. General information<br />
<strong>Bisnode</strong> Business Information Group AB, with corporate identity number 556681-<br />
5725, is a subsidiary of Ratos AB, 556008-3585. The <strong>Bisnode</strong> Group is one of<br />
the leading providers of digital business information in Europe, with a complete<br />
offering of online solutions for market, credit and business information. The Group<br />
operates in 17 countries.<br />
<strong>Bisnode</strong> Business Information Group AB is a public Swedish limited liability<br />
company that is registered in Stockholm. The address to the head office is<br />
Sveavägen 168, S168, SE-105 99 Stockholm.<br />
The consolidated financial statements were approved by the board of directors<br />
and the CEO on 15 March 2011 and will be presented to the 2011 Annual General<br />
Meeting for adoption.<br />
note 2. summary of significant accounting policies<br />
The principal accounting policies applied in the preparation of these consolidated<br />
financial statements are set out below. These policies remain unchanged from the<br />
previous year unless otherwise stated.<br />
2.1 Basis for preparation<br />
The consolidated financial statements have been prepared in accordance with<br />
International Financial Reporting Standards (IFRS) as approved by the EU and with<br />
the standard RFR 1, Supplementary Accounting Rules for Groups, and the Annual<br />
Accounts Act. The consolidated financial statements have been prepared under<br />
the historical cost convention, as modified by the revaluation of available-for-sale<br />
financial assets and derivative financial instruments at fair value through equity in<br />
accordance with hedge accounting.<br />
All amounts are expressed in thousands of Swedish kronor (SEK thousands)<br />
unless otherwise stated.<br />
2.2 Changes in accounting policies and disclosures<br />
IFRS 3 – Business Combinations (revised)<br />
The revised standard is applied by the Group as of 1 January 2010. The revised<br />
standard has affected how business combinations are accounted for, i.e. the<br />
accounting treatment of transaction costs, contingent purchase consideration and<br />
business combinations achieved in stages. The revised standard has not had any<br />
impact on business combinations in previous year.<br />
IAS 27 – Consolidated and Separate Financial Statements (revised)<br />
The revised standard is applied by the Group as of 1 January 2010. The revised<br />
standard requires for instance that the effects of transactions with non-controlling<br />
interests be recognised directly in equity if control over the subsidiary is retained.<br />
The revised standard has affected financial statements in that transactions with noncontrolling<br />
interests have been recognised directly in equity instead of given rise<br />
to goodwill.<br />
2.3 Clarification of IFRS standards or interpretations to standards that are not<br />
yet effective and that will have a significant effect on future financial statements<br />
IAS 24 – Related Party Disclosures (revised)<br />
The revised standard clarifies and simplifies the definition of a related party and<br />
will be applied by the Group for periods beginning on or after 1 January 2011.<br />
When the revised standard is applied, it could lead to further information about<br />
related party transactions.<br />
2.4 Consolidation<br />
a) Subsidiaries<br />
Subsidiaries are all entities over which the Group has the power to govern the<br />
financial and operating policies generally accompanying a shareholding of more<br />
than one half of the voting rights. The existence and effect of potential voting<br />
rights that are currently exercisable or convertible are considered when assessing<br />
whether the Group controls another entity. Subsidiaries are fully consolidated from<br />
the date on which control is transferred to the Group. They are de-consolidated<br />
from the date that control ceases.<br />
The group uses the acquisition method of accounting to account for business<br />
combinations. The consideration transferred for the acquisition of a subsidiary is<br />
the fair values of the assets transferred, the liabilities incurred and any equity interests<br />
issued by the Group. The consideration transferred includes the fair value of any<br />
asset or liability resulting from a contingent purchase consideration arrangement.<br />
Acquisition-related costs are expensed as incurred. Identifiable assets acquired<br />
and liabilities and contingent liabilities assumed in a business combination are<br />
measured initially at their fair values at the acquisition date. On a acquisition-byacquisition<br />
basis, the group recognises any non-controlling interest in the acquiree<br />
either at fair value or at the non-controlling interest’s proportionate share of the<br />
acquiree’s net assets.<br />
The excess of the consideration transferred, the amount of any non-controlling<br />
interest in the acquiree and the acquisition-date fair value of any previous equity<br />
interest in the acquiree over the fair value of the Group’s share of the identifiable<br />
net assets acquired is recorded as goodwill. If this is less than the fair value of the<br />
net assets of the subsidiary acquired in the case of a bargain purchase, the difference<br />
is recognised directly in profit or loss as other operating income.<br />
Intragroup transactions, balances and unrealised gains on transactions<br />
between group companies are eliminated. Unrealised losses are also eliminated<br />
but are considered an indication of impairment of the asset transferred. Accounting<br />
policies of subsidiaries have been changed where necessary to ensure consistency<br />
with the policies adopted by the Group.<br />
b) Associates<br />
Associates are all entities over which the Group has significant influence but not<br />
control, generally accompanying a shareholding of between 20% and 50% of the<br />
voting rights. Participations in associates are accounted for using the equity<br />
method of accounting and are initially recognised at cost.
c) Transactions with non-controlling interests<br />
The Group treats transactions with non-controlling interests as transactions with equity<br />
owners of the Group. For purchases from non-controlling interests, the difference<br />
between any consideration paid and the relevant share acquired of the carrying value<br />
of net assets of the subsidiary is recorded in equity. Gains or losses on disposals to<br />
non-controlling interests are also recorded in equity.<br />
When the Group ceases to have control or significant influence, any retained<br />
interest in the entity is remeasured to its fair value, with the change in carrying<br />
amount recognised in profit or loss. The fair value is the initial carrying amount for<br />
the purposes of subsequently accounting for the retained interest as an associate,<br />
joint venture or financial asset. In addition, any amounts previously recognised in<br />
other comprehensive income in respect of that entity are accounted for as if the<br />
Group had directly disposed of the related assets or liabilities. This may mean that<br />
amounts previously recognised in other comprehensive income are reclassified to<br />
profit or loss.<br />
2.5 Operating segments<br />
Operating segments are reported in a manner consistent with the internal reporting<br />
provided to the chief operating decision-maker. The chief operating decision-maker,<br />
who is responsible for allocating resources and assessing performance of the<br />
operating segments, has been identified as the Chief Executive Officer of <strong>Bisnode</strong>.<br />
2.6 Foreign currency translation<br />
a) Functional and presentation currency<br />
Items included in the financial statements of each of the Group’s entities are<br />
measured using the currency of the primary economic environment in which the<br />
entity operates (“the functional currency”). The consolidated financial statements<br />
are presented in Swedish kronor (SEK), which is the Parent Company’s functional<br />
and presentation currency.<br />
b) Transactions and balances<br />
Foreign currency transactions are translated into the functional currency using the<br />
exchange rates prevailing at the dates of the transactions. Foreign exchange<br />
gains and losses resulting from the settlement of such transactions and from the<br />
translation at year-end exchange rates of monetary assets and liabilities denominated<br />
in foreign currencies are recognised in the income statement, except when<br />
deferred in other comprehensive income as qualifying cash flow hedges and qualifying<br />
net investment hedges.<br />
Translation differences on non-monetary financial assets and liabilities, such as<br />
equities held at fair value through profit or loss, are recognised in profit or loss as<br />
part of the fair value gain or loss. Translation differences on non-monetary financial<br />
assets, such as equities classified as available-for-sale, are included in other comprehensive<br />
income.<br />
c) Group companies<br />
The results and financial position of all the group entities (none of which has the<br />
currency of a hyperinflationary economy) that have a functional currency different<br />
from the presentation currency are translated into the presentation currency as<br />
follows:<br />
(i) assets and liabilities for each balance sheet presented are translated at the<br />
closing rate at the date of that balance sheet;<br />
(ii) income and expenses for each income statement are translated at average<br />
exchange rates (unless this average is not a reasonable approximation of the<br />
cumulative effect of the rates prevailing on the transaction dates, in which<br />
case income and expenses are translated at the rate on the dates of the<br />
transactions); and<br />
(iii) all resulting exchange differences are recognised in other comprehensive<br />
income.<br />
On consolidation, exchange differences arising from the translation of the net<br />
investment in foreign operations, and of borrowings and other currency instruments<br />
designated as hedges of such investments, are taken to other comprehensive<br />
income. When a foreign operation is disposed of or sold, such exchange rate differences<br />
are recognised in the income statement as part of the gain or loss on sale.<br />
Goodwill and fair value adjustments arising on the acquisition of a foreign entity are<br />
treated as assets and liabilities of the foreign entity and translated at the closing rate.<br />
37<br />
2.7 Intangible assets<br />
a) Goodwill<br />
Goodwill represents the excess of the cost of an acquisition over the fair value of<br />
the Group’s share of the net identifiable assets of the acquired subsidiary at the<br />
date of acquisition. Goodwill on acquisitions of subsidiaries is included in intangible<br />
assets. Goodwill is tested annually for impairment and carried at cost less accumulated<br />
impairment losses. Gains and losses on the disposal of an entity include<br />
the carrying amount of goodwill relating to the entity sold.<br />
Goodwill is allocated to cash generating units for the purpose of impairment<br />
testing. The Group’s cash generating units consists of the six operating segments.<br />
b) Trademarks<br />
Trademarks are carried at historical cost. Trademarks have a finite useful life and<br />
are carried at cost less accumulated amortisation. Amortisation is calculated<br />
using the straight-line method to allocate the cost of trademarks over their estimated<br />
useful lives. Useful lives have been estimated at 20 years in all cases.<br />
c) Databases<br />
Databases are capitalised on the basis of the costs incurred to acquire them.<br />
These costs are amortised over their estimated useful lives (5–10 years).<br />
d) Customer relationships<br />
Capitalised customer relationships refer only to those identified in a business<br />
combination. Customer relationships have been valued on the basis of the so-called<br />
Multi-period Excess Earnings Method and are amortised using the straight-line<br />
method over the estimated useful lives of the assets. Estimated useful lives have<br />
been calculated on the basis of the customers’ average rate of business renewal<br />
in each company and result in amortisation periods of between 4 and 20 years.<br />
e) Other intangible assets<br />
Other intangible assets principally refer to business systems and systems development<br />
in progress. Internal development projects are capitalised if the investment<br />
meets the definition of intangible asset, has an estimated useful life of at<br />
least 3 years and exceeds SEK 1,000 thousand.<br />
2.8 Property, plant and equipment<br />
Property, plant and equipment are stated at historical cost less depreciation. Subsequent<br />
costs are included in the asset’s carrying amount or recognised as a separate<br />
asset, as appropriate, only when it is probable that future economic benefits<br />
associated with the item will flow to the Group and the cost of the item can be<br />
measured reliably. All other repairs and maintenance are recognised in the income<br />
statement during the financial period in which they are incurred.<br />
Land is not depreciated. Depreciation on other assets is calculated using the<br />
straight-line method to allocate their cost to their residual values over their estimated<br />
useful lives, as follows:<br />
Buildings 25 – 50 years<br />
Land improvements 15 – 20 years<br />
Computers 2–5 years<br />
Servers 5–10 years<br />
Office equipment 5 – 10 years<br />
Other equipment 5 – 20 years<br />
The assets’ residual values and useful lives are reviewed, and adjusted if appropriate,<br />
at each balance sheet date. An asset’s carrying amount is written down immediately<br />
to its recoverable amount if the asset’s carrying amount is greater than its estimated<br />
recoverable amount.<br />
Gains and losses on disposal are determined by comparing the proceeds with<br />
the carrying amount and are recognised in the income statement.<br />
2.9 Impairment<br />
Assets that have an indefinite useful life are not subject to amortisation and are<br />
tested annually for impairment, or more frequently when there is an indication of<br />
impairment.<br />
Assets that are subject to amortisation are reviewed for impairment whenever<br />
events or changes in circumstances indicate that the carrying amount may not be<br />
recoverable. An impairment loss is recognised from the amount by which the
38<br />
asset’s carrying amount exceeds its recoverable amount. The recoverable<br />
amount is the higher of an asset’s fair value less costs to sell and value in use. For<br />
the purposes of assessing impairment, assets are grouped at the lowest levels for<br />
which there are separately identifiable cash flows (cash generating units).<br />
2.10 Financial assets<br />
The Group classifies its financial assets in the following categories: at fair value<br />
through profit or loss, loans and receivables, and available-for-sale financial<br />
assets. The classification depends on the purpose for which the financial assets<br />
were acquired. Management determines the classification of its financial assets at<br />
initial recognition and reviews the classificiation at each reporting date.<br />
a) Financial assets at fair value through profit or loss<br />
Financial assets at fair value through profit or loss are financial assets held for<br />
trading. A financial asset is classified in this category if acquired principally for the<br />
purpose of selling in the short term. Derivatives are also categorised as held for<br />
trading unless they are designated as hedges. Assets in this category are classified<br />
as current assets if expected to be settled within 12 months; otherwise, they are<br />
classified as non-current. During the financial year, the Group had no assets<br />
belonging to this category.<br />
b) Loans and receivables<br />
Loans and receivables are non-derivative financial assets with fixed or determinable<br />
payments that are not quoted in an active market. They characteristically arise<br />
when the Group supplies money, goods or services directly to a customer without<br />
intending to trade with the claim that has arisen. They are included in current<br />
assets, except for maturities greater than 12 months after the balance sheet date.<br />
These are classified as non-current assets. This category includes trade and other<br />
receivables in the balance sheet.<br />
c) Available-for-sale financial assets<br />
Available-for-sale financial assets are non-derivatives that are either designated in<br />
this category or not classified in any of the other categories. They are included in<br />
non-current assets unless management intends to dispose of the investment<br />
within 12 months of the balance sheet date.<br />
Regular purchases and sales of financial assets are recognised on the tradedate<br />
– the date on which the Group commits to purchase or sell the asset. Investments<br />
are initially recognised at fair value plus transaction costs, for all financial<br />
assets not carried at fair value through profit or loss. Financial instruments are<br />
derecognised when the rights to receive cash flows from the investments have<br />
expired or have been transferred and the Group has transferred substantially all<br />
risks and rewards of ownership. Available-for-sale financial assets and financial<br />
assets at fair value through profit or loss are subsequently carried at fair value.<br />
Realised and unrealised gains or losses arising from changes in the fair value of<br />
the financial assets at fair value through profit or loss are presented in the income<br />
statement in the period in which they arise. Unrealised gains or losses arising from<br />
changes in the fair value of instruments classified as available-for-sale are recognised<br />
in other comprehensive income. When instruments classified as available-for-sale<br />
are sold or impaired, the accumulated fair value adjustments are included in the<br />
income statement as gains and losses from financial instruments.<br />
The fair values of quoted investments are based on current bid prices. If the<br />
market for a specific financial asset is not active (and for unlisted securities), the<br />
Group establishes fair value by using valuation techniques. These include the use<br />
of recent arm’s length transactions, reference to other instruments that are substantially<br />
the same, discounted cash flow statement and option pricing models<br />
that have been refined to reflect the issuer’s special conditions.<br />
The Group assesses at each balance sheet date whether there is objective<br />
evidence that a financial asset or a group of financial assets is impaired. If any<br />
such evidence exists for available-for-sale financial assets, the cumulative loss –<br />
measured as the difference between the historical cost and the current fair value,<br />
less any impairment loss on that financial asset previously recognised in profit or<br />
loss – is removed from equity and recognised in the income statement. Impairment<br />
losses recognised in the income statement on equity instruments are not reversed<br />
through the income statement.<br />
2.11 Derivative financial instruments<br />
Derivatives are initially recognised at fair value on the date a derivative contract is<br />
entered into and are subsequently remeasured at their fair value. The method of<br />
recognising the resulting gain or loss depends on whether the derivative is designated<br />
as a hedging instrument, and if so, the nature of the item being hedged.<br />
The Group designates certain derivatives as either: (1) hedges of the fair value of<br />
recognised liabilities (fair value hedge); (2) hedges of a particular risk associated<br />
with a recognised liability or a highly probable forecast transaction (cash flow<br />
hedge); or (3) hedges of a net investment in a foreign operation (net investment<br />
hedge). As of balance sheet date, the Group uses only cash flow hedges.<br />
The Group documents, at the inception of the transaction, the relationship<br />
between hedging instruments and hedged items, as well as its risk management<br />
objectives and strategy for undertaking various hedging transactions. The Group<br />
also documents its assessment, both at hedge inception and on an ongoing<br />
basis, of whether the derivatives that are used in hedging transactions are highly<br />
effective in offsetting changes in fair values or cash flows of hedged items.<br />
Cash flow hedges<br />
The effective portion of changes in the fair value of derivatives that are designated<br />
and qualify as cash flow hedges is recognised in other comprehensive<br />
income. The gain or loss relating to the ineffective portion is recognised immediately<br />
in the income statement as financial income or expense.<br />
Amounts accumulated in equity are recycled in the income statement in the<br />
periods when the hedged item affects profit or loss.<br />
When a hedging instrument expires or is sold, or when a hedge no longer<br />
meets the criteria for hedge accounting, any cumulative gain or loss existing in<br />
equity at the time remains in equity and is recognised when the forecast transaction<br />
is ultimately recognised in the income statement. When a forecast transaction is<br />
no longer expected to occur, the cumulative gain or loss that was reported in<br />
equity is immediately transferred to the income statement.<br />
2.12 Inventories<br />
Inventories are stated at the lower of cost and net realisable value. Cost is determined<br />
using the first-in, first-out (FIFO) method. The cost of finished goods and<br />
work in progress comprises design costs, raw materials, direct labour, other<br />
direct costs and related production overheads (based on normal operating<br />
capacity). It excludes borrowing costs. Net realisable value is the estimated selling<br />
price in the ordinary course of business, less applicable variable selling expenses.<br />
2.13 Trade receivables<br />
Trade receivables are recognised initially at fair value, less provision for impairment.<br />
A provision for impairment of trade receivables is established when there is objective<br />
evidence that the Group will not be able to collect all amounts due according to<br />
the original terms of the receivables. The amount of the provision is the difference<br />
between the asset’s carrying amount and the present value of the estimated<br />
future cash flows. The provision is recognised in the income statement among<br />
other expenses.<br />
2.14 Cash and cash equivalents<br />
Cash and cash equivalents includes cash in hand, deposits held at call with banks<br />
and any short-term investments. Short-term investments consist of securities<br />
with maturities of less than three months.<br />
2.15 Borrowings<br />
Borrowings are recognised initially at fair value, net of transaction costs incurred.<br />
Borrowings are subsequently stated at amortised cost. Any difference between<br />
the proceeds (net of transaction costs) and the redemption value is recognised in<br />
the income statement over the period of the borrowings using the effective interest<br />
method.<br />
Borrowings are classified as current liabilities unless the Group has an unconditional<br />
right to defer settlement of the liability for at least 12 months after the balance<br />
sheet date.
2.16 Taxes<br />
Deferred tax is provided in full, using the liability method, on temporary differences<br />
arising between the tax bases of assets and liabilities and their carrying amounts<br />
in the consolidated financial statements. However, the deferred tax is not<br />
accounted for if it arises from initial recognition of an asset or a liability in a transaction<br />
other than a business combination that at the time of the transaction affects neither<br />
accounting nor taxable profit or loss. Deferred tax is determined using tax rates<br />
(and laws) that have been enacted or substantially enacted by the balance sheet<br />
date and are expected to apply when the related deferred tax asset is realised or<br />
the deferred tax liability is settled. Deferred tax relating to items that are recognised<br />
directly in shareholders’ equity is recognised directly in shareholders’ equity.<br />
Deferred tax assets are recognised to the extent that it is probable that future<br />
taxable profit will be available against which the temporary differences can be<br />
utilised. Deferred income tax assets and liabilities are offset when there is a legal<br />
right to offset current income tax assets and liabilities and when deferred taxes<br />
refer to the same tax authority.<br />
The tax expense for the year comprises current and deferred tax. Tax is<br />
recognised in the income statement, except to the extent that it relates to items<br />
recognised in other comprehensive income or directly in equity. In this case, the<br />
tax is also recognised in other comprehensive income or directly in equity, respectively.<br />
Temporary differences arising from investments in subsidiaries and associates<br />
where the Group is able to control the timing of the reversal of the temporary difference<br />
and it is not probable that the temporary difference will be reversed in the<br />
foreseeable future are not recognised.<br />
2.17 Employee benefits<br />
a) Pension obligations<br />
Group companies operate various pension schemes. The schemes are generally<br />
funded through payments to insurance companies or trustee-administered funds,<br />
determined by periodic actuarial calculations. The Group has both defined benefit<br />
and defined contribution plans. A defined benefit plan is a pension plan defining<br />
an amount of pension benefit that an employee will receive on retirement, usually<br />
dependent on one or more factors such as age, years of service and compensation.<br />
The Group has no legal or constructive obligations to pay further contributions<br />
to the defined contribution pension plans if the fund does not hold sufficient<br />
assets to pay all employees the benefits relating to employee service in the current<br />
and prior periods.<br />
The liability recognised in the balance sheet in respect of defined benefit pension<br />
plans is the present value of the defined benefit obligation at the balance sheet<br />
date less the fair value of plan assets, together with adjustments for unrecognised<br />
actuarial gains or losses. The defined benefit obligation is calculated annually by<br />
independent actuaries using the projected unit credit method. The present value<br />
of the defined benefit obligation is determined by discounting the estimated future<br />
cash outflows by using interest rates of high-quality corporate bonds that are<br />
denominated in the currency in which the benefits will be paid and that have<br />
terms to maturity approximating to the terms of the related pension liability.<br />
The Group applies the corridor rule which states that actuarial gains and losses<br />
arising from experience adjustments and changes in actuarial assumptions in<br />
excess of the greater of 10% of the value of the plan assets or 10% of the defined<br />
benefit obligation are charged or credited to income over the employees’ expected<br />
average remaining working lives.<br />
Past-service costs are recognised immediately in income, unless the changes<br />
to the pension plan are conditional on the employees remaining in service for a<br />
specific period of time (the vesting period). In this case, the past-service costs are<br />
amortised on a straight-line basis over the vesting period.<br />
For defined contribution plans, the Group pays contributions to publicly or privately<br />
administered pension insurance plans on a mandatory, contractual or voluntary<br />
basis. The Group has no further payment obligations once the contributions have<br />
been paid. The contributions are recognised as employee benefit expenses when<br />
they are due. Prepaid contributions are recognised as an asset to the extent that<br />
a cash refund or reduction in the future payments is available.<br />
b) Termination benefits<br />
Termination benefits are payable when employment is terminated by the Group<br />
before the normal retirement date, or whenever an employee accepts voluntary<br />
redundancy in exchange for these benefits. The Group recognises termination<br />
39<br />
benefits when it is demonstrably committed to either: terminating the employment<br />
of current employees according to a detailed formal plan without possibility of<br />
withdrawal; or providing termination benefits as a result of an offer made to<br />
encourage voluntary redundancy.<br />
2.18 Provisions<br />
Provisions for restructuring costs, legal claims, etc. are recognised when: the<br />
Group has a present legal or constructive obligation as a result of past events; it is<br />
probable that an outflow of resources will be required to settle the obligation; and<br />
the amount has been reliably estimated. A provision is discounted to present value<br />
if it is due to be settled later than 12 months after the balance sheet date and if its<br />
effect is significant. Provisions are not recognised for future operating losses.<br />
2.19 Revenue recognition<br />
Revenue comprises the fair value of the consideration received or receivable for<br />
the sale of goods and services in the ordinary course of the group’s activities,<br />
excluding value-added tax and discounts and after eliminating sales within the<br />
group. Revenue is recognised as follows:<br />
a) Income from catalogue business<br />
Income from catalogue business activities is accounted for in connection with distribution<br />
to the customer.<br />
b) Online income<br />
Online income is allocated over the period covered by the contract or alternatively<br />
based on the customer’s pattern of use.<br />
c) Royalty income<br />
Royalty income is recognised on an accrual basis in accordance with the substance<br />
of the relevant agreements.<br />
d) Dividend income<br />
Dividend income is recognised when the right to receive payment is established.<br />
2.20 Leases<br />
Leases for non-current assets where the Group substantially carries all the risks<br />
and rewards incidental to ownership of an asset are classified as finance leases.<br />
The leased asset is recognised as a non-current asset and a corresponding financial<br />
liability is recognised in interest-bearing liabilities. The initial value of these two<br />
items comprises the lower of the fair value of the assets or the present value of<br />
the minimum lease payments. Future lease payments are divided between<br />
amortisation of the liability and financial expenses, so that every accounting period<br />
is charged with an interest amount corresponding to a fixed interest rate on the<br />
reognised liability in each period. The leased asset is depreciated according to the<br />
same principles that apply to other assets of the same type. If it is uncertain<br />
whether the asset will be taken over at the end of the leasing period, the asset is<br />
depreciated over the lease term if this is shorter than the useful life that applies to<br />
other assets of the same type.<br />
Leases for assets where the risks and rewards incidental to ownership essentially<br />
remain with the lessor are classified as operating leases. The lease payments are<br />
recognised as an expense on a straight-line basis over the lease term.<br />
2.21 Dividend distribution<br />
Dividend distribution to the Parent Company’s shareholders is recognised as a<br />
liability in the consolidated financial statement in the period in which the dividends<br />
are approved by the Parent Company’s shareholders.<br />
2.22 Discontinued operations<br />
Operations that have represented a separate major line of business or geographical<br />
area of operations that have either been disposed of, or are classified as held for<br />
sale, are accounted for in accordance with IFRS 5 Non-current Assets Held for<br />
Sale and Discontinued Operations. According to the standard, all income and<br />
expenses attributable to the discontinued operation are reported on a separate<br />
line in the consolidated income statement. The consolidated cash flow is also<br />
presented with a separation between continuing and discontinued operations.<br />
The figures for the comparison period have been restated accordingly.
40<br />
2.23 Cash flow statement<br />
The cash flow statement is prepared in accordance with the indirect method. The<br />
reported cash flow includes only transactions that lead to cash payments or<br />
disbursements.<br />
2.24 The Parent Company’s accounting policies<br />
The Parent Company has prepared its annual report in accordance with the<br />
Swedish Annual Accounts Act and the Swedish Financial Reporting Board’s<br />
standard RFR 2 Accounting for Legal Entities. RFR 2 states that in the report for<br />
the legal entity, the Parent Company shall apply all EU-endorsed IFRS and statements<br />
as far as possible within the framework of the Annual Accounts Act and the Pension<br />
Protection Act, and with respect to the connection between accounting and taxation.<br />
The standard specifies what exceptions from or additions to the IFRSs shall<br />
be made.<br />
The Parent Company’s accounting policies correspond to the Group’s<br />
accounting policies in all material aspects.<br />
Group contributions<br />
Group contributions are recognised according to their economic content. Group<br />
contributions received from subsidiaries are equated with dividends and<br />
recognised as financial income.<br />
note 3. financial risk management<br />
3.1 Financial risk factors<br />
The Group is exposed to different types of financial risks through its handling of<br />
financial instruments. The primary risks are currency risk, interest-rate risk, credit<br />
risk and liquidity risk.<br />
Guidelines for the Group’s management of financial risks are adopted annually<br />
by the Board of Directors in the Parent Company. These guidelines are summarised<br />
in the Group’s financial policy. Risk management is carried out by a central<br />
treasury department in the Group company <strong>Bisnode</strong> AB. The treasury department<br />
administers the Group’s central accounts and identifies, evaluates and hedges<br />
financial risks. The Group’s overall risk management programme focuses on the<br />
unpredictability of financial markets and seeks to minimise potential adverse<br />
effects on the Group’s financial performance.<br />
a) Currency risk<br />
Currency risk is the risk for fluctuations in the fair value of, or the future cash flow<br />
from, a financial instrument due to changes in currency exchange rates.<br />
The Group operates in 17 countries and is exposed to foreign exchange risk arising<br />
from various currency exposures, primarily with respect to the DKK, EUR, GBP,<br />
NOK and USD. The Group’s currency risk mainly arises through transaction exposure,<br />
translation exposure and cash exposure.<br />
–Transaction exposure<br />
Transaction exposure is the risk that operating revenue or expenses will be negatively<br />
affected as a result of foreign currency fluctuations. Each company manages its<br />
transaction exposure as part of its overall activities. The basic principle for all business<br />
transactions is for revenue and expenses to be denominated in the same operating<br />
currency. Foreign exchange exposure in specific large transactions and larger<br />
flows into subsidiaries may be hedged.<br />
The Group’s greatest transaction exposure is USD, SEK and DKK. In 2010 the<br />
net flow in these currencies amounted to SEK –37 million, SEK –12 million and<br />
SEK –8 million respectively.<br />
–Translation exposure<br />
Translation exposure is the risk that net assets in foreign subsidiaries will be affected<br />
by exchange rate fluctuations. The Group’s policy is that long-term subsidiary<br />
holdings do not need to hedge foreign currencies. This is partly to produce a<br />
good spread of risk between foreign and Swedish assets and partly to avoid<br />
short-term, major negative liquidity effects for the owners. By this reasoning,<br />
investments in and loans from subsidiaries to any of the subsidiaries, that are of a<br />
long-term nature are comparable to reported net assets. However, hedging of foreign<br />
exchange exposure is required for the value of foreign assets and/or subsidiaries<br />
that are planned to be sold.<br />
From the Group’s total exposure to foreign subsidiaries’ net assets at year-end,<br />
71% pertains to EUR and 15% to DKK.<br />
– Cash exposure<br />
Cash exposure occurs when a bank balance is held in a foreign currency other<br />
than the operating currency. The table below analyses the impact of changes in<br />
the primary currencies on the Group’s profit before tax:<br />
2010<br />
2009<br />
Change in SEK Change in SEK<br />
SEK thousands +10% -10% +10% 10%<br />
DKK 4,692 -4,692 5,517 -5,517<br />
EUR 7,740 -7,740 21,713 -21,713<br />
GBP 5,226 -5,226 5,765 -5,765<br />
NOK -12,155 12,155 -12,281 12,281<br />
USD 4,377 -4,377 2,000 -2,000<br />
The table above shall be interpreted as follows: If the Swedish krona had<br />
strengthened by 10% against the Danish krona with all other variables held constant,<br />
pre-tax profit for the year would have been SEK 4,692 thousand (5,517)<br />
higher. All changes in pre-tax profits are due to foreign exchange gains/losses on<br />
translation of cash and cash equivalents.<br />
b) Interest rate risk<br />
Interest rate risk is the risk for fluctuations in the fair value of, or the future cash<br />
flow from, a financial instrument due to changes in market interest rates.<br />
The Groups’ interest rate risk arises primarily from long-term borrowings. The<br />
Groups’ finance policy states that interest should not be fixed for more than<br />
12 months unless otherwise stated by current bank agreements. According to<br />
the current bank agreements, at least 85% of total borrowings shall carry fixed<br />
interest. The Group uses interest rate swaps to convert from variable to fixed<br />
interest and achieve the desired fixed interest on the loans.<br />
The Group continually analyses its interest rate exposure by calculating the<br />
impact on profit and loss of a defined interest rate shift.<br />
c) Credit risk<br />
The Group consists of more than 100 companies and has operations in 17 countries,<br />
and thus has no significant concentration of credit risks. The credit risk is also<br />
further limited by financing a significant portion of operations through advance<br />
payments.<br />
Surplus liquidity in specific companies in countries without a central bank<br />
account may be invested locally to the extent that it would be unrealistic to use<br />
the surplus liquidity in the Group. Such investments should be made only in<br />
established banks with a rating of at least A-2. Derivative contracts and cash<br />
transactions are entered into only with European business banks with high credit<br />
ratings.<br />
For information on the credit quality of trade receivables, age analysis, etc., see<br />
Note 22.<br />
d) Liquidity risk<br />
<strong>Bisnode</strong> continually assesses its future capital needs on the basis that the Group<br />
should be able to control a minimum of SEK 50 million, including available bank<br />
funds, etc., with two banking days’ notice. Of the loan share, including unused<br />
committed credits but excluding pension liabilities, a maximum of 33% may be<br />
due for payment within one year and 66% within two years.<br />
The Group uses bank overdraft facilities to handle short-term fluctuations in<br />
liquidity needs.<br />
Management monitors liquidity on the basis of a rolling two-week projection.<br />
This projection, which is prepared weekly, provides details of expected incoming<br />
and outgoing payments and cash balances. In connection with the acquisition or<br />
sale of companies, the effects of the transaction in question are analysed in detail<br />
with respect to future cash flows and the capital structure of the company.<br />
The table below analyses the Group’s financial liabilities that will be settled on a<br />
net basis into relevant maturity groupings based on the remaining time to contractual<br />
maturity at the balance sheet date. The amounts disclosed in the table<br />
are the contractual undiscounted cash flows.
31/12/2010 Maturity date<br />
SEK thousands<br />
Within<br />
1 year<br />
Between<br />
1-5 years<br />
Later than<br />
5 years<br />
Bank borrowings 450,650 1,998,250<br />
Loans from shareholders 1,442,602<br />
Borrowings for finance leases 6,307 25,866 65,606<br />
Derivative financial instruments 80,861 74,037<br />
Other borrowings 7,242 10,884<br />
Trade and other payables 1,451,493<br />
Total 1,996,553 3,551,639 65,606<br />
31/12/2009 Maturity date<br />
SEK thousands<br />
Within<br />
1 year<br />
Between<br />
1-5 years<br />
Later than<br />
5 years<br />
Bank borrowings 457,762 2,514,775<br />
Loans from shareholders 1,442,602<br />
Borrowings for finance leases 6,952 28,304 80,446<br />
Derivative financial instruments 95,308 158,771<br />
Other borrowings 5,770 17,310<br />
Trade and other payables 1,565,830 2,234<br />
Total 2,131,622 4,163,996 80,446<br />
3.2 Financial risk management<br />
The Group’s objectives for management of capital are to safeguard the Group’s<br />
ability to continue as a going concern and to maintain an optimal capital structure<br />
and thereby reduce the cost of capital. The Group monitors capital principally on<br />
the basis of net debt. The current interest rate margin, and thus the cost of capital,<br />
is based on the net debt to EBITDA ratio. According to current bank covenants,<br />
net debt is defined as total interest-bearing debt, including finance leases and<br />
provisions for pensions but excluding shareholder loans and convertible bonds,<br />
less cash and cash equivalents. EBITDA is defined as Earnings Before Interest,<br />
Taxes, Depreciation and Amortisation. Management regularly monitors and analyses<br />
the net debt based on changes in, for example, cash flow from operating and<br />
investing activities.<br />
The net debt at 31 December 2010 was SEK 2,289 million (2,685). The change<br />
in net debt is shown below:<br />
SEK thousands 31/12/2010 31/12/2009<br />
Borrowings Note 25 3,550,890 3,861,314<br />
less: Loans from shareholders Note 25 -1,228,608 -1,137,600<br />
Provisions for pensions Note 26 209,568 217,711<br />
Contingent purchase considerations Note 27 35,330 142,118<br />
Accrued interest income/expenses Note 21, 28 -311 232<br />
Less: Cash and cash equivalents Note 24 -259,167 -367,844<br />
Less: Interest-bearing receivables Note 21 -19,112 -31,245<br />
Net debt 2,288,590 2,684,686<br />
3.3 Fair value estimation<br />
The fair value of financial instruments traded in active markets (such as trading<br />
and available-for-sale securities) is based on quoted market prices at the balance<br />
sheet date. The quoted market price used for financial assets held by the Group<br />
is the current bid price. The quoted market price used for financial liabilities is the<br />
actual asking price.<br />
41<br />
note 4. critical accounting estimates and judgements<br />
The preparation of financial statements in accordance with IFRS requires the<br />
management to make judgements, estimates and assumptions that affect the<br />
application of accounting policies and the reported amounts of assets, liabilities,<br />
income and expenses. These estimates and judgements are based on historical<br />
experience and other factors that are belived to be reasonable under the circumstances.<br />
Actual outcomes may differ from these estimates and assumptions if<br />
other measures are taken and other conditions exist. The estimates and judgements<br />
that have a significant risk of causing material adjustments in future financial years<br />
are outlined below.<br />
Impairment of Goodwill<br />
The carrying amount of goodwill at 31 December 2010 was SEK 4,529,850 thousand<br />
(4,750,684). Goodwill is reviewed for impairment annually or whenever events or<br />
changes in circumstances indicate that the carrying amount may not be recoverable.<br />
The Group’s annual impairment testing of goodwill is based on estimates and<br />
judgements about future growth, profitability and investment levels (see Note 17).<br />
Deferred tax assets<br />
The carrying amount of deferred tax assets at 31 December was SEK 134,386<br />
thousand (114,406). Deferred tax assets are recognised to the extent that it is<br />
probable that future taxable profit will be available against which the temporary<br />
differences can be utilised. Judgement on future taxable surplus is thus required<br />
in determining the value of deferred tax assets.<br />
Pension obligations<br />
The present value calculation of defined benefit obligations makes assumptions<br />
about annual salary increase, inflation and employee turnover. Current interest<br />
rates of high quality corporate bonds with an appropriate maturity are used as<br />
discount interest rates (see Note 26). The carrying amount of pension obligations<br />
at 31 December was SEK 209,568 thousand (217,711).
42<br />
note 5. operating segments<br />
Operating segments are reported in a manner consistent with the internal reporting<br />
provided to the chief operating decision-maker. The chief operating decision-maker,<br />
who is responsible for allocating resources and assessing performance of the<br />
operating segments, has been identified as the Chief Executive Officer of <strong>Bisnode</strong>.<br />
The Chief Executive Officer consider the business from both a geographical<br />
and product perspective.<br />
The Group is organised in four geographical regions – Nordic, DACH, BeNeFra<br />
and Central Europe – all covering the product offerings Market Solutions, Credit<br />
Solutions and Business Information Solutions. In addition there are two separate<br />
business areas, Product Information and Software and Applications, and central<br />
support functions. This structure is the basis for the reporting of operating segments.<br />
The Chief Executive Officer assesses the performance of the operating segments<br />
based on a measure of EBITA, operating profit less amortisation of intangible<br />
assets arising from business combinations.<br />
Segment revenue, expenses, assets and liabilities include amounts of such<br />
items that can be allocated to a segment on a resonable basis. Only items that<br />
are directly attributable to the operating activities of the respective segments are<br />
allocated. Financial items, such as interest or dividend income, gains on the sale<br />
of investments or income tax expense are not allocated to the respective segments.<br />
The corresponding balance sheet items are not included in the allocation of<br />
assets to the respective segments. The segment’s gross investments include all<br />
investments in intangible assets and property, plant and equipment, including<br />
own work capitalised. All transactions between business units are carried out on<br />
an arm’s length basis.<br />
2010 Nordic DACH BeNeFra<br />
<strong>Bisnode</strong>’s operating segments consists of the following regions and business areas:<br />
Region Nordic<br />
consists of Denmark, Estonia, Finland, Norway and Sweden<br />
Region DACH<br />
consists of Austria, Germany and Switzerland<br />
Region BeNeFra<br />
consists of Belgium, France and the Netherlands<br />
Region Central Europe<br />
consists of Croatia, the Czech Republic, Hungary, Poland, Slovakia and Slovenia<br />
Business area Product Information<br />
offers advertising space in business magazines, catalogues and online services.<br />
The customers are primarily suppliers of industrial components.<br />
Business area Software and Applications<br />
offers software and applications based on business information. The business<br />
intelligence softwares integrates information analysis with system development to<br />
help companies get better decision support.<br />
Central functions include costs for the Group’s joint units, such as the accounting<br />
and finance, corporate communications and CIO functions. Added to this are<br />
costs for acquisitions and divestitures and the Group’s three competence centres.<br />
Central<br />
Europe<br />
Product<br />
Information<br />
Software<br />
& Applicat.<br />
Central<br />
func./elim. Total<br />
External revenue 1,952,528 849,763 740,465 177,680 435,564 295,486 4,451,486<br />
Inter-segment sales 35,695 10,305 232 4,629 1,735 64,484 -117,080 0<br />
Other operating income 19,175 9,008 8,713 2,269 10,808 14,477 -2,871 61,579<br />
Total operating income 2,007,398 869,076 749,410 184,578 448,107 374,447 -119,951 4,513,065<br />
Goods and services -570,640 -179,951 -194,323 -18,880 -61,931 -64,256 116,668 -973,313<br />
Personnel costs -769,270 -407,358 -357,899 -77,159 -196,133 -198,808 -53,771 -2,060,398<br />
Depreciation, amortisation and impairment losses* -50,729 -24,903 -35,822 -5,156 -9,752 -4,567 -4,161 -135,090<br />
Other expenses -245,840 -152,646 -131,227 -60,185 -109,527 -60,897 -48,096 -808,418<br />
Total operating expenses -1,636,479 -764,858 -719,271 -161,380 -377,343 -328,528 10,640 -3,977,219<br />
Operating profit, EBITA 370,919 104,218 30,139 23,198 70,764 45,919 -109,311 535,846<br />
Gross investments 36,612 23,094 15,794 7,475 7,189 4,333 985 95,482<br />
Assets 3,482,523 1,166,195 1,196,682 249,959 982,132 554,140<br />
2009 Nordic DACH BeNeFra<br />
Central<br />
Europe<br />
Product<br />
Information<br />
Software<br />
& Applicat.<br />
Central<br />
func./elim. Total<br />
External revenue 2,049,228 899,926 734,720 181,010 527,976 347,887 4,740,747<br />
Inter-segment sales 36,369 12,929 283 1,883 1,790 75,913 -129,167 0<br />
Other operating income 50,697 8,055 12,558 4,428 4,345 13,149 -4,585 88,647<br />
Total operating income 2,136,294 920,910 747,561 187,321 534,111 436,949 -133,752 4,829,394<br />
Goods and services -669,028 -203,289 -181,249 -21,147 -77,137 -78,864 127,905 -1,102,809<br />
Personnel costs -814,414 -437,796 -343,404 -77,834 -249,033 -226,614 -49,834 -2,198,929<br />
Depreciation, amortisation and impairment losses* -53,199 -26,512 -29,371 -4,831 -12,465 -7,429 -1,262 -135,069<br />
Other expenses -214,769 -171,948 -120,753 -57,258 -143,922 -64,248 -27,006 -799,904<br />
Total operating expenses -1,751,410 -839,545 -674,777 -161,070 -482,557 -377,155 49,803 -4,236,711<br />
Operating profit, EBITA 384,884 81,365 72,784 26,251 51,554 59,794 -83,949 592,683<br />
Gross investments -34,296 -31,925 -24,712 -7,056 -11,258 -7,736 -1,718 -118,701<br />
Assets 3,537,748 1,304,788 1,239,163 276,305 1,058,835 651,012<br />
*excluding depreciation, amortisation and impairment of surplus values arising from business combinations.
note 6. other operating income<br />
Group<br />
2010 2009<br />
Sale of subsidiaries 6,655 25,942<br />
Sale of available-for-sale financial assets 3,620<br />
Sale of property, plant and equipment 6,685 1,092<br />
Foreign exchange gains of an operating nature 5,791 4,448<br />
Own work capitalised 15,958 19,050<br />
Negative goodwill recognised in the income statement 1,533<br />
Other operating income 26,490 32,962<br />
Total 61,579 88,647<br />
note 7. Board members and senior executives<br />
43<br />
2010 2009<br />
No. on of No. on of<br />
balance whom balance whom<br />
date men date men<br />
Group<br />
Board members 363 320 452 404<br />
Chief executive officer and other senior executives 242 168 281 200<br />
Parent Company<br />
Board members 6 5 7 6<br />
Chief executive officer and other senior executives 1 1 1 1<br />
note 8. average number of employees. average number of Board members, ceo and senior executives<br />
Average<br />
number of<br />
employees<br />
2010 2009 2010 2009<br />
of<br />
whom<br />
men<br />
Average<br />
number of<br />
employees<br />
of<br />
whom<br />
men<br />
Average no. of<br />
Board members, CEO<br />
and senior executives<br />
Austria 62 28 68 32 22 16<br />
Belgium 218 136 225 140 26 29<br />
Croatia 15 7 20 11 2 6<br />
Czech Republic 85 45 84 39 13 17<br />
Denmark 71 33 68 32 26 37<br />
Estonia 5 2 5 2 6 2<br />
Finland 98 56 59 26 28 8<br />
France 210 110 132 70 6 8<br />
Germany 659 398 642 381 90 73<br />
Hungary 53 14 55 10 8 7<br />
Netherlands 103 68 137 88 9 26<br />
Norway 278 177 313 186 37 54<br />
Poland 109 39 96 33 2 2<br />
Slovakia 30 6 26 5 5 3<br />
Slovenia 55 23 53 25 1 1<br />
Sweden 897 510 1,050 592 221 290<br />
Switzerland 125 72 124 69 28 29<br />
United Kingdom 7 7 10 8 7 1<br />
Total 3,080 1,731 3,167 1,749 537 609<br />
The total number of employees in the Group at 31 December 2010 was 2,974 (3,095).
44<br />
note 9. Wages, salaries and other remuneration – Group<br />
2010<br />
Board of<br />
Directors, CEO<br />
and senior<br />
executives<br />
Wages, salaries and other remuneration<br />
of which<br />
bonuses<br />
etc.<br />
Other<br />
employees Total<br />
Social<br />
security<br />
costs<br />
of which<br />
pension<br />
costs Total<br />
Austria 1,355 334 27,147 28,502 8,396 124 36,898<br />
Belgium 24,311 3,931 96,487 120,798 33,019 3,396 153,817<br />
Croatia 195 1,902 2,097 832 448 2,929<br />
Czech Republic 3,984 473 11,570 15,554 4,940 76 20,494<br />
Denmark 10,108 1,030 33,779 43,887 3,805 3,266 47,692<br />
Estonia 344 3 1,147 1,491 514 2,005<br />
Finland 7,814 926 41,266 49,080 10,774 8,301 59,854<br />
France 11,879 2,210 82,350 94,229 44,248 138,477<br />
Germany 40,837 8,852 319,391 360,228 63,630 7,149 423,858<br />
Hungary 2,667 508 5,802 8,469 2,438 2,032 10,907<br />
Netherlands 4,261 143 40,129 44,390 7,923 1,897 52,313<br />
Norway 19,494 2,804 123,964 143,458 45,895 10,874 189,353<br />
Poland 507 12,643 13,150 2,246 1,076 15,396<br />
Slovakia 2,042 2,042 716 2,758<br />
Slovenia 1,021 248 12,299 13,320 6,717 3,950 20,037<br />
Sweden 87,008 15,730 382,654 469,662 225,413 64,602 695,075<br />
Switzerland 10,021 103 69,379 79,400 12,412 6,464 91,812<br />
United Kingdom 1,257 111 2,673 3,930 935 278 4,865<br />
Total 227,063 37,406 1,266,624 1,493,687 474,853 113,933 1,968,540<br />
2009<br />
Board of<br />
Directors, CEO<br />
and senior<br />
executives<br />
Wages, salaries and other remuneration<br />
of which<br />
bonuses<br />
etc.<br />
Other<br />
employees Total<br />
Social<br />
security<br />
costs<br />
of which<br />
pension<br />
costs Total<br />
Austria 2,326 616 27,966 30,292 9,241 128 39,533<br />
Belgium 28,078 6,597 111,382 139,460 33,544 3,666 173,004<br />
Croatia 598 2,581 3,179 691 3,870<br />
Czech Republic 4,443 661 11,114 15,557 4,671 58 20,228<br />
Denmark 12,486 2,578 37,312 49,798 4,133 3,638 53,931<br />
Estonia 257 1,164 1,421 512 1,933<br />
Finland 7,630 24,758 32,388 6,486 5,668 38,874<br />
France 9,587 2,738 61,463 71,050 31,749 102,799<br />
Germany 50,619 8,902 356,050 406,669 64,679 3,910 471,348<br />
Hungary 2,367 456 6,147 8,514 2,597 2,037 11,111<br />
Netherlands 6,182 117 57,318 63,500 12,043 3,138 75,543<br />
Norway 5,797 1,821 170,548 176,345 49,396 9,469 225,741<br />
Poland 1,110 157 9,453 10,563 1,875 1,875 12,438<br />
Slovakia 1,848 1,848 690 2,538<br />
Slovenia 1,222 266 13,574 14,796 6,936 4,355 21,732<br />
Sweden 88,671 11,546 421,688 510,359 231,283 65,479 741,642<br />
Switzerland 13,143 3,804 71,667 84,810 9,696 5,467 94,506<br />
United Kingdom 1,121 322 2,531 3,652 1,312 751 4,964<br />
Total 235,637 40,581 1,388,564 1,624,201 471,534 109,639 2,095,735
note 10. compensation to Board members and<br />
senior executives<br />
2010<br />
Fixed<br />
salary/<br />
Board Variable Other Pension<br />
fees salary benefits costs Total<br />
Chairman of the Board<br />
– Håkan Ramsin 333 333<br />
Members of the Board<br />
– Torgny Eriksson 138 138<br />
– Birgitta Klasén 167 167<br />
– Carl Wilhelm Ros 167 167<br />
Chief Executive Officer<br />
– Johan Wall 3,770 3,989 74 1,584 9,417<br />
Other senior executives 14,379 6,084 218 4,607 25,288<br />
Total 18,954 10,073 292 6,191 35,510<br />
Fixed<br />
salary/<br />
Board Variable Other Pension<br />
2009<br />
Chairman of the Board<br />
fees salary benefits costs Total<br />
– Håkan Ramsin<br />
Members of the Board<br />
300 300<br />
– Torgny Eriksson 150 150<br />
– Birgitta Klasén 150 150<br />
– Carl Wilhelm Ros<br />
Chief Executive Officer<br />
150 150<br />
– Johan Wall 3,480 1,870 73 1,471 6,894<br />
Other senior executives 13,779 4,137 228 1,828 19,973<br />
Total 18,009 6,007 301 3,299 27,617<br />
Parent company Board of Directors<br />
Fees to the Board of Directors are determined by the Annual General Meeting.<br />
Aside from the Board fees, there are no agreements for variable salary, pension,<br />
termination benefits or other benefits for the members of the Board.<br />
Chief Executive Officer<br />
Compensation to the CEO of the Parent Company is decided by a remuneration<br />
committee consisting of the Board Chairman and two Board members. Aside<br />
from the monthly salary, there is variable salary based on the actual achievements.<br />
This variable salary component may not exceed 12 monthly salaries.<br />
The CEO’s employment contract contains a mutual notice period of 6 months.<br />
For termination on the part of the company, the CEO has the right to termination<br />
benefits equal to 12 monthly salaries. The CEO has a premium based pension<br />
agreement. The annual premium amounts to 27.5% of the CEO’s fixed salary and<br />
agreed variable salary.<br />
Other senior executives<br />
“Other senior executives” consist of other members of the executive management<br />
team, in total 10 persons (9) in 2010. Compensation to other senior executives<br />
is determined by the CEO of the Parent Company after consultation with the<br />
remuneration committee. Variable salary is paid based on actual achievements.<br />
The maximum range of the variable portion is from 3 to 7 monthly salaries. Service<br />
pension is paid by individual agreements.<br />
Compensation to the executive management team includes a one-time cost of<br />
SEK 4 million in 2010 for additional variable salaries. In addition, a one-time pension<br />
provision of SEK 3 million was recognised in connection to a member of the executive<br />
management team leaving the company.<br />
note 11. Wages, salaries and other remuneration<br />
– parent company<br />
45<br />
Parent Company<br />
Wages, salaries and other remuneration 2010 2009<br />
Board of Directors and CEO 5,922<br />
of which bonuses, etc. 3,989<br />
Total wages, salaries and other remuneration 5,922 0<br />
Social security costs 2,998<br />
of which pension costs 1,127<br />
Total wages, salaries and other remuneration,<br />
pension and social security costs 8,920 0<br />
note 12. fees to auditors<br />
Group Parent Company<br />
2010 2009 2010 2009<br />
Öhrlings PricewaterhouseCoopers<br />
Audit assignment 9,351 10,944 1,050 1,177<br />
Other audit assignments 416 188<br />
Tax assignments 1,152 1,232<br />
Other assignments 1,038 920<br />
Subtotal 11,957 13,284 1,050 1,177<br />
KPMG<br />
Audit assignment 105 106<br />
Tax assignments 113 86<br />
Subtotal 218 192 0 0<br />
Total 12,175 13,476 1,050 1,177<br />
note 13. results from participations in group companies<br />
Parent Company<br />
2010 2009<br />
Dividend recieved 100,000 100,000<br />
Group contributions received 92,904 77,312<br />
Total 192,904 177,312<br />
note 14. financial income<br />
Group Parent Company<br />
2010 2009 2010 2009<br />
Interest income, group companies 38<br />
Interest income, other<br />
Dividend from participations in<br />
4,615 5,769 47 1<br />
other companies 797<br />
Other financial income 4,816 5,275<br />
Total 9,431 11,879 47 1
46<br />
note 15. financial expenses<br />
Group Parent Company<br />
2010 2009 2010 2009<br />
Interest expense, group companies -63,706 -58,987 -92,569 -61,312<br />
Interest expense, other -174,575 -210,155 -25,557<br />
Net foreign exchange gains/losses<br />
on financing activities 92,675 74,561 25,614 10,960<br />
Impairment losses on available-for-sale<br />
financial assets -4,628 -56<br />
Other financial expenses -8,020 -6,134 -8 -8<br />
Total -158,254 -200,771 -66,963 -75,918<br />
note 16. income tax expense<br />
Group Parent Company<br />
2010 2009 2010 2009<br />
Current tax for the year -108,028 -73,234<br />
Current tax from previous years -2,448 3,823 1,085<br />
Deferred tax for the year 22,006 -7,943 3,508<br />
Deferred tax from previous years -2,479 8,002<br />
Total -90,949 -69,352 4,593 0<br />
Reconciliation of effective tax<br />
The Parent Company’s tax rate is 26.3%. The difference between tax calculated<br />
according to the Parent Company’s tax rate on the profit before tax and the effective<br />
tax according to the income statement are as follows:<br />
Group<br />
2010 2009<br />
Profit before tax 285,053 239,406<br />
Tax according to the current tax rate of the Parent Company -74,969 -62,964<br />
Effect of other tax rates for foreign subsidiaries -1,998 -1,581<br />
Income not subject to tax 2,483 14,221<br />
Expenses not deductible for tax purposes -12,456 -20,541<br />
Utilisation of previously unrecognised tax losses 11,006 4,143<br />
Tax losses for which no deferred tax<br />
asset was recognised -8,067 -20,285<br />
Tax attributable to previous years -4,927 4,346<br />
Other -2,021 13,309<br />
Tax expense -90,949 -69,352<br />
note 17. intangible assets<br />
Information on impairment<br />
In 2010, impairment losses of SEK 12,868 thousand were recognised on intangible<br />
assets. The amount comprises impairment of intangible assets pertaining to Region<br />
BeNeFra of SEK 4,799 thousand and to Business area Product Information of SEK<br />
5,717 thousand.<br />
During 2009 intangible assets from continuing operations were impaired in an<br />
amount of SEK 44,869 thousand. The amount comprises impairment of goodwill<br />
pertaining to Region Nordic of SEK 14,366 thousand and to Business area Software<br />
and Applications of SEK 27,000 thousand.<br />
Impairment testing of goodwill and other intangible assets<br />
with indefinite useful lives<br />
The Group’s cash-generating units (CGU) consist of the four regions and two<br />
business areas. A breakdown of goodwill and other intangible assets with indefinite<br />
useful lives by CGU is presented in the following table:<br />
Goodwill<br />
Other intangible<br />
assets<br />
Cash-generating unit 2010 2009 2010 2009<br />
Region Nordic 2,297,177 2,334,262 18,542 20,025<br />
Region DACH 714,294 793,310 8,758 2,147<br />
Region BeNeFra 546,123 549,767 2,082 841<br />
Region Central Europe 131,109 142,137 201 1,161<br />
Business area Product Information 507,599 564,859<br />
Business area Software and Applications 333,548 366,349<br />
Total 4,529,850 4,750,684 29,583 24,174<br />
The recoverable amount of the respective units was determined based on calculation<br />
of value in use. Value in use was determined through discounting of expected<br />
future cash flows for the respective units. The assessment of future cash flow was<br />
based on reasonable and verifiable estimates and consists of management’s best<br />
assessments of the financial circumstances that are predicted to exist for the<br />
remainder of the useful life.<br />
The calculations are based on estimated future cash flow for a three-year period.<br />
The cash flow forecasts are estimated by management and based on an assessment<br />
of the expected growth rates, margin growths and investment levels and<br />
took into account the historical development and expected future growth potential<br />
of the respective units. After the three-year period, it was assumed that operating<br />
margins and investments would remain constant and that the growth rate<br />
would drop off slightly. The long-term growth is estimated at 2%, equal to the<br />
expected long-term inflation rate. The discount rate after taxes was estimated at<br />
8.6% (9.0%) and the average tax rate for the Group at 28%.<br />
According to the impairment tests that have been carried out, there is no indication<br />
of impairment of goodwill or other intangible assets with indefinite useful lives. The<br />
variable with the greatest impact on the value in use is the discount rate. If the discount<br />
rate increases by 1%, there is still no indication of impairment.
2009<br />
Goodwill Trademarks Databases<br />
Separately acquired intangible assets<br />
Customer<br />
relations<br />
Other<br />
intangible<br />
assets Databases<br />
Internally generated<br />
intangible assets<br />
47<br />
Other<br />
intangible<br />
assets Total<br />
Accumulated cost<br />
Beginning of year 4,907,345 87,353 335,063 645,974 615,765 213,952 11,450 6,816,902<br />
Acquisition of subsidiaries 150,097 270 261 150,628<br />
Investments 48,521 8,583 17 57,121<br />
Sales and disposals -138 -38,962 -1,724 -40,824<br />
Sale of subsidiaries -89,967 -19,348 -43,789 -35,019 -75,106 -23,603 -1,583 -288,415<br />
Reclassifications -13,337 7,153 6,164 -20<br />
Exchange differences -98,770 1,925 -4,254 -24,352 -17,516 -2,324 -610 -145,901<br />
End of year 4,868,705 69,792 287,020 586,603 519,635 202,298 15,438 6,549,491<br />
Accumulated amortisation and impairment losses<br />
Beginning of year -13,473 -86,819 -204,769 -354,617 -106,772 -7,604 -774,054<br />
Sales and disposals 138 38,962 1,724 40,824<br />
Amortisation, continuing operations -4,612 -30,235 -84,182 -41,577 -18,352 -1,910 -180,868<br />
Amortisation, discontinued operations -2,188 -2,234 -5,558 -9,980<br />
Impairment losses, continuing operations -41,366 -3,046 -457 -44,869<br />
Impairment losses, discontinued operations -76,655 -76,655<br />
Sale of subsidiaries 3,871 17,937 12,737 29,505 23,593 290 87,933<br />
Reclassifications -5 -5<br />
Exchange differences -393 568 6,702 13,203 345 447 20,872<br />
End of year -118,021 -14,469 -100,737 -271,746 -323,133 -99,919 -8,777 -936,802<br />
Net book value 31 December 2009 4,750,684 55,323 186,283 314,857 196,502 102,379 6,661 5,612,689<br />
Separately acquired intangible assets<br />
Internally generated<br />
intangible assets<br />
Other<br />
Other<br />
2010<br />
Accumulated cost<br />
Goodwill Trademarks Databases<br />
Customer<br />
relations<br />
intangible<br />
assets Databases<br />
intangible<br />
assets Total<br />
Beginning of year 4,868,705 69,792 287,020 586,603 519,635 202,298 15,438 6,549,491<br />
Acquisition of subsidiaries 98,467 3,357 4,818 106,642<br />
Investments 44,378 5,970 2,091 52,439<br />
Sales and disposals -2,198 -2,794 -4,992<br />
Sale of subsidiaries -37,137 -10,490 -38,189 -9,545 -95,361<br />
Reclassifications 110 3,674 -12,493 7,462 6,340 5,093<br />
Exchange differences -282,164 -1,783 -25,723 -62,431 -46,885 -13,856 -1,733 -434,575<br />
End of year 4,647,871 68,119 254,481 524,172 467,605 189,535 26,954 6,178,737<br />
Accumulated amortisation and impairment losses<br />
Beginning of year -118,021 -14,469 -100,737 -271,746 -323,133 -99,919 -8,777 -936,802<br />
Acquisition of subsidiaries -1,187 -2,453 -3,640<br />
Sales and disposals 2,198 2,794 4,992<br />
Amortisation -3,873 -26,850 -62,762 -39,367 -16,599 -3,438 -152,889<br />
Impairment losses -5,717 -2,069 -5,082 -12,868<br />
Sale of subsidiaries 10,489 14,468 3,718 28,675<br />
Reclassifications -1,370 -601 118 -1,853<br />
Exchange differences 480 9,192 26,832 34,298 5,757 1,362 77,921<br />
End of year -118,021 -17,862 -114,993 -307,676 -315,393 -109,331 -13,188 -996,464<br />
Net book value 31 December 2010 4,529,850 50,257 139,488 216,496 152,212 80,204 13,766 5,182,273<br />
Other intangible assets pertains mainly to business systems and system development in progress.
48<br />
note 18. property, plant and equipment<br />
2009<br />
Land and<br />
buildings<br />
Computers<br />
and<br />
equipment<br />
Work in<br />
progress Total<br />
Accumulated cost<br />
Beginning of year 291,687 677,926 7,214 976,827<br />
Acquisition of subsidiaries 7,148 7,148<br />
Investments 2,103 59,322 916 62,341<br />
Sales and disposals -2,757 -39,857 -42,614<br />
Sale of subsidiaries -90,340 -5,944 -96,284<br />
Reclassifications -21,381 -25,888 -1,355 -48,624<br />
Exchange difference -12,317 -7,057 114 -19,260<br />
End of year 257,335 581,254 945 839,534<br />
Accumulated depreciation and impairment losses<br />
Beginning of year -81,245 -481,636 -562,881<br />
Acquisition of subsidiaries -5,795 -5,795<br />
Sales and disposals 534 38,753 39,287<br />
Sale of subsidiaries 78,564 78,564<br />
Depreciation, continuing operations -6,383 -66,323 -72,706<br />
Depreciation, discontinued operations -3,741 -3,741<br />
Impairment losses, continued operations -584 -427 -1,011<br />
Impairment losses, discontinued operations -441 -441<br />
Reclassifications 21,381 27,132 48,513<br />
Exchange difference 2,984 4,858 7,842<br />
End of year -63,313 -409,056 -472,369<br />
Net book value 31 December 2009 194,022 172,198 945 367,165<br />
2010<br />
Land and<br />
buildings<br />
Computers<br />
and<br />
equipment<br />
Work in<br />
progress Total<br />
Accumulated cost<br />
Beginning of year 257,335 581,254 945 839,534<br />
Acquisition of subsidiaries 6,925 6,925<br />
Investments 426 42,665 1,507 44,598<br />
Sales and disposals -22,862 -46,837 -69,699<br />
Sale of subsidiaries -26,165 -26,165<br />
Reclassifications -1,533 -343 -1,876<br />
Exchange difference -31,579 -47,808 -79 -79,466<br />
End of year 203,320 508,501 2,030 713,851<br />
Accumulated depreciation and impairment losses<br />
Beginning of year -63,313 -409,056 -472,369<br />
Acquisition of subsidiaries -4,270 -4,270<br />
Sales and disposals 9,022 44,389 53,411<br />
Sale of subsidiaries 20,915 20,915<br />
Depreciation -5,683 -60,395 -66,078<br />
Impairment losses -560 -4,665 -5,225<br />
Reclassifications 1,785 1,785<br />
Exchange difference 7,724 34,954 42,678<br />
End of year -52,810 -376,343 -429,153<br />
Net book value 31 December 2010 150,510 132,158 2,030 284,698<br />
Information on land and tax assessment values<br />
The carrying amount of land amounts to SEK 28,401 thousand (44,675). All holdings<br />
in land and buildings are outside Sweden, for which reason no tax assessment<br />
values are available.<br />
Property, plant and equipment includes buildings and equipment leased by the<br />
Group under finance leases with the following carrying amounts:<br />
2010 2009<br />
Accumulated cost 91,857 103,954<br />
Accumulated depreciation and impairment losses -37,133 -38,387<br />
Net book value 54,724 65,567
note 19. available-for-sale financial assets<br />
Group<br />
2010 2009<br />
Beginning of year 6,993 28,505<br />
Sale of financial assets -182 -2,200<br />
Reclassifications -13,811<br />
Impairment losses/Reversal of impairment losses -1,799 41<br />
Net gains/losses transferred to equity -5,092<br />
Sale of subsidiaries -5 -359<br />
Exchange difference -166 -91<br />
End of year 4,841 6,993<br />
Disclosures of available-for-sale financial assets<br />
Company name<br />
Corporate<br />
identity no. Country<br />
Share of<br />
capital/ Carrying amount<br />
votes (%) 2010 2009<br />
AdHouse AB 556729-8095 Sweden 19.9/19.9 1,101 1,101<br />
Atex Norway n/a 2,387 2,387<br />
Glada Service AG Switzerland 1,810<br />
Other holdings 1,353 1,695<br />
Total 4,841 6,993<br />
Securities of significant amounts and classified as available-for-sale financial<br />
assets are recorded at their fair values. The fair value of unlisted securities is<br />
established by discounting the estimated future cash flows. The discount rate is<br />
based on the current interest rate plus an addition for the specific risks in each<br />
type of security. At the balance sheet date none of the securities were of a significant<br />
amount.<br />
None of the financial assets showed indication of impairment.<br />
note 20. Deferred tax assets and liabilities<br />
49<br />
Group<br />
Deferred tax assets 31/12/2010 31/12/2009<br />
Intangible assets 24,396 20,906<br />
Property, plant and equipment 4,824 4,848<br />
Trade and other receivables 1,584 1,392<br />
Provisions for pensions 19,431 20,952<br />
Other provisions 12,374 8,967<br />
Derivative financial instruments 16,976 32,766<br />
Trade and other payables 13,071 15,064<br />
Loss carryforward 46,170 45,191<br />
Offset -4,440 -35,680<br />
Total 134,386 114,406<br />
Group<br />
Deferred tax liabilities 31/12/2010 31/12/2009<br />
Intangible assets 185,748 230,888<br />
Property, plant and equipment 836 174<br />
Available-for-sale financial assets 27<br />
Trade and other receivables 2,537 553<br />
Provisions for pensions 1,082 920<br />
Other provisions 611<br />
Trade and other payables 977<br />
Tax allocation reserves 59,831 60,923<br />
Offset -4,440 -35,680<br />
Total 245,621 259,366<br />
Net deferred tax assets/liabilities -111,235 -144,960<br />
Gross movement in deferred tax assets/liabilities:<br />
Group<br />
2010 2009<br />
Beginning of year -144,960 -171,304<br />
Acquisition/sale of subsidiaries 6,451 18,092<br />
Recognised in the income statement 32,461 2,738<br />
Recognised in equity -5,187 5,514<br />
End of year -111,235 -144,960<br />
Deferred tax recognised directly in equity<br />
Deferred tax on interest rate swaps -14,816 -976<br />
Exchange differences 9,629 6,490<br />
Total -5,187 5,514<br />
Unrecognised deferred tax assets<br />
Unrecognised deferred tax assets refer to losses carried forward. The gross value<br />
of the Group’s unrecognised deferred tax assets, allocated according to maturity<br />
dates, are shown below. The tax value of unrecognised deferred tax assets<br />
amounts to SEK 71,041 thousand (101,302).<br />
Maturity date<br />
2012 250<br />
2013 618<br />
2014 809<br />
2016 3,386<br />
2017 2,070<br />
2018 29<br />
2019 22<br />
No maturity date 225,816<br />
Total 233,000
50<br />
note 21. participations in group companies<br />
Parent Company’s investments<br />
in group companies<br />
Parent Company<br />
2010 2009<br />
Beginning of year 1,373,967 1,365,847<br />
Investments 8,120<br />
End of year 1,373,967 1,373,967<br />
Net book value 1,373,967 1,373,967<br />
Disclosure of participations in group companies – direct holdings<br />
Company name<br />
Corporate<br />
identity no.<br />
Registered<br />
office<br />
Number<br />
of shares<br />
Share of<br />
capital (%)<br />
Carrying<br />
amount<br />
<strong>Bisnode</strong> AB 556341-5685 Stockholm 1,000 100 1,373,847<br />
<strong>Bisnode</strong> Produktinformation AB 556300-4331 Stockholm 1,000 100 120<br />
Total 1,373,967<br />
Disclosure of participations in group companies – indirect holdings<br />
Company name<br />
Registered<br />
office/<br />
Country<br />
Corporate<br />
identity<br />
number<br />
Share of<br />
capital<br />
(%)<br />
Swedish subsidiaries<br />
AAA Soliditet AB Stockholm 556485-5582 100<br />
Agent 25 Sverige AB Stockholm 556334-7979 100<br />
Baby DM Scandinavia AB Helsingborg 556576-2530 100<br />
BFI Produktion AB Stockholm 556735-5390 100<br />
<strong>Bisnode</strong> Central Invest AB Stockholm 556148-2398 100<br />
<strong>Bisnode</strong> Informatics Sweden AB Stockholm 556525-4439 100<br />
<strong>Bisnode</strong> Sverige AB Stockholm 556338-6928 100<br />
<strong>Bisnode</strong> Venture & Development AB Stockholm 556069-8788 100<br />
<strong>Bisnode</strong>com AB Stockholm 556575-7522 100<br />
<strong>Bisnode</strong> InfoData AB Stockholm 556075-1447 100<br />
<strong>Bisnode</strong> InfoData Holding AB Stockholm 556643-2067 100<br />
Business Check i Sverige AB Stockholm 556235-0396 51<br />
DB Soliditet AB Sundbyberg 556266-9498 100<br />
DirektMedia Sverige AB Göteborg 556447-9839 100<br />
Dun & Bradstreet Nordic AB Sundbyberg 556039-4784 100<br />
Dun & Bradstreet Sverige AB Sundbyberg 556022-4692 100<br />
EKO Företagsupplysningar AB Stockholm 556522-3251 100<br />
Electronic Data Innovation Group EDIG AB Stockholm 556649-1311 100<br />
Fixahemmet i Sverige AB Stockholm 556204-6184 100<br />
G2. solutions AB Stockholm 556537-6489 100<br />
Company name<br />
Registered<br />
office/<br />
Country<br />
Corporate<br />
identity<br />
number<br />
Share of<br />
capital<br />
(%)<br />
G2 Solutions Holding AB Stockholm 556477-1151 100<br />
Infodata AB Stockholm 556197-9740 100<br />
Infodata Applicate AB Stockholm 556436-3421 100<br />
Infodata Direct AB Stockholm 556411-3834 100<br />
InfoTorg AB Stockholm 556266-0141 100<br />
Ipnode AB Stockholm 556129-6046 100<br />
Kompass Sverige AB Stockholm 556084-8409 100<br />
KreditFakta kreditupplysningar i Norden AB Stockholm 556562-2510 100<br />
Lundalogik AB Lund 556397-0465 100<br />
Marknadsinformation Analys MIA AB Stockholm 556361-0665 100<br />
Min Upplysning Sverige AB Sundbyberg 556471-4045 100<br />
Newsline Group AB Stockholm 556225-8136 100<br />
PAR AB Stockholm 556112-5625 100<br />
Pointer International AB Stockholm 556717-0088 100<br />
Pointer Sweden AB Stockholm 556591-6912 100<br />
Presstext AB Stockholm 556088-5393 100<br />
Relevant Information Sverige AB Sundbyberg 556457-3045 100<br />
Svenska Market Management Partner AB Stockholm 556583-1400 100<br />
Svenska Nyhetsbrev AB Stockholm 556363-7825 100<br />
AB Svensk Handelstidning Justitia Sundbyberg 556091-2361 100
Disclosure of participations in group companies – indirect holdings<br />
Company name<br />
Registered<br />
office/<br />
Country<br />
Share of<br />
capital<br />
(%)<br />
Foreign subsidiaries<br />
<strong>Bisnode</strong> Austria GmbH Austria 100<br />
<strong>Bisnode</strong> Informatics Austria GmbH Austria 100<br />
Dun & Bradstreet Information Services GmbH Austria 100<br />
Hoppenstedt Kreditinformationen GmbH Austria 100<br />
Wer liefert was? GmbH Austria 100<br />
Wirtschaftsauskunftei Wisur GmbH Austria 100<br />
BBMS N.V./SA Belgium 100<br />
<strong>Bisnode</strong> Belgium N.V./SA Belgium 100<br />
WDM Belgium N.V./SA Belgium 100<br />
WDM Belgium Holding N.V./SA Belgium 100<br />
<strong>Bisnode</strong> Interact NV/SA Belgium 100<br />
Wer liefert was? d.o.o. Croatia 100<br />
<strong>Bisnode</strong> Ceská republika, s.r.o. Czech Republic 100<br />
CEE Data, a.s. Czech Republic 100<br />
Ceska kapitálová a informacni agentura, a.s Czech Republic 100<br />
Dun & Bradstreet, spol. s.r.o. Czech Republic 100<br />
HBI Ceská republika, s.r.o. Czech Republic 100<br />
Wer liefert was? spol. s.r.o Czech Republic 100<br />
AAA Soliditet A/S Denmark 100<br />
<strong>Bisnode</strong> Business & Market Information A/S Denmark 100<br />
<strong>Bisnode</strong> Danmark A/S Denmark 100<br />
<strong>Bisnode</strong> Informatics Danmark A/S Denmark 100<br />
Bonnier Media A/S under tvangsopløsning Denmark 100<br />
DirektMedia Danmark A/S Denmark 100<br />
Dun & Bradstreet Danmark A/S Denmark 100<br />
Kompass Danmark A/S Denmark 100<br />
Connectus AS Estonia 100<br />
<strong>Bisnode</strong> Finland Oy Finland 100<br />
Direktmedia 121 Oy Finland 100<br />
Dun & Bradstreet Finland Oy Finland 100<br />
Kompass Finland Oy Finland 100<br />
Lundalogik Finland Oy Finland 100<br />
Yritystele Oy Finland 100<br />
<strong>Bisnode</strong> France, S.A.S. France 100<br />
Directinet S.A.S. France 100<br />
Netcollections S.A.S. France 100<br />
WDM France, S.A.S. France 92<br />
WDM France Holding, S.A.S. France 92<br />
ABC der deutschen Wirtschaft GmbH Germany 100<br />
<strong>Bisnode</strong> Editorial Deutschland GmbH Germany 100<br />
<strong>Bisnode</strong> Deutschland GmbH Germany 100<br />
<strong>Bisnode</strong> Deutschland Holding GmbH Germany 100<br />
<strong>Bisnode</strong> Grundbesitz Darmstadt GmbH Germany 100<br />
<strong>Bisnode</strong> Informatics Deutschland GmbH Germany 100<br />
<strong>Bisnode</strong> Produktinformation GmbH Germany 100<br />
D&B Deutschland GmbH Germany 100<br />
Company name<br />
Registered<br />
office/<br />
Country<br />
51<br />
Share of<br />
capital<br />
(%)<br />
Hoppenstedt360 GmbH Germany 100<br />
Hoppenstedt Firmeninformationen GmbH Germany 100<br />
Hoppenstedt Kreditinformationen GmbH Germany 100<br />
Hoppenstedt Publishing GmbH Germany 100<br />
Wer liefert was? GmbH Germany 100<br />
Dun & Bradstreet Hungária Információ Szolgáltató Kft Hungary 100<br />
HBI Company Data Informatikai Kft Hungary 100<br />
Kompass Hungária Kft Hungary 100<br />
Chartered Company Formations Ltd. Ireland 100<br />
Hoppenstedt Bonnier Information N.V. Netherlands 100<br />
WDM International B.V. Netherlands 100<br />
WDM Nederland B.V. Netherlands 100<br />
<strong>Bisnode</strong> Norge AS Norway 100<br />
Direktmedia AS Norway 100<br />
DM Huset AS Norway 100<br />
Dun & Bradstreet Norway AS Norway 100<br />
Inter Dialog AS Norway 100<br />
Kompass Norge AS Norway 100<br />
Lundalogik AS Norway 100<br />
One Software Holding AS Norway 100<br />
Soliditet Norge AS Norway 100<br />
<strong>Bisnode</strong> Polska Sp.z.o.o. Poland 100<br />
Dun & Bradstreet Poland Sp.z.o.o. Poland 100<br />
Hoppenstedt Bonnier Information Polska Sp.z.o.o Poland 100<br />
<strong>Bisnode</strong> Slovensko, s.r.o. Slovakia 100<br />
<strong>Bisnode</strong> d.o.o. Slovenia 100<br />
Infobon d.o.o. Slovenia 100<br />
Razpisi d.o.o. Slovenia 62<br />
<strong>Bisnode</strong> Schweiz AG Switzerland 100<br />
Credita AG Switzerland 100<br />
Dun & Bradstreet (Schweiz) AG Switzerland 100<br />
Hoppenstedt AG Switzerland 100<br />
Inkaprax AG Switzerland 100<br />
Wer liefert was GmbH Switzerland 100<br />
ACS Credit Services Ltd. United Kingdom 100<br />
<strong>Bisnode</strong> Ltd. United Kingdom 100<br />
<strong>Bisnode</strong> Informatics Ltd. United Kingdom 100<br />
<strong>Bisnode</strong> Publications Ltd United Kingdom 100<br />
<strong>Bisnode</strong> UK Holdings Ltd. United Kingdom 100<br />
Checkit (UK) Ltd. United Kingdom 100<br />
Creditscorer Ltd. United Kingdom 100<br />
HBI Information Ltd. United Kingdom 100<br />
Market Monitor Ltd. United Kingdom 100<br />
Nationwide Credit Management Services Ltd. United Kingdom 100<br />
The Prospect Shop Ltd. United Kingdom 100<br />
Prospect Swetenhams Ltd. United Kingdom 100
52<br />
note 22. Trade and other receivables<br />
Group<br />
31/12/2010 31/12/2009<br />
Trade receivables – net 731,230 749,303<br />
Advance payments to suppliers 975 725<br />
Prepaid expenses 74,872 77,893<br />
Accrued interest income 500 52<br />
Other accrued income 18,305 28,050<br />
Receivables from Parent Company – non interest-bearing 37<br />
Other receivables – interest-bearing 19,112 31,245<br />
Other receivables – non interest-bearing 30,843 44,971<br />
Total 875,837 932,276<br />
whereof non-current portion 14,787 20,910<br />
whereof current portion 861,050 911,366<br />
Credit risk<br />
There is no concentration of credit risks for trade receivables, as the Group has a<br />
large number of customers who are well dispersed internationally. Receivables<br />
are tested for impairment at the company level after individual assessment of<br />
each customer. In the impairment test, the financial position and solvency of each<br />
customer is considered.<br />
The Group has recognised losses on trade receivables for the year amounting<br />
to SEK 8,302 thousand (19,830). The losses are recognised in other expenses in<br />
the income statement. The table below shows the age structure of outstanding<br />
trade receivables:<br />
31/12/2010 Not due<br />
Between<br />
Within 61 days-<br />
60 days 1 year<br />
Later<br />
than<br />
1 year Total<br />
Trade receivables 589,575 124,331 23,419 18,844 756,169<br />
Provision for impairment<br />
of receivables -1,003 -2,282 -6,362 -15,292 -24,939<br />
Trade receivables – net 588,572 122,049 17,057 3,552 731,230<br />
31/12/2009 Not due<br />
Between<br />
Within 61 days-<br />
60 days 1 year<br />
Later<br />
than<br />
1 year Total<br />
Trade receivables 579,091 145,338 31,946 22,247 778,622<br />
Provision for impairment<br />
of receivables -2,151 -2,202 -8,069 -16,897 -29,319<br />
Trade receivables – net 576,940 143,136 23,877 5,350 749,303<br />
The other categories within trade and other receivables do not contain impaired<br />
assets.<br />
The credit quality of trade and other receivables that are neither past due nor<br />
impaired is good since the receivables relate to customers with high credit ratings<br />
and/or good solvency.<br />
The carrying amounts of trade and other receivables are equal to their fair values.<br />
The maximum exposure to credit risk at the reporting date is the fair value of each<br />
class of Trade and other receivables. The Group does not hold any collateral as<br />
security for trade receivables past due.<br />
note 23. inventories<br />
Group<br />
31/12/2010 31/12/2009<br />
Raw materials 211<br />
Work in progress 4,843 10,158<br />
Finished goods 802 1,338<br />
Total 5,856 11,496<br />
note 24. cash and cash equivalents<br />
Group<br />
31/12/2010 31/12/2009<br />
Cash at bank and on hand 259,167 367,844<br />
Total 259,167 367,844<br />
note 25. Borrowings<br />
Group<br />
Non-current borrowings 31/12/2010 31/12/2009<br />
Bank borrowings 1,891,051 2,287,314<br />
Loans from shareholders 1,228,608 1,137,600<br />
Borrowings for finance leases 74,574 88,806<br />
Other borrowings 9,382 15,243<br />
Subtotal 3,203,615 3,528,963<br />
Current borrowings<br />
Bank borrowings 336,006 323,120<br />
Borrowings for finance leases 3,699 3,461<br />
Other borrowings 7,570 5,770<br />
Subtotal 347,275 332,351<br />
Total 3,550,890 3,861,314<br />
Bank borrowings mature until 31 January 2013 and carry interest equal to current<br />
3-month STIBOR plus 1.25%. 85% of the variable interest is converted to fixed<br />
interest until the maturity date through the use of interest rate swaps. Bank borrowings<br />
are secured by shares in subsidiaries of the Parent Company.<br />
The Group has granted bank overdraft amounting to SEK 100 million (100). In<br />
addition, the Group has a revolving credit facility of SEK 300 million. At the end of<br />
the year, SEK 25 million of the revolving credit had been utilised.<br />
Interest rate risks<br />
The exposure of the Group’s borrowings to changes in interest rates and contractual<br />
dates for interest rate con<strong>version</strong> is as follows:<br />
Date for interest rate con<strong>version</strong><br />
or maturity date<br />
31/12/2010<br />
Carrying<br />
amount<br />
Within<br />
1 year<br />
Between<br />
1–5 years<br />
Later than<br />
5 years<br />
Bank borrowings 2,227,057 336,006 1,891,051<br />
Loans from shareholders 1,228,608 1,228,608<br />
Borrowings for finance leases 78,273 3,699 15,307 59,267<br />
Other borrowings 16,952 7,570 9,382<br />
Date for interest rate con<strong>version</strong><br />
or maturity date<br />
Carrying Within Between Later than<br />
31/12/2009<br />
amount 1 year 1–5 years 5 years<br />
Bank borrowings 2,610,434 323,120 2,287,314<br />
Loans from shareholders 1,137,600 1,137,600<br />
Borrowings for finance leases 92,267 3,461 15,936 72,870<br />
Other borrowings 21,013 5,770 15,243<br />
The fair values of the Group’s borrowings are equal to their carrying amounts. The<br />
carrying amounts of the borrowings are denominated in the following currencies:<br />
31/12/2010 31/12/2009<br />
SEK 2,888,495 3,002,430<br />
EUR 647,198 837,683<br />
USD 15,152 21,013<br />
Other currencies 45 188<br />
Total 3,550,890 3,861,314
Maturity dates on non-current liabilities – Parent Company<br />
Maturity date<br />
Current Within Between Later than<br />
31/12/2010<br />
liability 1 year 1–5 years 5 years<br />
Liabilities to group companies 860,026 860,026<br />
Other liabilities 368,582 368,582<br />
Total 1,228,608 0 1,228,608 0<br />
31/12/2009<br />
Current<br />
liability<br />
Within<br />
1 year<br />
Maturity date<br />
Between Later than<br />
1–5 years 5 years<br />
Liabilities to group companies 796,320 796,320<br />
Other liabilities 341,280 341,280<br />
Total 1,137,600 0 1,137,600 0<br />
note 26. provisions for pensions<br />
Defined contribution plans<br />
The expense for defined contribution plans during the year amounted to SEK<br />
92,665 thousand (93,730).<br />
Commitments for old-age pensions and family pensions for white-collar<br />
employees in Sweden have been safeguarded through insurance in Alecta.<br />
According to statement URA 42 from the Swedish Financial Accounting Standards<br />
Council’s Urgent Issues Task Force, this is classified as a “multi-employer”<br />
defined benefit plan. For financial years when the company has not had access to<br />
the information necessary to report this plan as a defined benefit plan, a pension<br />
plan according to Supplementary Pension for Employees in industry and Commerce,<br />
safeguarded through insurance with Alecta, is reported as a defined contribution<br />
plan. The year’s costs for pension insurance subscribed to through Alecta<br />
amounted to SEK 28,000 thousand (28,079). Alecta’s surplus can be distributed<br />
to the policyholders (the employers) and/or the insureds. At year-end 2010,<br />
Alecta’s collective funding ratio was 146% (141). The collective funding ratio is the<br />
market value of Alecta’s plan assets as a percentage of insurance obligations<br />
computed according to Alecta’s own actuarial assumptions, which do not comply<br />
with IAS 19.<br />
Defined benefit plans<br />
The amounts recognised in the income statement are as follows:<br />
Group<br />
2010 2009<br />
Current service cost 20,348 15,913<br />
Interest cost 13,822 12,721<br />
Expected return on plan assets -4,342 -4,586<br />
Actuarial gains (-) and losses (+) recognised in year 920 343<br />
Other cost reductions -1,283<br />
Total 30,748 23,108<br />
The actual return on plan assets during the period was SEK 7,449 thousand (34).<br />
Actuarial assumptions<br />
There are defined benefit plans in Finland, Germany, Norway, Sweden and Switzerland.<br />
The principal actuarial assumptions used as of balance sheet date were<br />
as follows (weighted average):<br />
2010 2009<br />
Discount rate 3.9% 4.4%<br />
Inflation 1.7% 1.7%<br />
Annual salary increases 2.4% 2.4%<br />
Annual pension increases 1.5% 1.3%<br />
Annual paid-up policy increases 1.1% 1.3%<br />
Remaining service period 13 years 14 years<br />
Expected return on plan assets 3.2% 3.9%<br />
53<br />
The amounts recognised in the balance sheet are determined as follows:<br />
2010 2009<br />
Present value of funded obligations 146,364 139,768<br />
Fair value of plan assets -110,397 -115,488<br />
Net value of entirely or partially funded obligations 35,967 24,280<br />
Present value of unfunded obligations 199,036 198,048<br />
Unrecognised actuarial gains (+) and losses (–) -25,435 -4,617<br />
Net liability on the balance sheet 209,568 217,711<br />
The movement in the fair value of plan assets over the year is as follows:<br />
2010 2009<br />
Beginning of year 337,816 323,172<br />
Current service cost 20,348 15,913<br />
Interest cost 13,704 13,706<br />
Actuarial gains (-)/losses (+) 8,518 -2,785<br />
Employer contributions -1,088 -7,071<br />
Employee contributions 2,733 3,032<br />
Benefits paid -17,511 -4,984<br />
Acquisition of subsidiaries -48 3,432<br />
Other changes 1,243<br />
Exchange differences -19,072 -7,842<br />
End of the year 345,400 337,816<br />
The movement in the fair value of plan assets over the year is as follows:<br />
2010 2009<br />
Beginning of year 115,488 106,273<br />
Expected return on plan assets 4,342 4,586<br />
Actuarial losses (-)/gains (+) -11,791 -4,552<br />
Employer contributions 11,371 10,694<br />
Employee contributions 2,733 3,032<br />
Benefits paid -11,741 -4,984<br />
Acquisition of subsidiaries 373<br />
Other changes 93<br />
Exchange differences -5 -27<br />
End of year 110,397 115,488<br />
Plan assets are comprised as follows:<br />
2010 2009 2010 2009<br />
Shares 23,232 19,193 21% 17%<br />
Interest-bearing securities 37,931 42,233 34% 37%<br />
Property 14,275 11,386 13% 10%<br />
Other 34,959 42,676 32% 37%<br />
Total 110,397 115,488 100% 100%<br />
The expected return on plan assets was determined by considering the expected<br />
returns available on the assets underlying the current investment policy. Expected<br />
yields on fixed-interest investments are based on gross redemption yields at the<br />
balance sheet date. Expected returns on shares and property investments reflect<br />
long-term rates of return in the respective market.<br />
Expected contributions to post-employment benefit plans for the financial year<br />
2011 amount to SEK 18,591 thousand.<br />
2010 2009 2008 2007<br />
Present value of defined<br />
benefit obligation 345,400 337,816 323,172 247,091<br />
Fair value of plan assets -110,397 -115,488 -106,273 -79,859<br />
Deficit (+)/surplus (-) 235,003 222,328 216,899 167,232
54<br />
note 27. other provisions<br />
Group<br />
2010 2009<br />
Contingent purchase consideration 35,330 142,118<br />
Legal claims 23,808 4,058<br />
Restoration charges 5,155 6,076<br />
Restructuring 6,222 2,963<br />
Sales agents 11,469 14,442<br />
Other 12,073 20,125<br />
Total 94,057 189,782<br />
of which non-current portion 54,164 188,544<br />
of which current portion 39,893 1,238<br />
Group<br />
2010 2009<br />
Beginning of year 189,782 191,243<br />
Acquisition of subsidiaries 2,588 8,119<br />
New provisions for the period 27,583 648<br />
Utilised during the period -14,548 -14,403<br />
Provisions for contingent purchase consideration 2,253 8,925<br />
Contingent purchase consideration paid -108,301 -9,220<br />
Unused/reversed contingent purchase<br />
consideration<br />
Capitalised interest on contingent<br />
-4,348<br />
purchase consideration 3,607 6,344<br />
Exchange differences -4,559 -1,874<br />
End of year 94,057 189,782<br />
Contingent purchase consideration<br />
The provision mainly pertains to contingent purchase consideration for the acquisition<br />
of Svenska Nyhetsbrev AB. The amount will be used during 2011.<br />
Legal claims<br />
Provisions for legal claims pertain to potential claims from information suppliers<br />
and ongoing tax disputes.<br />
Restoration charges<br />
Pertains to provisions for future restoration expenses for rented premises.<br />
Restructuring<br />
Pertains to provisions for vacant premises and future payments to redundant<br />
personnel.<br />
Sales agents<br />
The provisons pertain to future costs related to the retirement or termination of<br />
collaboration with German sales agents.<br />
note 28. Trade and other payables<br />
Group<br />
31/12/2010 31/12/2009<br />
Trade payables 195,853 212,821<br />
Advances from customers 40,874 62,090<br />
Holiday pay liabilities 104,206 115,426<br />
Social security and other taxes 40,194 33,319<br />
Accrued interest expenses 189 284<br />
Other accrued expenses 279,198 327,364<br />
Deferred income 658,644 664,971<br />
Other liabilities - non interest-bearing 132,335 151,789<br />
Total 1,451,493 1,568,064<br />
of which non-current portion 2,234<br />
of which current portion 1,451,493 1,565,830<br />
The fair value of trade and other payables equals their carrying amounts.<br />
note 29. Derivative financial instruments<br />
Group<br />
31/12/2010 31/12/2009<br />
Interest rate swaps – cash flow hedges -74,481 -135,581<br />
Total -74,481 -135,581<br />
Type of contract<br />
Contract term<br />
beginning on ending on<br />
Amount Currency<br />
Interest<br />
rate<br />
Interest rate swap 31/01/2008 31/01/2013 1,398,250 SEK K 4.51%<br />
Interest rate swap 31/01/2008 31/01/2013 53,550 EUR K 4.42%<br />
The cash flow hedges are determined to be 85% effective. The current Interest<br />
rate swap agreements had a negative value of SEK 23,851 thousand on the contractual<br />
date. The ineffective portion has been recognised in the income statement<br />
on a straight-line basis. During the year, SEK 4,770 thousand has been recognised<br />
as financial income in the income statement.<br />
The fair value of the interest rate swaps which have been calculated using valuation<br />
techniques are found in level 2.
note 30. accrued expenses and deferred income<br />
Parent Company<br />
31/12/2010 31/12/2009<br />
Accrued expenses related to personnel 7,222<br />
Other accrued expenses 250 295<br />
Total 7,472 295<br />
note 31. reserves<br />
Hedging<br />
reserve<br />
Availablefor-sale<br />
financial<br />
assets<br />
Currency<br />
translation<br />
differences Total<br />
Balance at 1 January 2009 -91,819 5,092 272,696 185,969<br />
Revaluation – gross -5,092 -5,092<br />
Cash flow hedges:<br />
Transferred to the income statement -4,770 -4,770<br />
Tax on transfers to the inc. statement<br />
Transferred to other<br />
1,255 1,255<br />
comprehensive income<br />
Tax on transfers to other<br />
8,482 8,482<br />
comprehensive income -2,231 -2,231<br />
Currency translation differences -129,610 -129,610<br />
Balance at 31 December 2009 -89,083 0 143,086 54,003<br />
Balance at 1 January 2010 -89,083 0 143,086 54,003<br />
Revaluation – gross<br />
Cash flow hedges:<br />
Transferred to the income statement -4,770 -4,770<br />
Tax on transfers to the inc. statement<br />
Transferred to other<br />
1,255 1,255<br />
comprehensive income<br />
Tax on transfers to other<br />
61,100 61,100<br />
comprehensive income -16,069 -16,069<br />
Currency translation differences -313,702 -313,702<br />
Deferred tax reported directly in equity 12,934 12,934<br />
Balance at 31 December 2010 -47,567 0 -157,682 -205,249<br />
note 32. finance leases<br />
55<br />
Finance leases – group company is lessor<br />
The Group leases tangible assets under finance leases with carrying amounts of<br />
SEK 54,724 thousand (65,567) at the balance sheet date.<br />
The future minimum lease payments receivable under non-cancellable operating<br />
leases are as follows:<br />
Group<br />
2010 2009<br />
Within 1 year 6,307 6,952<br />
Between 1–5 years 25,866 28,304<br />
Later than 5 years 65,606 80,446<br />
Total 97,779 115,702<br />
The present value of finance lease liabilities is as follows:<br />
Group<br />
2010 2009<br />
Within 1 year 3,699 3,461<br />
Between 1–5 years 15,307 15,936<br />
Later than 5 years 59,267 72,870<br />
Total 78,273 92,267<br />
note 33. operating leases<br />
Group<br />
Operating leases – Group company is lessor 2010 2009<br />
Leasing expenses 158,462 167,486<br />
Total 158,462 167,486<br />
The Group’s operating leases consist primarily of rents for premises, machinery/<br />
computers and cars. The Parent Company had no lease expenses during the year.<br />
Group<br />
Future minimum lease payments 2010 2009<br />
Within 1 year 139,268 142,705<br />
Between 1–5 years 264,314 285,377<br />
Later than 5 years 83,431 113,562<br />
Total 487,013 541,644<br />
Future lease payments pertain to minimum lease payments attributable to noncancellable<br />
operating leases.
56<br />
note 34. related party transactions<br />
The related parties of the Group consist of the Parent Company Ratos AB and the<br />
Group’s key management personnel and their families. Key management personnel<br />
relates to members of the executive management team.<br />
Ratos owns 70% of the Parent Company’s shares and has control over the<br />
Group. Ratos is the Parent Company of the largest and smallest groups that <strong>Bisnode</strong><br />
Business Information Group AB is part of and where the consolidated accounts<br />
are prepared.<br />
Any transactions between related parties are carried out on an arm’s length basis.<br />
Transactions with the Parent Company<br />
Loans to Ratos<br />
Group<br />
2010 2009<br />
Beginning of year 0 2,792<br />
Borrowings 11,788<br />
Repayments -11,788 -2,792<br />
End of year 0 0<br />
Group<br />
Borrowings from Ratos 2010 2009<br />
Beginning of year 796,320 742,598<br />
Repayments -5,265<br />
Interest expense capitalised 63,706 58,987<br />
End of year 860,026 796,320<br />
The year-end borrowings from Ratos pertain to shareholder loans from the<br />
Parent Company Ratos. The loans mature on 31 January 2013 and carry interest<br />
of 8%. The interest is capitalised until maturity.<br />
Transactions with key management personnel<br />
During 2010 and 2009 the Parent Company did not grant any loans to Board<br />
members, key management personnel or their families. Renumeration to key<br />
management personnel is specified in Note 10.<br />
note 35. contingent liabilities and pledged assets<br />
Group Parent Company<br />
Contingent liabilities 31/12/2010 31/12/2009 31/12/2010 31/12/2009<br />
Guarantee commitment FPG/PRI 917 768<br />
Guarantee to previous owners 61,665 86,902<br />
Other guarantees 16,690 19,277 2,237,126 2,625,416<br />
Total 79,272 106,947 2,237,126 2,625,416<br />
Pledged assets for own liabilities and provisions<br />
Shares 1,107,539 1,298,012 1,107,539 1,298,012<br />
Other pledged assets 916 2,120<br />
Total 1,108,455 1,300,132 1,107,539 1,298,012<br />
Other pledged assets None None None None<br />
Guarantee to previous owners pertains to guarantees pledged to Dun & Bradstreet<br />
International to complete financing required for the Dun & Bradstreet Group<br />
companies in Sweden, Norway, Denmark, Finland, Germany, Switzerland,<br />
the Czech Republic, Austria, Hungary and Poland.<br />
note 36. share capital<br />
The share capital of the Parent Company amounts to SEK 482,355,912, divided<br />
between 66,328,528 A shares and 54,260,450 B shares with a quota value of 4<br />
each.<br />
There are no outstanding options or convertible bonds that could lead to future<br />
dilution.<br />
note 37. earnings per share<br />
Basic earnings per share are calculated by dividing profit attributable to owners of<br />
the Parent Company by the number of shares outstanding for the period. There<br />
are no option or convertible bond programmes outstanding that could cause<br />
future dilution.<br />
2010 2009<br />
Profit attributable to owners of the Parent Company 180,567 50,551<br />
Number of shares outstanding (thousands) 120,589 120,589<br />
Earnings per share before and after dilution (SEK per share) 1.50 0.42
note 38. Business combinations<br />
2010<br />
Date of<br />
acquisition<br />
share of<br />
capital Operation<br />
Directinet SA/Netcollections SAS 06/01/2010 100.0% Leading provider of online direct marketing solutions in France.<br />
Bilfakta Sverige AB 01/04/2010 100.0% Owner of Sweden's largest database of automotive information.<br />
Yritystelse Oy (asset deal) 08/10/2010 100.0% B2B online business information and search operation in Finland.<br />
Purchase price Directinet/<br />
Netcollections<br />
57<br />
Other<br />
acquisitions Total<br />
Cash paid 85,070 9,907 94,977<br />
Contingent purchase consideration paid 108,301 108,301<br />
Utilisation of contingent purchase consideration -111,053 -111,053<br />
Total 85,070 7,155 92,225<br />
Fair value of acquired net assets -6,959 13,201 6,242<br />
Total Goodwill 78,111 20,356 98,467<br />
Cash flow effect Directinet/<br />
Netcollections<br />
Other<br />
acquisitions Total<br />
Cash paid 85,070 9,907 94,977<br />
Contingent purchase consideration paid 108,301 108,301<br />
Cash and cash equivalents in acquired subsidiaries -11,502 1,983 -9,519<br />
Change in cash and cash equivalents 73,568 120,191 193,759<br />
Supplementary information<br />
Revenue since acquisition date 121,156 7,911 129,067<br />
Revenue in 2010 121,156 8,537 129,693<br />
Profit before tax since acquisition date -4,269 -575 -4,844<br />
Profit before tax in 2010 -4,269 -1,859 -6,128<br />
Acquisition-related costs 740 740<br />
Fair value of acquired assets<br />
and liabilities<br />
Directinet/Netcollections Other acquisitions Total<br />
Carrying<br />
amount<br />
Fair<br />
value<br />
Carrying<br />
amount<br />
Fair<br />
value<br />
Carrying<br />
amount<br />
Assets<br />
Intangible assets 2,115 2,115 2,420 2,420 4,535 4,535<br />
Property, plant and equipment 2,082 2,082 573 573 2,655 2,655<br />
Deferred tax assets 984 984 984 984<br />
Inventories 35 35 35 35<br />
Trade and other receivables 52,125 52,125 614 614 52,739 52,739<br />
Cash and cash equivalents 11,502 11,502 -1,983 -1,983 9,519 9,519<br />
Total assets 68,808 68,808 1,659 1,659 70,467 70,467<br />
Liabilities<br />
Other provisions 2,588 2,588 2,588 2,588<br />
Tax liabilities 13 13 13 13<br />
Trade and other payables 59,261 59,261 14,847 14,847 74,108 74,108<br />
Total liabilities 61,849 61,849 14,860 14,860 76,709 76,709<br />
Net identifiable assets and liabilities 6,959 6,959 -13,201 -13,201 -6,242 -6,242<br />
The goodwill is attributable to the profitability of the acquired companies and the significant<br />
synergies expected to arise following acquisition. All acquisition balances are preliminary.<br />
Fair<br />
value
58<br />
2009<br />
Date of<br />
acquisition<br />
share of<br />
capital Operation<br />
Inter Dialog AS 15/05/2009 20.0% Acquisition of minority.<br />
Kauppalehti 121 Oy (name change to 121 Media Oy) 02/11/2009 100.0% Finnish leader in direct marketing services.<br />
One Holding AS 07/12/2009 9.9% Acquisition of minority.<br />
TA Teleadress Information AB (name change to Relevant<br />
information Sverige AB) 14/12/2009 80.1% Has a leading position on the Swedish market for direct marketing information.<br />
RAAD Research (asset deal) 29/10/2009 100.0% German operator in market research and analysis for the IT sector.<br />
Purchase price Relevant<br />
Information 121 Media Other acquisitions Total<br />
Cash paid 58,670 72,175 6,566 137,411<br />
Direct costs relating to acquisitions 46 2,307 111 2,464<br />
Contingent purchase consideration paid 9,220 9,220<br />
Utilisation of contingent purchase consideration -9,195 -9,195<br />
Total 58,716 74,482 6,702 139,900<br />
Fair value of acquired net assets -6,356 -6,667 -1,053 -14,076<br />
Goodwill due to step acquisition 13,840 13,840<br />
Revaluation of contingent purchase consideration 8,900 8,900<br />
Negative goodwill – transferred to the income statement 1,533 1,533<br />
Total Goodwill 66,200 67,815 16,082 150,097<br />
Cash flow effect Relevant<br />
Information 121 Media Other acquisitions Total<br />
Cash paid 58,670 72,175 6,566 137,411<br />
Direct costs relating to acquisitions 46 2,307 111 2,464<br />
Contingent purchase consideration paid 9,220 9,220<br />
Cash and cash equivalents in acquired subsidiaries -17,624 -8,036 -25,660<br />
Change in cash and cash equivalents 41,092 66,446 15,897 123,435<br />
Supplementary information<br />
Revenue since acquisition date 58,836 16,777 75,613<br />
Revenue in 2009 58,836 85,775 144,611<br />
Profit before tax since acquisition date 6,097 492 6,589<br />
Profit before tax in 2009 6,097 5,730 11,827<br />
Fair value of acquired<br />
assets and liabilities<br />
Relevant Information 121 Media Other acquisitions Total<br />
Carrying<br />
amount<br />
Fair<br />
value<br />
Carrying<br />
amount Fair value<br />
Carrying<br />
amount<br />
Fair<br />
value<br />
Carrying<br />
amount<br />
Assets<br />
Intangible assets 531 531 531 531<br />
Property, plant and equipment 240 240 819 819 294 294 1,353 1,353<br />
Deferred tax assets 221 221 104 104 325 325<br />
Trade and other receivables 9,765 9,765 12,100 12,100 1 1 21,866 21,866<br />
Cash and cash equivalents 17,624 17,624 8,036 8,036 25,660 25,660<br />
Total assets 27,850 27,850 21,059 21,059 826 826 49,735 49,735<br />
Liabilities<br />
Non-controlling interests 671 671 -227 -227 444 444<br />
Provisions for pensions 2,862 2,862 197 197 3,059 3,059<br />
Borrowings 311 311 311 311<br />
Deferred tax liabilities 346 346 346 346<br />
Tax liabilities 5 5 5 5<br />
Trade and other payables 17,610 17,610 13,884 13,884 31,494 31,494<br />
Total liabilities 21,494 21,494 14,392 14,392 -227 -227 35,659 35,659<br />
Net identifiable assets and liabilities 6,356 6,356 6,667 6,667 1,053 1,053 14,076 14,076<br />
Fair<br />
value
note 39. sale of subsidiaries<br />
Date of sale<br />
Subsidiaries divested 2010 2009<br />
Office Team Holding AS 19/04/2010<br />
<strong>Bisnode</strong> Holding B.V. 25/05/2010<br />
Svenskt Byggregister AB 01/06/2010<br />
Emric AB 09/06/2010<br />
PAR Graphics (sale of assets) 01/05/2010<br />
Nomi Sweden, Norway, Finland, Denmark 30/06/2009<br />
ICC Ireland, United Kingdom, etc 28/08/2009<br />
Finfo Information AB 08/12/2009<br />
Sverige Bygger AB 30/12/2009<br />
Inter Dialog AS (sale of assets) 26/05/2009<br />
Capital gains/losses 2010 2009<br />
Cash received 34,510 135,912<br />
Net assets sold -46,152 -110,183<br />
Provisions in connection to sale 214<br />
Estimated contingent purchase consideration to recieve 3,504<br />
Contingent purchase consideration received 779 4,625<br />
Provision/Reversal of contingent purchase consideration -1,838 -4,625<br />
Exchange differences -123<br />
Capital gains/losses -9,320 25,943<br />
Net assets divested 2010 2009<br />
Assets<br />
Intangible assets 66,686 98,406<br />
Property, plant and equipment 5,250 2,557<br />
Available-for-sale financial assets 5 267<br />
Deferred tax assets 2 1,062<br />
Inventories 458<br />
Tax receivables 2,050<br />
Trade and other receivables 31,645 36,758<br />
Cash and cash equivalents 20,477 39,399<br />
Total assets 124,523 180,499<br />
Liabilities<br />
Non-controlling interests 28,116<br />
Provision for pensions 48<br />
Deferred tax liabilities 5,467 2,235<br />
Tax liabilities 493 2,688<br />
Trade and other payables 44,247 65,393<br />
Total liabilities 78,371 70,316<br />
Cash flow from sale of subsidiaries 2010 2009<br />
Cash received 34,510 135,912<br />
Contingent purchase consideration received 779 4,625<br />
Provisions 3,881<br />
Cash and cash equivalents in sold subsidiaries -20,477 -39,399<br />
Cash flow from sale of subsidiaries 14,812 105,019<br />
note 40. Discontinued operations<br />
59<br />
Profit from discontinued operations 2010 2009<br />
Revenue<br />
Other operating income<br />
97,104<br />
Total operating income 0 97,104<br />
Goods and services -20,148<br />
Personnel costs -56,183<br />
Depreciation, amortisation and impairment losses -90,817<br />
Other expenses -20,784<br />
Total operating expenses 0 -187,932<br />
Operating profit 0 -90,828<br />
Financial income 30<br />
Financial expenses -304<br />
Net financial items 0 -274<br />
Profit before tax and capital gain 0 -91,102<br />
Capital gain from divestment of operations -20,051<br />
Profit before tax 0 -111,153<br />
Income tax expense 2,916<br />
Profit from discontinued operations 0 -108,237<br />
Cash flow from discontinued operations<br />
Cash flow from operating activities<br />
2010 2009<br />
Profit before tax -111,153<br />
Adjustment for items not included in cash flow, etc. 113,400<br />
Income tax paid 559<br />
Cash flow from changes in working capital -4,521<br />
Cash flow from operating activities 0 -1,715<br />
Cash flow from investing activities<br />
Investments in property, plant and equipment -761<br />
Sale of subsidiaries, net of cash 99,503<br />
Sale of property, plant and equipment 35<br />
Cash flow from investing activities 0 98,777<br />
Cash flow from financing activities<br />
Repayment of borrowings -441<br />
Cash flow from financing activities 0 -441<br />
Cash flow for the year 0 96,621<br />
Capital gains/losses 2010 2009<br />
Cash received minus sales expenses 111,057<br />
Net assets sold -127,107<br />
Provisions in connection with sale -4,001<br />
Capital gains/losses 0 -20,051
60<br />
note 40. Discontinued operations (continued)<br />
Net assets divested 2010 2009<br />
Assets<br />
Intangible assets 102,076<br />
Property, plant and equipment 15,163<br />
Deferred tax assets 359<br />
Inventories 10<br />
Trade and other receivables 49,325<br />
Cash and cash equivalents 11,554<br />
Total assets 0 178,487<br />
Liabilities<br />
Deferred tax liabilities 16,940<br />
Tax liabilities 611<br />
Trade and other payables 33,829<br />
Total liabilities 0 51,380<br />
Cash flow from sale of subsidiaries 2010 2009<br />
Cash received minus sales expenses 111,057<br />
Cash and cash equivalents in sold subsidiaries -11,554<br />
Cash flow from sale of subsidiaries 0 99,503<br />
The annual accounts and the consolidated financial statements were approved for publication by the Board on 15 March 2011.<br />
The income statement and balance sheet will be presented to the Annual General Meeting on 4 April 2011 for adoption.<br />
Stockholm, 15 March 2011<br />
note 41. events after the balance sheet date<br />
In January 2011, <strong>Bisnode</strong> completed the acquisition of Poslovna Domena in Croatia<br />
and acquired 51 per cent of Vendemore AB in Sweden.<br />
Poslovna Domena offers digital business information from Croatia’s most complete<br />
dataset of company and people information. The company has 15 employees and<br />
annual revenue of around SEK 9 million.<br />
Vendemore helps companies to optimise their online marketing. The company<br />
has 10 employees and reported annual revenue of around SEK 9 million in 2010.<br />
In February the credit solutions company Lindorff Decision and 90.1 per cent of<br />
marketing solutions company Lindorff Match located in Norway were acquired.<br />
Combined, the companies have 37 employees and showed annual revenue of<br />
about SEK 115 million in 2010. Total operating profit amounted to around SEK 26<br />
million. The acquisitions are subject to approval from the relevant competition<br />
authorities.<br />
No other significant events have taken place after the balance sheet date.<br />
Håkan Ramsin Henrik Joelsson Birgitta Klasén<br />
Chairman of the Board Board member Board member<br />
Jonas Nyrén Carl Wilhelm Ros Johan Wall<br />
Board member Board member Chief Executive Officer
auDiT<br />
reporT<br />
To the annual meeting of the shareholders of<br />
<strong>Bisnode</strong> Business Information Group AB,<br />
corporate identity number 556681-5725<br />
We have audited the annual accounts, the<br />
consolidated accounts, the accounting<br />
records and the administration of the Board<br />
of Directors and the Chief Executive Officer<br />
of <strong>Bisnode</strong> Business Information Group AB<br />
for the financial year 2010. (The company’s<br />
annual accounts and the consolidated<br />
accounts are included in the printed <strong>version</strong><br />
on pages 26–60). The Board of Directors and<br />
the Chief Executive Officer are responsible<br />
for these accounts and the administration of<br />
the company as well as for the application<br />
of the Annual Accounts Act when preparing<br />
the annual accounts and the application of<br />
international financial reporting standards<br />
IFRSs as adopted by the EU and the<br />
Annual Accounts Act when preparing the<br />
consolidated accounts. Our responsibility<br />
is to express an opinion on the annual<br />
accounts, the consolidated accounts and the<br />
administration based on our audit.<br />
We conducted our audit in accordance<br />
with generally accepted auditing standards in<br />
Sweden. Those standards require that we plan<br />
and perform the audit to obtain reasonable<br />
assurance that the annual accounts and the<br />
Our audit report was submitted on 16 March 2011<br />
Öhrlings PricewaterhouseCoopers AB<br />
Bertil Johanson<br />
Authorised Public Accountant<br />
consolidated accounts are free of material<br />
misstatement. An audit includes examining,<br />
on a test basis, evidence supporting the<br />
amounts and disclosures in the accounts. An<br />
audit also includes assessing the accounting<br />
principles used and their application by the<br />
Board of Directors and the Chief Executive<br />
Officer and significant estimates made by the<br />
Board of Directors and the Chief Executive<br />
Officer when preparing the annual accounts<br />
and consolidated accounts as well as evaluating<br />
the overall presentation of information in the<br />
annual accounts and the consolidated accounts.<br />
As a basis for our opinion concerning discharge<br />
from liability, we examined significant<br />
decisions, actions taken and circumstances of<br />
the company in order to be able to determine<br />
the liability, if any, to the company of any<br />
Board member or the Chief Executive<br />
Officer. We also examined whether any Board<br />
member or the Chief Executive Officer has,<br />
in any other way, acted in contravention of<br />
the Companies Act, the Annual Accounts Act<br />
or the Articles of Association. We believe that<br />
our audit provides a reasonable basis for our<br />
opinion set out below.<br />
61<br />
The annual accounts have been prepared<br />
in accordance with the Annual Accounts Act<br />
and give a true and fair view of the company’s<br />
financial position and results of operations<br />
in accordance with generally accepted<br />
accounting principles in Sweden. The<br />
consolidated accounts have been prepared<br />
in accordance with international financial<br />
reporting standards IFRSs as adopted by the<br />
EU and the Annual Accounts Act and give<br />
a true and fair view of the group’s financial<br />
position and results of operations. The<br />
statutory administration report is consistent<br />
with the other parts of the annual accounts and<br />
the consolidated accounts.<br />
We recommend to the annual meeting of<br />
shareholders that the income statements and<br />
balance sheets of the parent company and<br />
the group be adopted, that the loss of the<br />
Parent Company be dealt with in accordance<br />
with the proposal in the administration<br />
report and that the members of the Board<br />
of Directors and the Chief Executive Officer<br />
be discharged from liability for the financial<br />
year.
62<br />
BoarD of DirecTors<br />
anD auDiTors<br />
håkan RamSin<br />
chairman of the Board<br />
BA in Mathematics, University of Stockholm. Born in 1945. Board<br />
member since 2005 and Chairman since 2006.<br />
main occupation: Industrial adviser.<br />
other board assignments: Chairman of the Board of Wiky Ventures AB,<br />
Medströms AB. Board member of Stofa Holding A/S.<br />
IngrID engström<br />
Board member<br />
MSc in Applied Psychology, University of Uppsala<br />
Born in 1958. Board member since 2011.<br />
main occupation: Senior Advisor SEB Germany.<br />
Previously: CEO InfoMedia, Comhem and Know IT. Senior Executive<br />
Vice President Eniro och SEB.<br />
other board assignments: Board member of Teracom.<br />
JoChen guTbRoD<br />
Board member<br />
Lic. oec. HSG, University of St. Gallen. MSc International Accounting<br />
and Finance, London School of Economics. PhD at Fribourg University<br />
Born in 1963. Board member since 2011.<br />
main occupation: CEO at Raffay Group.<br />
other board assignments: Board member Macmillan Ltd. and VSS Advisory Board. Chairman<br />
Supervisory Board, iFund Services AG and Fundinfo AG.<br />
anDReaS SChÖnenbeRgeR<br />
Board member<br />
MA in Physics, ETH Zurich, PhD in Theoretical Physics, ETH Zurich, MSc<br />
BA, London Business School. Born in 1965. Board member since 2011.<br />
main occupation: Self employed.<br />
Previously: Country Manager Google, Switzerland.<br />
other Board assignments: Board member PubliGroupe Ltd., member of the advisory board of<br />
the institute for marketing and retail, and of the GLA of the institute for media and<br />
communication management of the University of St. Gallen.<br />
CeCiLia LunDbeRg<br />
Deputy Board member<br />
MSc in Business Administration and Economics, Stockholm School of<br />
Economics. Born in 1978. Board member since 2011.<br />
main occupation: Investment Manager at Ratos.<br />
other board assignments: Board member of Anticimex Holding AB<br />
and other companies in the Anticimex Group.<br />
FiLiPPa byLanDeR<br />
Board member<br />
(Employee representative for <strong>Bisnode</strong> AB, SACO)<br />
BA in Business Administration, University of Borlänge. Born in 1970.<br />
Board member since 2009.<br />
main occupation: Accountant at InfoTorg AB.<br />
henRik JoeLSSon<br />
Board member<br />
MSc in Business Administration and Economics, Stockholm School of<br />
Economics, MBA from INSEAD. Born in 1969. Board member since 2005.<br />
main occupation: Investment Director at Ratos.<br />
other board assignments: Board member of Anticimex Holding AB,<br />
EuroMaint Gruppen AB, KVD Kvarndammen AB, Biolin Scientific AB and other companies in<br />
these company groups.<br />
JonaS nyRén<br />
Board member<br />
MSc in Business Administration and Economics, Stockholm School of<br />
Economics. Born in 1951. Board member since 2005.<br />
main occupation: President of Bonnier Holding AB.<br />
other board assignments: Board member of Kungsleden AB and<br />
different companies in the Bonnier Group.<br />
LaRS PeTTeRSSon<br />
Board member<br />
Bachelor of Science in Business Administration, University of Umeå.<br />
Born in 1961. Board member since 2011.<br />
main occupation: Managing Director of Atea Sverige AB.<br />
Previously: Managing Director of QD and Martinsson in Sweden.<br />
CaRL WiLheLm RoS<br />
Board member<br />
MSc in Political Science, University of Lund. Born in 1941. Board<br />
member since 2005.<br />
other board assignments: Chairman of the board of Martin Olsson<br />
Handelsaktiebolag and Sorarb AB. Board member of Anders Wilhelmsen AS,<br />
Camfil AB, INGKA (IKEA) Holding and Skandinaviska Enskilda Banken AB.<br />
Tommy håkanSSon<br />
Board member<br />
(Employee representative for <strong>Bisnode</strong> AB, Unionen)<br />
Studies in System Analysis, University of Lund, Archaeology,<br />
University of Gotland and Project Management, University of Malmö.<br />
Born in 1959. Board member since 2009.<br />
main occupation: Project Manager at Infodata Applicate AB.<br />
auDiToRS<br />
ÖhRLingS PRiCeWaTeRhouSeCooPeRS ab<br />
Bertil Johanson, Authorised Public Accountant, born in 1949.
execuTive<br />
ManaGeMenT TeaM<br />
Johan WaLL<br />
President and ceo<br />
MSc in Engineering Electrical, Royal Institute of Technology in Stockholm.<br />
Visiting scholar at Stanford University, Palo Alto, California.<br />
Employed since 2008 in current position.<br />
Previous positions and experience: CEO of public companies Enea<br />
and Framfab. Internet research at Verizon Communications in Boston. MD and founder of<br />
Internet consulting company Netsolutions.<br />
maRia anSeLmi<br />
competence centre Director Business Information solutions<br />
PhD in Historical Linguistics, University of Rome and Pisa. MSc in<br />
Administration, Master Publitalia, Milan. Employed since 2002 as<br />
Managing Director of <strong>Bisnode</strong> Slovenia, in current position since 2009.<br />
Previous positions and experience: Marketing Manager at Il Sole 24<br />
ORE, Country Manager/Italy at Financial Times Information, Digital New Business Manager at<br />
Italian Exchange, Marketing Director at Mondadori.<br />
maRTin CouFaL<br />
regional Director central europe<br />
BSc in Business Administration, University of Economics, Prague.<br />
Employed since 1996, as Managing Director at HBI and D&B<br />
companies in Central Europe, in current position since 2009.<br />
Previous positions and experience: Several management positions within<br />
<strong>Bisnode</strong> Group. Sales management positions in information providers and consultancy companies.<br />
eCkhaRD geuLen<br />
regional Director DAcH<br />
Diploma and PhD in Electrical Engineering, RWTH Aachen<br />
Employed since 2011 in current position.<br />
Previous positions and experience: Head of Value-Added-Services<br />
Business at Deutsche Telekom, Founder of and Director at Launchgroup/Sapient<br />
Germany, Management Consultant at Boston Consulting Group, Group and<br />
Programme Manager at Ericsson Eurolab.<br />
kaRin SvenSSon<br />
talent Director<br />
BSc in Business Administration and Economics, University of Umeå.<br />
Employed since 2010 in current position.<br />
Previous positions and experience: Management consultant and<br />
Partner at Accenture. Nordic Human Resources Director at Accenture.<br />
FReDRik åkeRman<br />
63<br />
cFo and Business Area Director software and Applications<br />
and Product Information<br />
MSc in Business Administration and Economics, Stockholm School of<br />
Economics. Employed since 2005 in current position.<br />
Previous positions and experience: CEO of BTJ Infodata and Dagens<br />
Nyheter and executive positions in Statoil.<br />
maTTiaS aRonSSon<br />
chief Information officer (cIo) and competence centre Director<br />
credit solutions<br />
MSc in Engineering Physics, Lund Institute of Technology. Studies in<br />
Statistics and Economics, University of Lund.<br />
Employed since 2009 in current position.<br />
Previous positions and experience: Management consultant and partner at Occam Associates.<br />
Consulting positions at McKinsey & Company and A.T. Kearney.<br />
maTS eRWaLD<br />
regional Director nordic<br />
BSc in Business Administration, University of Stockholm.<br />
Employed since 1992, in current position since 2009.<br />
Previous positions and experience: Several senior management<br />
positions within <strong>Bisnode</strong> Group, such as MD at AffärsData, InfoTorg,<br />
CD Förlag and Svensk Handelstidning Justitia.<br />
eLin LJung<br />
corporate communications Director<br />
BSc in Engineering Electronics with a major in Media Communications,<br />
University of Umeå. Diplomas in Business Administration and Marketing.<br />
Employed since 2007 in current position.<br />
Previous positions and experience: Communications Manager of the<br />
public IT companies Addnode and Nocom.<br />
noRbeRT veRkimPe<br />
regional Director BeneFra and competence centre Director<br />
marketing solutions<br />
MSc in Informatics & System Analysis, HRITHO (Ghent).<br />
Employed since 2007, in current position since 2009.<br />
Previous positions and experience: MD for WDM Belgium (former<br />
Sopres Belgium). Internationally active in the setup of electronic customer loyalty conepts, retail<br />
and payment systems.
64<br />
suBsiDiaries<br />
<strong>Bisnode</strong> operates in 17 countries with a segmented<br />
and diversified offering of digital business information<br />
solutions using strong local brands in each market.<br />
AAA soliditet Denmark<br />
www.aaasoliditet.dk<br />
kundeservicedk@soliditet.com<br />
AAA soliditet Finland<br />
www.soliditet.fi<br />
asiakaspalvelu@bisnode.com<br />
AAA soliditet norway<br />
www.soliditet.no<br />
kundeservice@soliditet.no<br />
AAA soliditet sweden<br />
www.soliditet.se<br />
info@soliditet.se<br />
ABc der deutschen Wirtschaft gmbH<br />
www.abconline.de<br />
Info@abconline.de<br />
Anopress It<br />
www.anopress.cz<br />
obschod@anopress.cz<br />
Baby Dm scandinavia<br />
www.bdms.se<br />
info@bdms.se<br />
<strong>Bisnode</strong> Interact<br />
www.bisnode-interact.com<br />
info@bisnode-interact.com<br />
Business check AB<br />
www.businesscheck.se<br />
info@businesscheck.se<br />
ceKIA<br />
www.cekia.cz<br />
marketing@cekia.cz<br />
connectus<br />
www.connectus.ee<br />
info@connectus.ee<br />
credita<br />
www.credita.ch<br />
info@credita.ch<br />
creditinfo czech republic<br />
www.creditinfo.cz<br />
info@creditinfo.cz<br />
creditinfo Poland<br />
www.creditinfo-polska.pl<br />
info@creditinfo-polska.pl<br />
creditinfo slovakia<br />
www.creditinfo.sk<br />
info@creditinfo.sk<br />
Direktmedia sweden<br />
www.direktmedia.se<br />
goteborg@direktmedia.se<br />
Direktmedia norway<br />
www.direktmedia.no<br />
post@direktmedia.no<br />
Direktmedia 121 oy<br />
www.direktmedia121.fi<br />
121@121.fi<br />
D&B Austria<br />
www.dnbaustria.at<br />
office@dnbaustria.at<br />
D&B czech republic<br />
www.dnb.com/cz<br />
custserv@dnbczech.cz<br />
D&B Denmark<br />
www.dnb.com/dk<br />
kundeservicedk@dnbnordic.com<br />
D&B Finland<br />
www.dnb.com/fi<br />
asiakaspalvelu@dnbnordic.com<br />
D&B germany<br />
www.dnbgermany.de<br />
kundensercive@dnbgermany.de<br />
D&B Hungary<br />
www.dnb.com/hu<br />
dbhun@dbhun.hu<br />
D&B norway<br />
www.dnb.com/no<br />
kundeservice.norge@dnbnordic.com<br />
D&B Poland<br />
www.dnb.com/pl<br />
info@dnb.com.pl<br />
D&B sweden<br />
www.dnb.com/se<br />
support.sweden@dnbnordic.com<br />
D&B switzerland<br />
www.dnbswitzerland.ch<br />
info.ch@dnb.com<br />
greens<br />
www.greens.dk<br />
greens@greens.dk
HBI czech republic<br />
www.hbi.cz<br />
info@hbi.cz<br />
HBI Poland<br />
www.hbi.pl<br />
hbi@hbi.pl<br />
HBI company Data Hungary<br />
www.hbi.hu<br />
mail@hbi.hu<br />
Hoppenstedt Firmeninformationen<br />
www.hoppenstedt.de<br />
info@hoppenstedt.de<br />
Hoppenstedt creditcheck<br />
www.myhcc.de<br />
myhcc@hoppenstedt-cc.de<br />
Hoppenstedt Publishing<br />
www.hoppenstedt.de<br />
service@hoppenstedt.de<br />
Hoppenstedt360<br />
www.hoppenstedt360.de<br />
kundenservice@hoppenstedt360.de<br />
Infobon<br />
www.ibon.com<br />
info@ibon.com<br />
Infodata<br />
www.infodata.se<br />
info@infodata.se<br />
Infodata applicate<br />
www.applicate.se<br />
info@applicate.se<br />
Infotorg<br />
www.infotorg.se<br />
info@infotorg.se<br />
Kompass Denmark<br />
www.kompass.dk<br />
kompass@kompass.dk<br />
Kompass Finland<br />
www.kompass.fi<br />
kompass@kompass.fi<br />
Kompass Hungary<br />
www.kompass.hu<br />
kompass@kompass.hu<br />
Kompass norway<br />
www.kompass.no<br />
firmapost@kompass.no<br />
Kompass sweden<br />
www.kompass.se<br />
info@kompass.se<br />
Lundalogik sweden<br />
www.lundalogik.se<br />
info@lundalogik.se<br />
Lundalogik Finland<br />
www.lundalogik.fi<br />
info@lundalogik.se<br />
Lundalogik norway<br />
www.lundalogik.no<br />
post@lundalogik.no<br />
newsline group<br />
www.newslinegroup.se<br />
info@newsline.se<br />
PAr<br />
www.par.se<br />
info@par.se<br />
Pointer<br />
www.pointer.se<br />
info@pointer.se<br />
Poslovna Domena<br />
www.poslovna.hr<br />
kontakt@poslovna.hr<br />
relevant Information<br />
www.relevant.se<br />
info@relevant.se<br />
svensk Handelstidning Justitia<br />
www.shj.se<br />
info@shj.se<br />
svenska nyhetsbrev<br />
www.nyhetsbrev.se<br />
info@nyhetsbrev.se<br />
Vendemore<br />
info@vendemore.com<br />
www.vendemore.com<br />
WDm Belgium<br />
www.wdmbelgium.be<br />
sales@wdmbelgium.be<br />
WDm netherlands<br />
www.wdm.nl<br />
info@wdm.nl<br />
Part of the <strong>Bisnode</strong> Group<br />
WDm.directinet<br />
www.wdmdirectinet.fr<br />
contact@wdmdirectinet.fr<br />
SUR<br />
Wisur<br />
www.wisur.at<br />
auskunftei-wisur@wisur.at<br />
WLW Austria<br />
www.wlw.at<br />
info@wlw.at<br />
WLW czech republic<br />
www.wlw.cz<br />
info@wlw.cz<br />
WLW germany<br />
www.wlw.de<br />
info@wlw.de<br />
WLW croatia<br />
www.wlw.hr<br />
info@wlw.hr<br />
WLW czech republic<br />
www.wlw.cz<br />
info@wlw.cz<br />
WLW switzerland<br />
www.wlw.ch<br />
info@wlw.ch<br />
Yritystele<br />
www.yritystele.fi<br />
myynti@yritystele.fi<br />
65
66<br />
five-year suMMary<br />
SEK millions 2010 2009 2008 2007 2006<br />
Consolidated income statement<br />
Revenue 4,451 4,741 4,325 3,899 3,202<br />
Operating profit, EBITDA 671 728 679 672 595<br />
Operating profit, EBITA 536 593 533 580 506<br />
Operating profit, EBIT 434 428 446 498 443<br />
Profit before tax 285 239 30 347 279<br />
Profit for the year 194 62 16 281 162<br />
Consolidated statement of financial position<br />
Intangible assets 5,182 5,613 6,043 5,163 3,944<br />
Property, plant and equipment 285 367 414 326 191<br />
Other non-current assets 154 142 222 232 221<br />
Current assets 901 949 1,103 920 791<br />
Cash and cash equivalents 259 368 324 214 298<br />
Total assets 6,781 7,439 8,105 6,856 5,445<br />
Equity 1,050 1,150 1,223 2,434 984<br />
Non-current borrowings 3,204 3,529 3,826 1,879 2,650<br />
Other non-current liabilities 509 668 724 646 484<br />
Current borrowings 347 332 393 497 196<br />
Derivative financial instruments 74 136 144 2<br />
Other current liabilities 1,596 1,625 1,795 1,397 1,131<br />
Total equity and liabilities 6,781 7,439 8,105 6,856 5,445<br />
Consolidated statement of cash flow<br />
Cash flow from operating activities 464 471 426 470 186<br />
Cash flow from investing activities -252 -130 -603 -964 -657<br />
Cash flow from financing activities -298 -384 269 403 460<br />
Key ratios<br />
Revenue, SEK M 4,451 4,741 4,325 3,899 3,202<br />
Revenue growth, % -6.1 9.6 10.9 21.8 n/a<br />
Number of employees at 31 December 2,974 3,095 3,189 3,008 2,524<br />
Average number of employees 3,080 3,167 2,940 2,790 2,397<br />
Revenue per employee, SEK K 1,445 1,497 1,471 1,398 1,336<br />
Operating margin, EBITDA, % 15.1 15.4 15.7 17.2 18.6<br />
Operating margin, EBITA, % 12.0 12.5 12.3 14.9 15.8<br />
Operating margin, EBIT, % 9.7 9.0 10.3 12.8 13.8<br />
Net debt, SEK M 2,289 2,685 3,148 2,297 1,673<br />
Net debt/EBITDA 3.41 3.69 4.64 3.42 2.81<br />
DefiniTions<br />
Average number of employees – The average number of full-time employees<br />
during the year.<br />
Earnings per share – Profit attributable to owners of the Parent Company divided<br />
by the average number of shares outstanding.<br />
Net debt – Interest-bearing provisions and liabilities (excluding loans from shareholders)<br />
less cash and cash equivalents and other interest-bearing receivables.<br />
Operating margin – Operating profit, EBIT, EBITA or EBITDA as a percentage of<br />
revenue.<br />
Operating profit, EBIT – Profit before tax and financial items.<br />
Operating profit, EBITA – Profit before tax, financial items and amortisation/<br />
impairment of intangible assets arising from business combinations.<br />
Operating profit, EBITA excluding capital gains – Operating profit, EBITA<br />
adjusted for capital gains and losses from sale of subsidiaries, associates or other<br />
share holdings.<br />
Operating profit, EBITDA – Profit before tax, financial items and depreciation,<br />
amortisation and impairment losses.<br />
Revenue per employee – Revenue divided by the average number of employees.<br />
The figures in the annual report have been rounded off, while the calculations<br />
have been made without rounding off. As a result, the figures in certain tables and<br />
key ratios may appear not to add up correctly.
meenu chourasia<br />
database manager<br />
Cover: Photo of Jonathan Loriaux,<br />
Gretel De Cock and Maji Mokwabo<br />
art direction: Ottoboni<br />
Illustrations: Dan Berglund<br />
Layout: Komodo design<br />
Photo: Sune Fridell and<br />
Yannis Argyropoulos/Killingshoot studio<br />
Copy: Vesir and Open Communications<br />
Printing: Done
Mailing address:<br />
<strong>Bisnode</strong>, S168,<br />
SE-105 99 Stockholm, Sweden<br />
Visiting address:<br />
Sveavägen 168,<br />
Stockholm, Sweden<br />
Office: +46 8 558 059 00<br />
Fax: +46 8 558 059 95<br />
E-mail: info@bisnode.com<br />
Web: www.bisnode.com