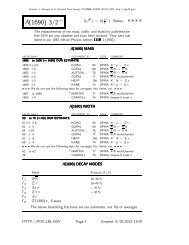
30. Passage of particles through matter 1 - Particle Data Group
30. Passage of particles through matter 1 - Particle Data Group
30. Passage of particles through matter 1 - Particle Data Group

Create successful ePaper yourself
Turn your PDF publications into a flip-book with our unique Google optimized e-Paper software.
8 <strong>30.</strong> <strong>Passage</strong> <strong>of</strong> <strong>particles</strong> <strong>through</strong> <strong>matter</strong><br />
muons below a few hundred GeV (above which radiative effects dominate). R/M<br />
as a function <strong>of</strong> βγ = p/Mc is shown for a variety <strong>of</strong> materials in Fig. <strong>30.</strong>4.<br />
The mass scaling <strong>of</strong> dE/dx and range is valid for the electronic losses described<br />
by the Bethe equation, but not for radiative losses, relevant only for muons and<br />
pions.<br />
For a particle with mass M and momentum Mβγc, Tmax is given by<br />
Tmax =<br />
2mec2 β2γ2 . (<strong>30.</strong>5)<br />
1 + 2γme/M + (me/M) 2<br />
In older references [2,8] the “low-energy” approximation Tmax = 2mec 2 β 2 γ 2 , valid<br />
for 2γme/M ≪ 1, is <strong>of</strong>ten implicit. For a pion in copper, the error thus introduced<br />
into dE/dx is greater than 6% at 100 GeV.<br />
At energies <strong>of</strong> order 100 GeV, the maximum 4-momentum transfer to the<br />
electron can exceed 1 GeV/c, where hadronic structure effects significantly modify<br />
the cross sections. This problem has been investigated by J.D. Jackson [9], who<br />
concluded that for hadrons (but not for large nuclei) corrections to dE/dx are<br />
negligible below energies where radiative effects dominate. While the cross section<br />
for rare hard collisions is modified, the average stopping power, dominated by<br />
many s<strong>of</strong>ter collisions, is almost unchanged.<br />
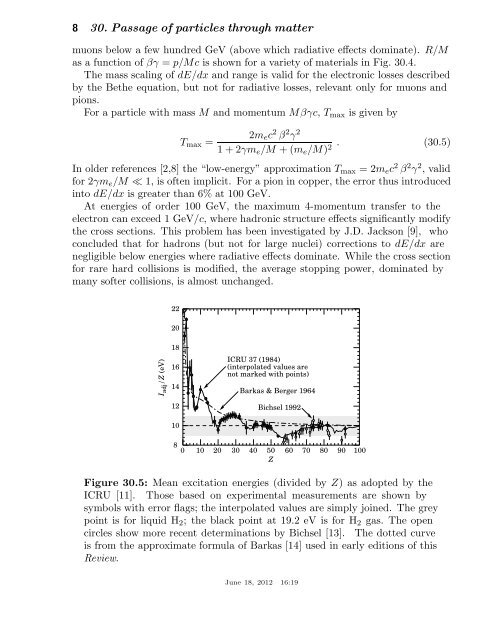
I adj /Z (eV)<br />
22<br />
20<br />
18<br />
16<br />
14<br />
12<br />
10<br />
ICRU 37 (1984)<br />
(interpolated values are<br />
not marked with points)<br />
Barkas & Berger 1964<br />
Bichsel 1992<br />
8<br />
0 10 20 30 40 50<br />
Z<br />
60 70 80 90 100<br />
Figure <strong>30.</strong>5: Mean excitation energies (divided by Z) as adopted by the<br />
ICRU [11]. Those based on experimental measurements are shown by<br />
symbols with error flags; the interpolated values are simply joined. The grey<br />
point is for liquid H2; the black point at 19.2 eV is for H2 gas. The open<br />
circles show more recent determinations by Bichsel [13]. The dotted curve<br />
is from the approximate formula <strong>of</strong> Barkas [14] used in early editions <strong>of</strong> this<br />
Review.<br />
June 18, 2012 16:19