e-Research: A Journal of Undergraduate Work - Chapman University
e-Research: A Journal of Undergraduate Work - Chapman University
e-Research: A Journal of Undergraduate Work - Chapman University

Create successful ePaper yourself
Turn your PDF publications into a flip-book with our unique Google optimized e-Paper software.
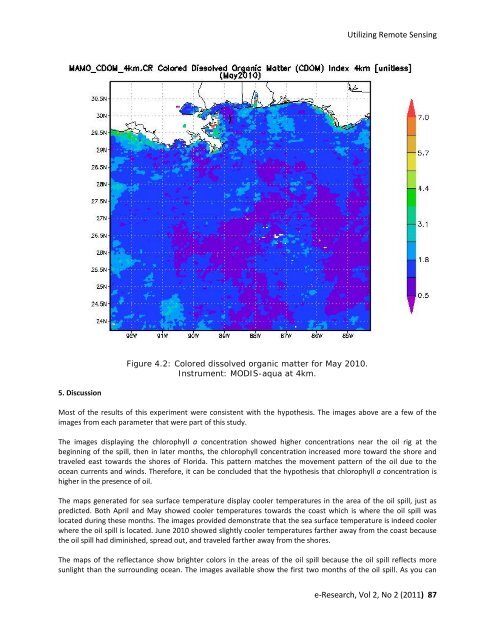
5. Discussion<br />
Figure 4.2: Colored dissolved organic matter for May 2010.<br />
Instrument: MODIS-aqua at 4km.<br />
Utilizing Remote Sensing<br />
Most <strong>of</strong> the results <strong>of</strong> this experiment were consistent with the hypothesis. The images above are a few <strong>of</strong> the<br />
images from each parameter that were part <strong>of</strong> this study.<br />
The images displaying the chlorophyll a concentration showed higher concentrations near the oil rig at the<br />
beginning <strong>of</strong> the spill, then in later months, the chlorophyll concentration increased more toward the shore and<br />
traveled east towards the shores <strong>of</strong> Florida. This pattern matches the movement pattern <strong>of</strong> the oil due to the<br />
ocean currents and winds. Therefore, it can be concluded that the hypothesis that chlorophyll a concentration is<br />
higher in the presence <strong>of</strong> oil.<br />
The maps generated for sea surface temperature display cooler temperatures in the area <strong>of</strong> the oil spill, just as<br />
predicted. Both April and May showed cooler temperatures towards the coast which is where the oil spill was<br />
located during these months. The images provided demonstrate that the sea surface temperature is indeed cooler<br />
where the oil spill is located. June 2010 showed slightly cooler temperatures farther away from the coast because<br />
the oil spill had diminished, spread out, and traveled farther away from the shores.<br />
The maps <strong>of</strong> the reflectance show brighter colors in the areas <strong>of</strong> the oil spill because the oil spill reflects more<br />
sunlight than the surrounding ocean. The images available show the first two months <strong>of</strong> the oil spill. As you can<br />
e-<strong>Research</strong>, Vol 2, No 2 (2011) 87